
Remember me


This multicentre observational retrospective study was approved by the SFR institutional review board (CRM-2103–147).
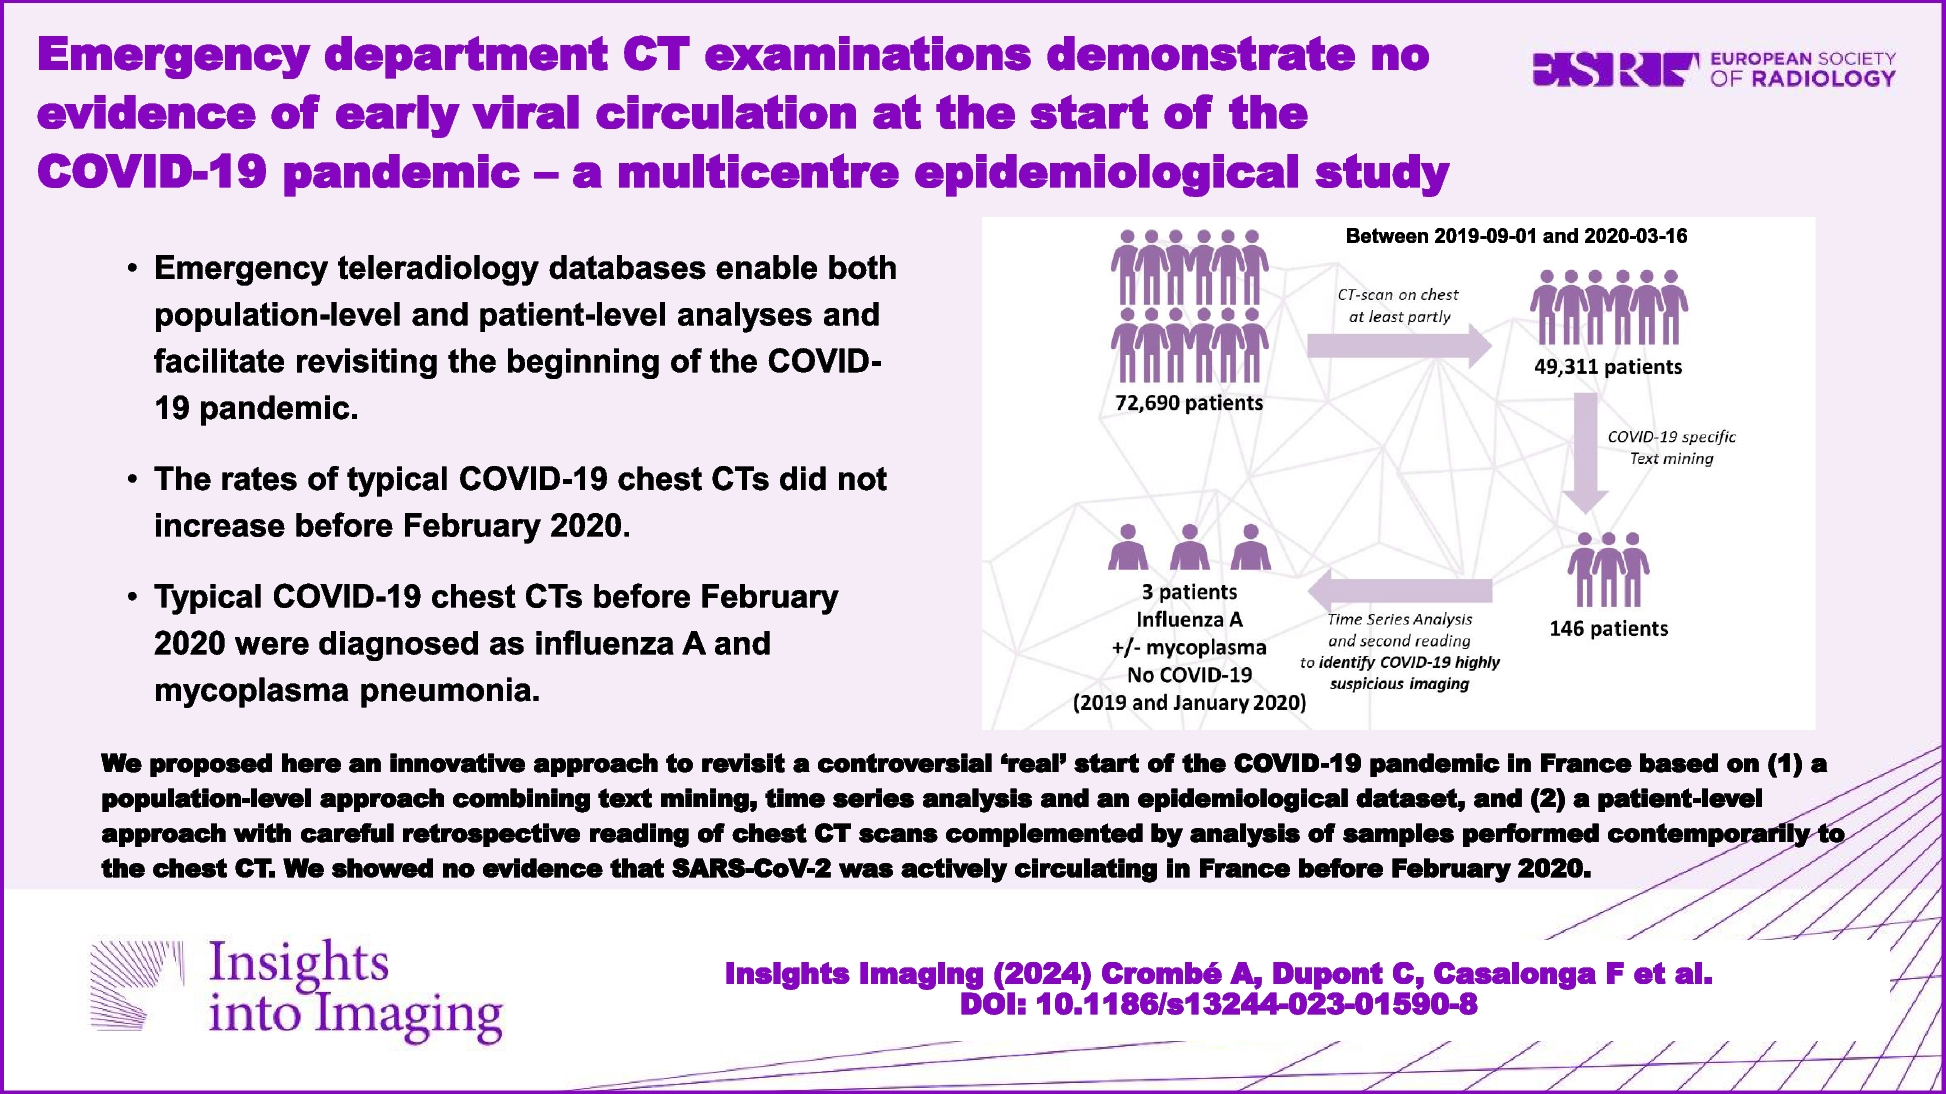
We included all consecutive patients with available radiological reports who underwent CT scans covering the entire or partial chest between September 1, 2019, and March 16, 2020 (day before the 1st lockdown), in the emergency workflow of 61 French partner hospitals of IMADIS teleradiology. Figure 1 shows the flow chart.
Fig. 1
Study flowchart and workflow. Abbreviations: GGO, ground glass opacities
IMADIS teleradiology is a French medical company dedicated to the interpretation of medical imaging for private and public emergency departments throughout France. The teleradiology interpretation protocol met the French recommendations for teleradiology practice. Requests by emergency physicians were received from partner hospitals at our teleradiology centres (Lyon, Bordeaux and Marseille, during the study period), using teleradiology software (ITIS, Deeplink Medical, Lyon, France). The images were securely transferred over a virtual private network to a local picture archiving and communication system for interpretation (Carestream Health 12, Rochester, NY, USA). Images were then interpreted by one of the 167 board-certified radiologists working at IMADIS during the study period. Those radiologists had various backgrounds but at least 2.5 years of experience in emergency imaging. They analysed the imaging in dedicated emergency reading rooms in the teleradiology centres during their on-call duty. The CT protocols were automatically and prospectively encoded in the IMADIS database, which enabled to filter the observations entirely including the chest, and those partly covering the chest, namely, the dorsal spine, the abdomen-pelvis (bottom part of the chest) and CT angiography of the supra-aortic trunks (upper part of the chest).
Data collection consisted in patients’ age, sex, date of CT interpretation, imaging protocol (coverage and use of contrast medium), location of the partner department and whether it was located in a French region where the COVID-19 initially spread (i.e. ‘Grand-Est’, ‘Ile-de-France’, ‘Bourgogne-Franche-Comté’, ‘Auvergne-Rhône-Alpes’, or ‘Provence-Alpes-Côte-d’Azur’, which is also shown on Fig. 2) [5]. The annual number of visits to these centres and the number of inhabitants in the areas covered by these centres were estimated according to the data provided by each hospital.
Fig. 2
Location of the 61 IMADIS partner centres involved in the study. The centres are indicated with red dots. The great regions where the SARS-CoV-2 virus initially spread are highlighted with thick borders and their names are in bold. Abbreviations: A.R.A., Auvergne Rhône Alpes; B.F.C., Bourgogne Franche Comté; C.V.L., Centre Val de Loire; G.E., Grand Est; H.F., Haut de France; I.F., Ile de France; N.A., Nouvelle Aquitaine; P.A.C.A., Provence Alpes Côte d’Azur; P.L., Pays de la Loire
We also collected the number of COVID-19 patients during the study period from the epidemiological dataset available at data.gouv.fr, an open-source platform promoted by French authorities and ‘Santé Publique France’ (SPF dataset) [5]. It must be noted that the SPF dataset and the IMADIS radiological dataset were independent.
Annotating raw textsFirst, we annotated each radiological report using text mining to identify those reports where radiologists noted the presence of ground glass opacities (GGOs), intralobular reticulations, or bilateral and subpleural lung abnormalities in the results and/or conclusion sections. Next, the texts were imported into R (v4.1.0, Vienna, Austria) and preprocessed using the ‘stringr’ package (github.com/tidyverse/stringr, v1.5.0). French accents were removed, and letters were converted to lowercase.
To detect GGOs in textual reports, we first captured the entire sentences containing the French for ‘GGO’ in singular or plural form, including the most common spelling mistakes. We identified whether negative formulations were used preceding GGO in captured sentences by looking for the presence of French equivalents for ‘no’, ‘not’, ‘neither’, ‘without’ or ‘absence of’. If no negative formulation was found, reports were labelled ‘GGO positive’ (and ‘negative’ otherwise).
The same approach was used for ‘reticulation’ to identify ‘reticulation positive’ reports.
Regarding bilateral abnormalities, we captured sentences containing the word ‘bilateral’. Since bilateral abnormal findings can be found outside the chest that have no link to COVID-19, we identified sentences in which ‘bilateral’ was accompanied by the French equivalents for ‘reticulation’, ‘GGO’, ‘fibrosis’, ‘fibrotic’, ‘consolidation’, ‘band’, ‘opacities’, ‘attenuation’ or ‘honeycomb’. We removed sentences with negative formulations before ‘bilateral’. The reports matching these constraints were labelled ‘bilateral positive’.
Regarding subpleural abnormalities, the same approach was used as for ‘bilateral’ abnormalities, except that we captured sentences containing French equivalents for the following variations: ‘sub pleura’, subpleura’, or ‘sub-pleura’. Matching reports were labelled ‘subpleural positive’.
Quality control of the annotationsTo verify the accuracy of these algorithms, we performed a quality control. For each of the four radiological variables, we randomly sampled 100 distinct reports from the entire corpus of reports (50/100 [50%] with positive labels and 50/100 [50%] with negative labels). These 100 reports were carefully read, blinded to the labels from the algorithms, by one senior radiologist (A.Cr., with 5 years of experience in emergency radiology after board certification) in order to provide a reference for the four radiological variables and to confirm that the error rate of the algorithms was < 10% (i.e. accuracy ≥ 90%). In case of doubtful depiction in the sentences of the reports, the radiologist had access to the CT images.
We also calculated the sensitivity, specificity, negative predicted value (NPV), positive predicted value (PPV) and area under the ROC curve (AUROC) with 95% confidence interval (CI) of the four annotation algorithms.
Afterwards, we created a new variable named ‘number of positive features’, which ranged from 0 to 4 depending on the number of labels for ‘positive GGO’, ‘positive reticulation’, ‘positive bilateral’ and ‘positive subpleural’.
Identifying target CT scansThe next step was to identify CT scans to be reviewed by expert radiologists to detect those highly suspicious for COVID-19. As the presence of subpleural GGOs was constantly depicted as specific, we filtered observations with both ‘positive GGO’ and ‘positive subpleural’ labels and named them ‘target CT scans’ (published PPV = 0.81) [9].
Radiological analysis of target CT scansSeven radiologists reviewed the target CT scans: C.D., A.Co., H.N., G.G., F.C., N.F. and T.J., with 1, 5, 3, 12, 2, 7 and 6 years of experience as senior radiologists in emergency imaging, respectively. Additionally, A.Co., H.N., F.C., N.F. and T.J. had expertise in chest imaging with at least 2 years of specialisation in thoracic imaging department from French University Hospitals after their board certification. CT scans were randomly distributed so that three distinct radiologists analysed each scan. They reported the following radiological features (all binary and categorised as ‘yes’ or ‘no’) blinded to initial reports and to other radiologists’ results: (1) GGO; (2) band-like consolidation; (3) intralobular reticulations; (4) GGO as the predominant pattern; (5) subpleural area as the predominant location of abnormal findings; (6) abnormal findings affecting ≥ 2 lobes; (7) bronchitis syndrome; (8) SFR-SIT diagnostic score (categorised as I: no pathologic findings, II: non-SARS-CoV-2 infections, III: indeterminate, IV: findings compatible with COVID-19, V: findings typical for COVID-19; Fig. 3) [1]. For each binary radiological variable (1–7), the consensus result corresponded to the most frequent finding across the 3 radiologists.
Fig. 3
French ‘Société Française de Radiologie’ and ‘Société Française d’Imagerie Thoracique’ adapted classifications for the radiological findings in the setting of a suspicion of coronavirus disease 2019 (COVID-19), or SFR-SIT diagnostic score, categorised as the following: a I: no pathologic findings; b II: non-SARS-CoV-2 infections (herein, bacterial bronchopneumonitis, black arrowheads); c III: indeterminate (herein, subtle subpleural condensations, white arrowhead); d IV: pathologic findings compatible with COVID-19 (herein, a unique subpleural area of ground glass opacity, white arrowhead); e V: pathologic findings typical for COVID-19 lung disease (i.e. multiple ground glass opacities seen in ≥ 2 lobes, with a subpleural predominant locations, possibly associated with band-like condensations and reversible fibrosis). All CT images are in axial plane and lung kernel
The radiologists were also asked to propose an alternative compatible diagnosis, if possible.
Clinical and biological investigations in patients with high suspicion of COVID-19Patients were considered to have highly suspicious chest CTs if the reviewing radiologists classified the CT scan as at least SFR-IV, including at least two SFR-V scores (i.e. SFR-V-V-V and SFR-IV-V-V). At the time of our analysis, most follow-up data were available in our shared information system, enabling us to obtain results from complementary serology or RT-PCR.
Algorithmic predictionsBased on the analyses of the 7 radiologists, we computed the probability of positive SARS-COV-2 RT-PCR according to two publicly available algorithms, one relying on a classification and regression tree (CART) and the second on stepwise logistic regression (Step-LR) [16]. Details regarding the models are provided in Supplementary Data S1.
Statistical analysisStatistical analysis was performed using R (v4.1.0, Vienna, Austria). All tests were two-tailed. A p-value < 0.05 was deemed significant.
Time series analysisFor each week, we calculated (i) the total number of CT scans interpreted, (ii) the number of CT scans with 1, 2, 3 and 4 positive features identified with text mining and (iii) the number of target CT scans. This data frame was converted to a time series using the ‘xts’ package (github.com/joshuaulrich/xts, v0.12.1). We then applied the breakpoints function from the ‘strucchange’ package to investigate whether and when significant structural changes and breaks occurred during the study period (github.com/cran/strucchange, v1.5–2). This function uses a dynamic programming algorithm and identifies the optimal number of breakpoints in a time series (considered piecewise linear models) that minimises the residual sum of squares (RSS) and the number of parameters in the model according to the Bayesian information criterion (BIC) [17].
Moreover, we compared the age, sex, locations, radiological characteristics and the number of positive radiological features in patients from September 2019 to November 2019 (included) and in patients from December 2019 to February 2020 (i.e. once the COVID-19 pandemic started). We used either chi-square tests for categorical variable or unpaired t-test or Mann–Whitney test for numeric variables depending on D’Agostino kurtosis normality test (which applied for dataset with more than 5000 observations, contrarily to classical Shapiro–Wilk normality test). Patients included in March 2020 were excluded as the SARS-CoV-2 was known to actively spread in France at that time [5].
Interobserver reproducibility of radiological analysis and algorithm predictions in target CT scansSince multiple readers analysed different subsets of target CT scans, we used Krippendorff’s alpha (αK) from the ‘irr’ package (github.com/staudlex/irr, v0.84.1) [18]. The 95%CIs were computed using bootstrapping on 1000 replicates of the population.
Agreement between the initial and second readings of the target CT scansWe calculated the percentage of agreement and Kappa index between the initial prospective CT scan report and the second retrospective readings performed for the presence of GGOs and reticulations.
Comments (0)