
記住我
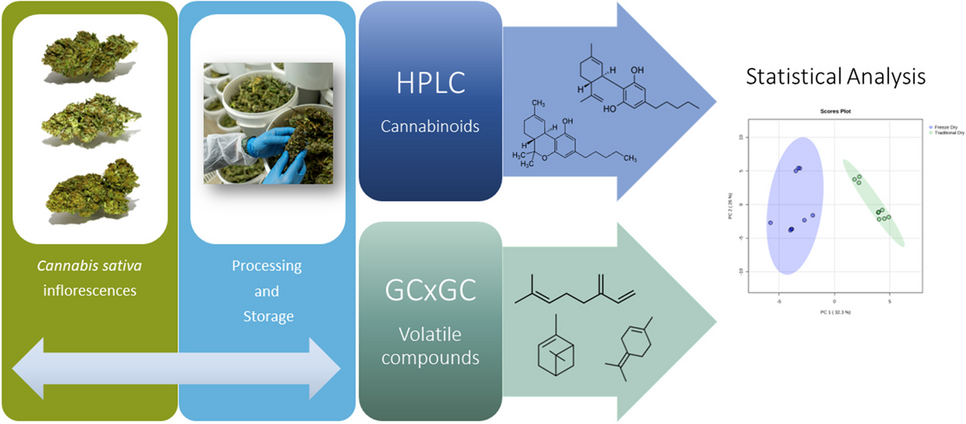

The overall cannabinoid content and VOCs profile, measured for the three cannabis varieties, i.e. Kompolti (K), Eletta Campana (E), and Silvana (S) pooled and visualised by means of PCA score plot (PC1, representing 32.3% of variance, and PC2, 26%) with 95% confidence interval, highlighted a complete separation on PC1 between the samples subjected to “tray drying” (TD) compared to “freeze drying” (FD) conditions (Fig. 1), suggesting significant differences between the two drying methods. In this step, the differences were investigated as a whole, independently from the specific C. sativa variety to stress differences related to drying method on a wide range of samples instead of focusing on single variety variability.
Fig. 1
PCA score plot (PC1 and PC2) of overall metabolites profile (VOCs and cannabinoids) with 95% confidence interval, showing a variation between “tray drying” (TD, green area) and “freeze drying” (FD, light blue area)
To deeply investigate these changes between TD and FD, volcano plot analysis with a fold change threshold of 2 (log2, x-axis) and T-test p-value < 0.05 (− log10, y-axis) was performed with a total of 149 metabolites (Table S1). Among them, 69 metabolites showed significant differences between TD and FD conditions. As clearly shown in Fig. 2 and Table S2, the majority of metabolites (45) were detected at lower abundance in FD, while 24 metabolites showed the opposite trend with respect to TD processing.
Fig. 2
Volcano plot (log2fold change (FC) threshold > 2 on x-axis, and t-test p-value < 0.05 expressed in − log10 on y-axis) showing relevant differences between tray and freeze drying profiles. The blue compounds were detected at lower abundance in freeze-dried samples; the opposite was true for the red ones
Among the 45 negatively affected compounds, 28 belonged to the terpene group, followed by six esters (two carboxylic acid and four fatty acid esters), three cannabinoids, three aldehydes, three alkanes, one furan, and one ketone. The 24 compounds that were positively affected by FD were of various groups: nine terpenes, four alkanes, three aldehydes, two esters and ketones, and one each of alcohols, aromatics, indoles, and one unknown. The top 25 most significant compounds are shown by means of heatmap in Fig. 3. Among them, the most negatively affected metabolites by FD were as follows: (-)-helminthogermacrene (C133), β-myrcene (C32), 3-carene (C35), butanal, 3-methyl- (C5), γ-bisabolene (C129), furan, 2-ethyl- (C8), 2-hexenal (C19), (E)-, camphene (C26), α-pinene (C25), d-limonene (C39), terpinolene (C37), and the two cannabinoids CBG and THC (Fig. 3 and Table S3). Few of the compounds found in the present work, namely, β-myrcene, α-pinene, d-limonene, and terpinolene, contribute to up of 50% of the aroma of cannabis [2, 55]. However, these compounds are relevant not only for their aromatic characteristics, but also because of other crucial pharmacological properties and the “entourage effect”, as described in introduction. Thus, it is clear that the FD technique results into a loss of the predominant cannabis key, multi-property, and aromatic compounds. The cold temperature used during freeze drying and ice crystal formation cause damage to the trichome microstructure [46]. This effect may increase the instant availability of aromatic VOCs resulting in the loss of these compounds during the time of the freeze drying process. Only seven compounds were among the top positively affected by FD (Table S3). Of these, only caryophyllene oxide (C136) and nonanal (C54) have been reported to impact the scent of cannabis [56].
Fig. 3
Hierarchical cluster analysis relative to cannabis inflorescences drying procedures FD and TD showing the top 25 most affected metabolites deriving from volcano plot analysis. Each coloured cell on the map corresponds to the relative measure of each metabolite (column normalised) after Log10 transformation to make metabolite intensity comparable. Cells in red show higher intensity, while those in blue refer to lower intensity. Sample codes refer to: freeze drying (FD), tray drying (TD); cannabis varieties Eletta Campana (E), Silvana (S), and Kompolti (K). The numbers 1, 2, and 3 refer to the biological sample
Concerning cannabinoids, it is worth mentioning that the plant synthesises only the carboxylic acid form, namely, THCA, CBDA, and CBGA. Light and/or heat favour the formation of neutral forms through the decarboxylation of acidic cannabinoids, which are thermally unstable. The extent of the effects of the decarboxylation depends on the neutral to acidic ratio: the lower the ratio, the more relevant the % variation [57, 58]. In this case, despite a not significant change in acidic cannabinoids between TD and FD, the former processing type promotes the formation of neutral cannabinoids, i.e. CBD, CBG, and THC (Figs. 2 and 3), potentially due to the higher drying temperature. Therefore, conditions favouring decarboxylation are enhanced by TD.
In conclusion, FD can limit cannabinoid decarboxylation better than TD. However, it leads to a loss of predominant cannabis aroma compounds and of its distinctive scent. Furthermore, the loss of characterising terpenes may result in a bad appreciation by both the industry and the consumers. Based on these findings, FD does not represent an optimal alternative treatment to TD. For this reason, all the following sections report only results obtained after TD processing condition and upon storage treatments.
Cannabis sativa VOC composition upon storage conditionThe TD cannabis inflorescences were subjected to three storage conditions: (i) 500 mL V airtight box made of high-density polyethylene (HDPE), (ii) open to air dry tray (AT), and (iii) 250 mL lid tight brown glass bottle (GB). To reduce potential influence due to environmental parameters variability, all samples were stored in the same chamber in the dark, at controlled temperature (18 °C), humidity (60%) conditions, for 6 months. The range of VOCs produced by the TD samples before and after storage was accessed using a narrow varietal range, and then the presence of discriminating VOCs among the different storage treatments was evaluated. A total of 143 VOCs were putatively identified from all samples by retention index and spectral comparison with the NIST library; further, six unknown volatiles were also detected (Table S1). Compound groups included 81 terpenes (16 monoterpenes, 26 monoterpenoids, 27 sesquiterpenes, 12 sesquiterpenoids), 16 esters, 13 alcohols, eight alkanes, seven aldehydes, five ketones, four aromatics, three alkenes, three furans, one carboxylic acid, one indole, and one sulphur compound.
The pattern of VOC relative abundance changed greatly among samples and the variables accounted for the 78% of the variability based on PerMANOVA analysis. Significant differences were found before and after storage (PerMANOVA, p < 0.001, R2 = 0.34), amongst varieties (PerMANOVA, p < 0.001, R2 = 0.19), and for the interaction between varieties and storage (PerMANOVA, p < 0.001, R2 = 0.25). Furthermore, 50 variables resulted significantly different over the full set of samples (i.e. TD, GB, AT, HDPE; ANOVA, p < 0.05; Tukey’s post hoc test) (Table S4). Principal component (PC) plots produced from PCA analysis indicated that VOC profiles were not distinct among the Eletta Campana, Kompolti, and Silvana varieties when storage conditions were considered together (Fig. 4A).Conversely, a high degree of separation was obtained when VOC profiles of all varieties were plotted based on storage conditions. Indeed, inflorescences before storage (TD) can be clearly discriminated from after storage (GB, AT, HDPE), while after storage samples partially overlapped on the selected PCs (Fig. 4B).
Fig. 4
Principal component (PC) plots from PC analysis (PCA) based on all VOCs analysed using SPME-GC × GC–MS from three cannabis varieties: “Eletta Campana”, “Kompolti”, “Silvana” by A variety; B before storage (TD) and after storage (black dashed ellipse and GB, AT, HDPE ellipses). Each ellipse represents the 95% confidence interval. The plots use PC1 and PC2 with a percentage of explained variance of 61.4%
Fifteen most discriminatory VOCs were identified using random forest (RF) for the differentiation across storage conditions (Fig. 5A, Table S5) comprising eight terpenes, two alkanes, one alcohol, one aldehyde, and one ketone. The overall out-of-bag (OOB) estimate of error rate was 0.055, while the class error rate was 0.11 for AT and HDPE and 0 for GB and TD. According to the confusion matrices derived from RF (Table 1), one AT sample was misclassified with a HDPE, and one of the HDPE was classified as AT. Furthermore, the principal component plot following RF showed a slight increase in explained variance for PC1 and PC2 (tot 77.4% compared to 61.4% for the complete data set). Moreover, the samples stored in GB were discriminated from those stored on AT; however, the latter overlapped with samples stored in HDPE (Fig. 5B). The 15 RF discriminatory VOCs were also analysed by hierarchical clustering using Euclidian distance and the Ward linkage clustering algorithm to minimise the sum of squares of any two clusters. The results visualised by means of heatmap and dendrogram confirmed the major influence on VOC profile changes due to storage; indeed as previously observed, the after storage preservation of the original VOCs profile can be very challenging [7]. Within storage conditions, samples stored in GB were still full separated from HDPE and AT ones, and the misclassification of HDPE and AT samples was confirmed (Fig. 5C, storage classification). Furthermore, the three varieties showed a minor impact on the changes in VOCs over the different treatments (Fig. 5C, variety classification). However, by looking at TD, the CBG-chemotype IV cannabis (E) showed a greater degree of separation with respect to CBD-chemotype III varieties (K, S), with p-cymene (C38), p-ocimene (C51), and perillyl acetate (C108), contributing to give a characteristic aroma to the CBG variety, Eletta Campana (E). Nevertheless, these differences became much less relevant when samples were subject to storage treatments.
Fig. 5
Results from random forest (RF) treatment classification based on VOCs. A Mean decrease accuracy analysis with VOCs ranched by their contribution to classification accuracy. B Principal component (PC) plots from PC analysis (PCA) based on RF VOCs of TD, GB, AT, and HDPE. Each ellipse represents the 95% confidence interval. The plots use PC1 and PC2 with a percentage of explained variance of 77.4%. C Heatmap and hierarchical clustering analysis obtained using the top discriminatory VOCs obtained with RF of the entire set of samples (see Table S1 compound names in italics). Sample codes refer to (i) tray drying (TD); (ii) airtight box made of high-density polyethylene (HDPE), (iii) open to air dry tray (AT), (iv) lid tight brown glass bottle (GB), (v) Eletta Campana (E), (vi) Kompolti (K), (vii) Silvana. The numbers 1, 2, and 3 refer to the biological sample. Blue to red colour on cells indicates low to high VOC abundance
Table 1 Confusion matrix derived from the random forest performed on the four conditionsIn this context, four main hierarchical clusters among volatile compounds were evident. The first cluster showed lower abundance (blue to white colour on cells) for most of the TD and GB samples, independently from the cannabis variety, and included the monoterpenoid (-)-myrtenol (C78), a compound of the cannabis volatile oils [59]. The second cluster included caryophyllene oxide (C136), a terpene and an essential oil having a significant impact on cannabis aroma [60], as well as nerolidol (C135), a cannabis volatile oil [59], and phenylethyl alcohol (C57) with a characteristic rose-like odour [61]. All these compounds showed lower abundance (blue colour) for TD samples [62], evidencing their formation after all storage treatments. The third cluster is accounted for p-cymene (C38) and p-ocimene (C51), compounds of the cannabis volatile oils [59] which showed higher abundance for GB samples if compared to TD and other storage methods. While the fourth cluster, which included terpinolene (C37), a cyclic monoterpene with a very distinctive smell [63], and (-)-helminthogermacrene (C133), found in a large variety of plants, including cannabis [64], showed higher abundance for most TD samples. This indicates that all storage methods lead to a reduction or degradation of all the compounds of the fourth cluster.
Boxplots of the relative abundance of each VOC within the treatments (i.e. TD, GB, AT, HDPE) are reported in supplementary Figure S1. All the compounds showed significant (p < 0.05) different profile between TD and the storage methods (GB, AT, and HDPE) with the exception of decane (C33), p-cymene (C38), p-ocimene (C51), and (-)-myrtenol (C78). In detail, decane (C33) and (-)-myrtenol (C78) were not significantly different between TD and GB, while p-cymene (C38) and p-ocimene (C51) did not differ among TD, AT, and HDPE. Seven compounds differed significantly between GB and AT, HDPE samples, an additional one differed between GB and HDPE, while only one between HDPE and AT. Among those p-cymene (C38), one of the main components of cumin essential oil, known for its storage stability [65], was significantly higher in GB. This may explain the different behaviour compared to other essential oils, like (-)-myrtenol (C78) and caryophyllene oxide (C136) high after HDPE and AT storage conditions. Indeed, both myrtenol and caryophyllene oxide derive from the oxidation of β-pinene and caryophyllene, reaction favoured by the presence of air [48].
TD treatment led to a prevalence of flavour and aroma compounds, such as perillyl acetate (C108), hexyl acetate (C37), methyl-butanal (C5), and pentamethylheptane (C31), and an intermediate compound in the biosynthesis of sesquiterpenes, namely germacrene (C133) [66]. Storage methods, on the other hand, lead to the enhancement of other flavour compounds, such as myrtenol (C78), phenylethyl alcohol (C57), and sesquiterpenoids, such as nerolidol (C135) and caryophyllene oxide (C136), having woody and sweet aroma and various biological properties including antimicrobial, antioxidant, anti-fungal, anticancer activities [66]. This indicates that storage methods contribute to change the initial aroma of cannabis inflorescences, due to the formation and/or degradation of defined analytes over time.
The similar VOC pattern for HDPE and AT may be linked to the permeability of the HDPE container. It has been demonstrated that plastic materials, conversely to glass, allow for water and oxygen permeability [67] from the external environment through the packaging and vice versa, thus leading to a similar environment between HDPE and AT storage conditions with an exchange of heat, moisture, and oxygen which in turn leads to oxidation reaction.
Cannabinoid changes upon storage conditionsCannabinoid stability and deterioration is influenced by both biological and environmental factors including respiration, growth stage, water loss, pathological and physiological breakdown, light, temperature, relative humidity, and oxygen availability [40, 62, 68]. Moreover, it has been demonstrated that degradation and decarboxylation kinetics of cannabinoids depend on the nature of the target cannabinoid [58, 69]; hence, no generalisation can be made. As an example, THC degradation has a more chemical nature, while CBD degradation follows a more biochemical nature. In this context, the type and material of container used for the storage of cannabis plant products may play a pivotal role in the preservation of cannabinoids. In the following, the detailed investigation of the effect of storage conditions on cannabinoids content will be discussed. ANOVA statistical analysis was performed on the combined two varieties belonging to the CBD-chemotype III (Kompolti and Silvana) for the variables CBDA and CBD, while the third one, Eletta Campana, was treated separately, for the analysis of CBGA and CBG, since it is included in the CBG-chemotype IV. Therefore, the reported results for the above-mentioned cannabinoids derive from the average of the biological samples of two varieties or of the individual third one, respectively (Fig. 6 and Table S6). Minor cannabinoids (THC, THCA, and CBC) were collectively treated among all the cannabis varieties. Concerning the major acid cannabinoids, a similar trend is observed based on the storage method, where GB storage negatively influenced CBDA and CBGA content with respect to TD and the two other storage methods (Fig. 6A), albeit only the change in CBGA content was significantly different. As for the minor cannabinoid components, inflorescences stored under GB conditions showed a slight lower content in the acid cannabinoid THCA and a significant increase in content of the neutral cannabinoids (i.e. THC, CBC, CBG, and CBD) (Fig. 6B). For all cannabinoids, AT and HDPE performed equally, being able to maintain the initial cannabinoid concentrations found in TD for THC, CBC, THCA, and CBDA. In addition, the content of CBG and CBD was lower in AT and HDPE compared to TD and GB, while the opposite was evident for CBGA. As already discussed in the “Cannabis sativa VOC composition upon storage condition” section, glass, being the most inert material, represents a barrier against gases preventing any permeability. In this case, the closed environment inside the glass bottle cannot be in equilibrium with the external environment in terms of heat, moisture, and oxygen content; this may lead to an increase of decarboxylation event that in turn influence the increased formation of neutral cannabinoids (THC, CBC, CBD), as well as a decrease of the carboxylated forms (THCA and CBGA).
Fig. 6
Barplot showing the normalised concentration of A THC, THCA, CBC, CBG, CBD; B CBGA and CBDA cannabinoids before (TD) and after storage in different conditions (HDPE, AT, and GB). * indicates CBG-chemotype IV; ** indicates CBD-chemotypes III. The same letter indicates that mean values are not significantly different from each other (p > 0.05)
This result suggests a change of physiological conditions when inflorescences are stored in glass, highlighting the importance of conducting cannabinoids analysis when inflorescences of cannabis varieties are subjected to long storage. Furthermore, the selection of the material and storage condition will need further attention to better define an optimal storage method.
留言 (0)