
記住我


One hundred and four in-patients were consecutively included in the prospective study conducted in Georges Pompidou European hospital: (i) 81 COVID-19+ patients including 27 patients hospitalized in intensive care unit (ICU) and 54 in the geriatric department (non-ICU) and (ii) 23 patients in the control group (SARS-CoV-2 negative).
The median age of the overall cohort was 86.2 years old [70.8–98.3]. COVID-19+ and control cohorts were matched for age and sex. The main characteristics of the population are summarized in Table 1. Patients in the critical COVID-19+ group (group 3) were younger compared to the other groups.
As described in Table 1, the male/female ratio and Body Mass Index (BMI) were significantly higher in the critical COVID-19+ group (group 3) compared to the other groups. Group 3 patients received less serotonin reuptake inhibitor antidepressant drugs. Comorbidities such as lung and cardiac chronical pathology, hypertension and diabetes were not associated with COVID-19 severity. Consistently, no difference in the Charlson Comorbidity Index was observed. The Rockwood Frailty Index was higher in groups 1 and 2 (non-severe and non-critical group, respectively) compared with group 3 (critical group) and the control group. Death events were observed only in the severity group 3. Dexamethasone as medical care treatment for COVID-19 was recommended by the medical authorities during the study. As expected, mainly severity group 2 and 3 patients benefited from it. Only 5 patients received corticoids for indications other than COVID-19 (no statistical difference between groups).
Immune markers associated with COVID-19 in older peopleIn order to investigate the modifications that occurred during SARS-CoV-2 infection in older patients, the COVID-19+ cohort was compared with the control cohort. The results are presented as means ± standard deviations.
CD8+ T cell senescence in the COVID 19+ compared to the COVID 19− cohort (Fig. 1)Fig. 1
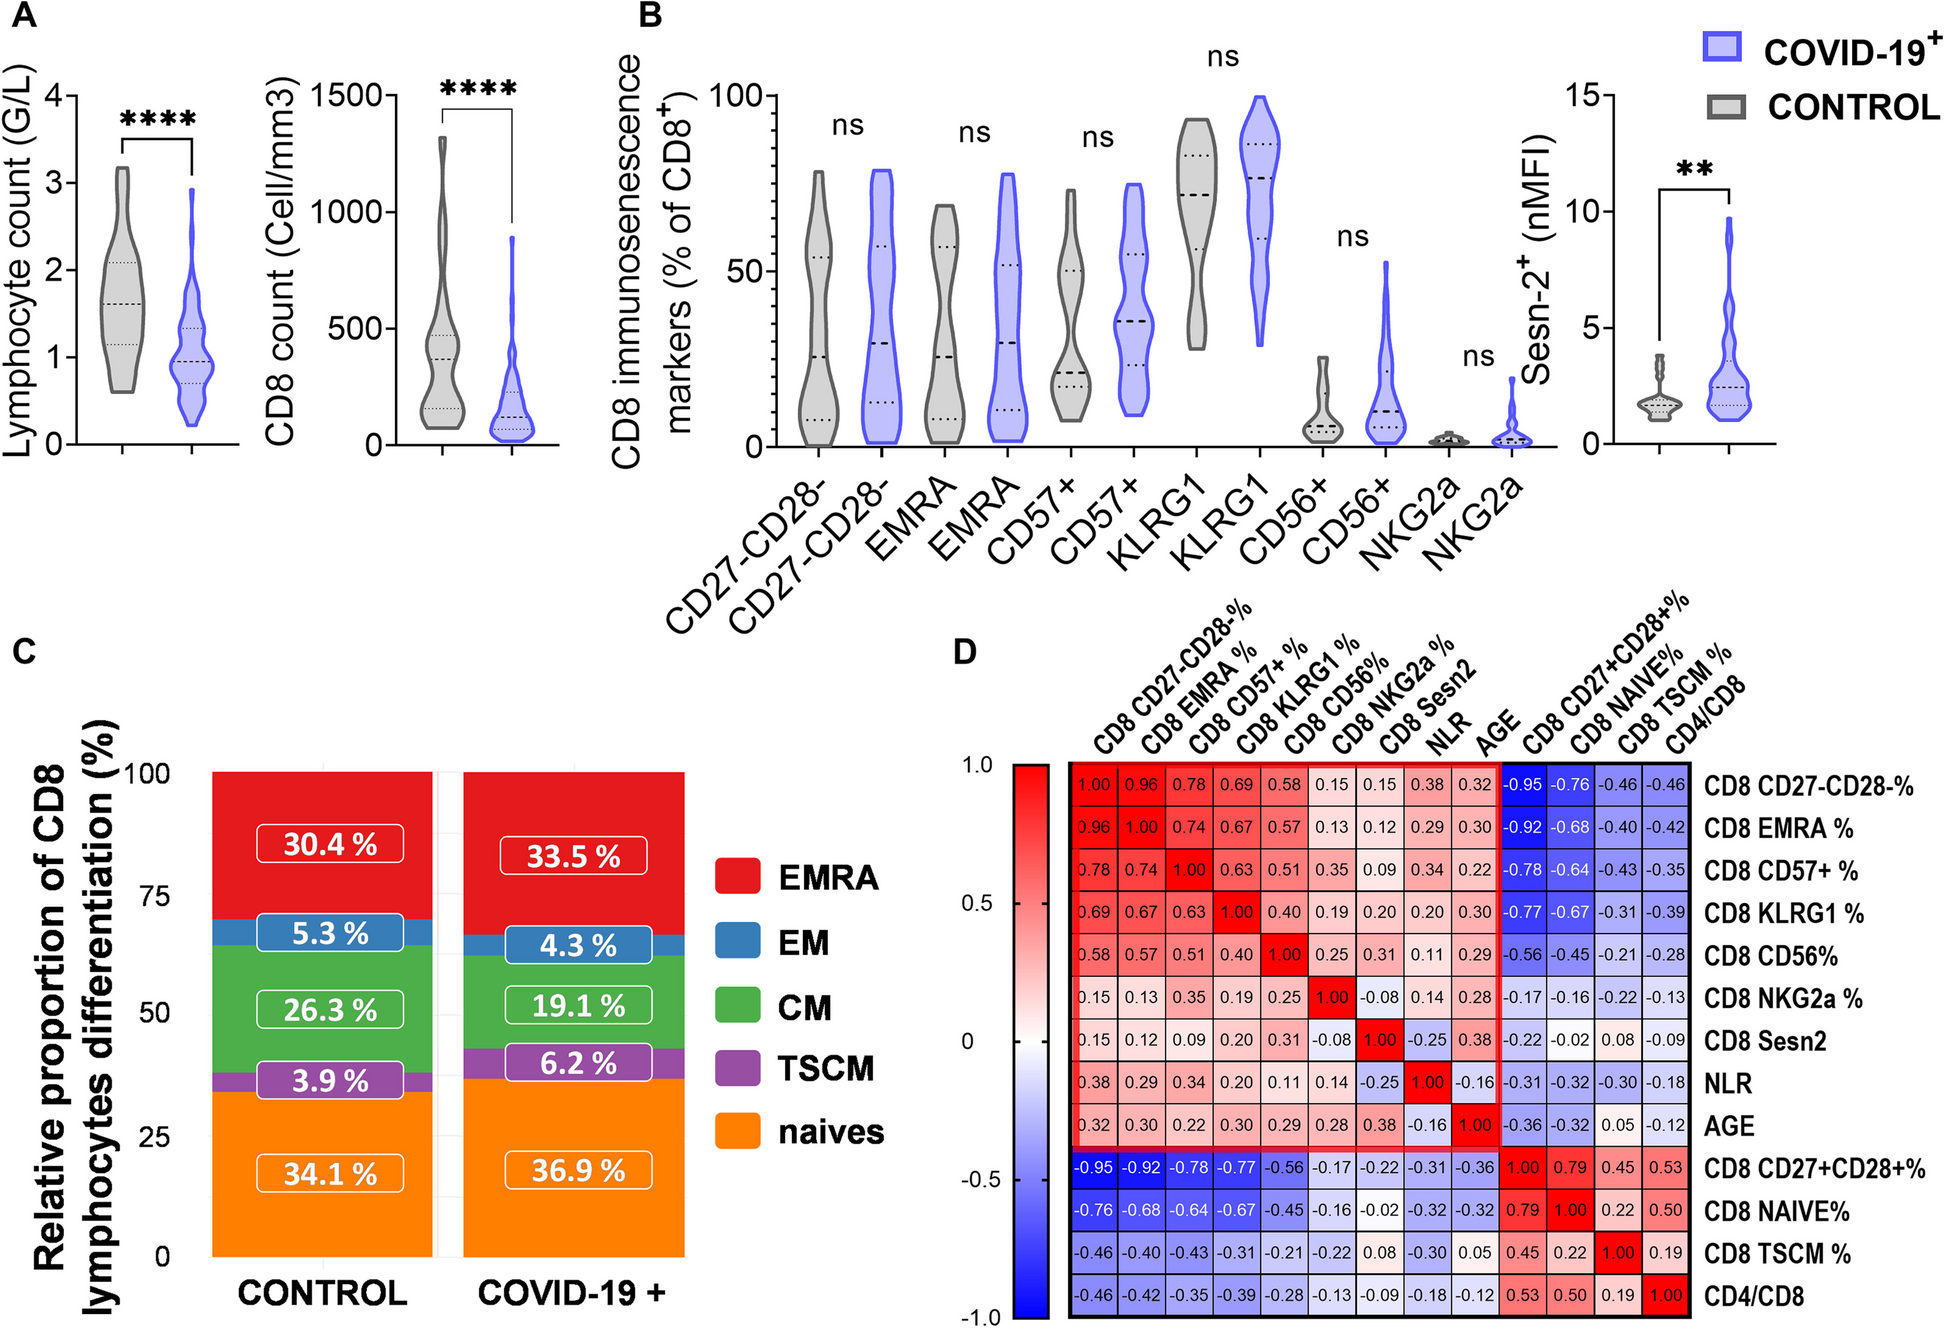
CD8+ T cell senescence and COVID-19 infection. The COVID-19+ cohort (blue violin plot) was compared with the control cohort (grey violin plot) for the following parameters: (A) Lymphocyte and CD8+ T cell counts, (B) CD8 senescence markers characterized by percentage of CD27−CD28−, EMRA, CD57+, KLRG1+, CD56+, NKG2a+ among CD8+ T cell and normalized mean fluorescence intensity of Sestrine-2 (Sesn-2) expression in CD8+ T cell, (C) CD8+ T cell differentiation stages i.e. naïve, T stem cell memory (TSCM), effector memory (EM), central memory (CM) and EMRA percentages among CD8 + T cells and (D) A correlation matrix of these parameters. A red rectangle denotes the CD8 senescence profile. Two-group differences were tested using a two-sided unpaired t-test. The difference was considered as significant when the p-value was equal to or under 0.05. The p-values are summarized with asterisks (< 0.05*, < 0.01**, < 0.001***, < 0.0001****, ns non significant)
The COVID-19+ patients had significantly lower levels of total lymphocytes (1.0 ± 0.1 versus 1.6 ± 0.7 G/L in the control group, p < 0.0001) and CD8+ T cells (170.3 ± 63.8 versus 389.4/mm3 ± 312.1 in the control group, p < 0.0001) (Fig. 1A). The CD4/CD8 ratio was not statistically different between the two groups (4.0 ± 3.1 versus 3.6 ± 2.5 in the COVID-19+ and control group respectively, p = ns).
The percentage of CD57, KLRG1, CD56, NKG2A expressed by CD8+ T cells and late differentiated CD27-CD28-, EMRA CD8 subsets were not significantly different between the COVID-19+ and control cohort (Fig. 1B). In both cohorts, KLRG1 was highly expressed among CD8+ T cells (71.2% ± 2.7 in COVID-19+ versus 67.5% ± 19.8 in control group, p = ns) followed by CD57 (40.2% ± 1.6% versus 32.5% ± 20.2, p = ns), whereas CD56 and NKG2A were weakly if not expressed (14.5% ± 2.1 versus 9.3% ± 7.6 and 4.1%, SD: 1.1% versus 2% ± 0.9 respectively, p = ns). The percentage of the late differentiated CD8+ T cells CD27−CD28− and EMRA subsets were respectively 35.2% ± 2.6 versus 31.5% ± 24.4 and 33.7 ± 2.1 versus 30.3% ± 23.4 (p = ns). CD8+ T cell expression of Sestrin-2 was significantly higher in the COVID-19+ group (nMFI = 3.01 ± 1.92 versus 1.89 ± 0.77 in the control group, p = 0.034 Fig. 1B).
The central memory (CM) population tended to be decreased in absolute count and percentage among CD8+ T cells in the COVID-19+ compared with the control cohort ( p = 0.056) while naive, TSCM, and EM CD8+ T cell subsets were not significantly different (Fig. 1C and Table S1). A lower count of naïve and EM cells, but not TSCM cells, were observed in COVID-19+ patients (Table S1).
Finally, a correlation matrix with the above-mentioned CD8 senescence-related parameters was generated to identify a relevant pattern (Fig. 1D). The CD27−CD28−, EMRA, CD57, KLRG1 and CD56 percentages among CD8+ T cells were significantly positively correlated together (p < 0.05). Sestrin-2 expression, CD56%, CD27−CD28−% and KLRG1% were positively associated with age (p < 0.05). These parameters could therefore define a CD8 senescence profile. The Neutrophil to Lymphocyte Ratio (NLR), usually associated with immunosenescence [27], was positively correlated with CD27−CD28−, EMRA and CD57 percentages among CD8. The percentages of earlier CD8+ T cell stages CD27+CD28+, naïve and TSCM, usually in higher proportion in younger people [28], were inversely correlated with the CD8 senescence profile as did the CD4/CD8 ratio (Fig. 1D).
Inflammaging and myeloid lineage compared to the control cohort and to a younger COVID-19+ cohortCytokines previously described in the literature as associated with senescence (TNFα, IL-6, VEGF, IL-1RA, GM-CSF, CCL20, CXCL8, IL-1β, CXCL1, CXCL2, G-CSF, CCL2 and IL-10) [16, 17, 29, 30] or with the recruitment of myeloid cells (CXCL10, fractalkine and IL-33) were compared between COVID-19+ and control cohorts. Concentrations were significantly higher in the COVID-19+ cohort except for IL-1β, CXCL1, IL-10 and CXCL8 (Table S2). To note, CXCL8 concentrations were considered too low to be interpretable (< 10µg/mL).
To validate the association of these cytokines with senescence during COVID-19 infection, the data set from our cohort (median age of 86 years old) was compared with an independent external dataset of younger patients (median age of 55 years old) for which cytokine concentrations were measured with the same method performed by the same operator in the same laboratory [14]. During COVID-19 infection, TNFα, VEGF, GM-CSF, IL-1β, CXCL10, fractalkine, IL-33 and CCL2 were significantly at higher concentrations in older than younger patients. Conversely, plasma IL-10, CXCL1 and CXCL2 concentrations were significantly lower in older patients compared to younger patients. Plasma IL-6, IL-1Ra, CCL20, CXCL8 and GCSF were found at similar concentrations in young and old patients (Table 2) [14].
Table 2 cytokines in COVID-19+: older versus younger patientsThe neutrophil count was significantly higher in the COVID-19+ compared to the control cohort (6.8 ± 2.4 and 3,7 ± 1.5 G/L respectively, Figure S3). The NLR was also significantly increased in the COVID-19+ compared to the control cohort (10.1 ± 8.1 and 3.1 ± 2.7 respectively, Figure S3). No significant differences between leucocyte and monocyte counts were observed (8.5 ± 5.8 versus 6.8 ± 2.2 and 0.6 ± 0.1 versus 0.6 ± 0.1G/L respectively, Figure S3).
The association between senescent and myeloid cytokines and cells was assessed. In a correlation matrix, TNFα, VEGF, GM-CSF, IL-1β, CXCL10, CCL2, IL-6, CCL20, G-CSF, IL-10, IL-1RA, NLR, neutrophil and monocyte counts positively clustered together and could therefore define a “myelo-senescence” profile. CRP, an inflammation marker increased in inflammaging [30], positively correlated with this profile. GROA/B, fractalkine and IL-33 were not associated with this cluster (Figure S4). Finally, no correlation between the CD8 senescence and myelo-senescence profiles was found (data not shown).
Immune ageing markers associated with COVID-19 severity in older peopleCD8 senescence profileWhen comparing the 3 groups, the critical COVID-19+ patients (group 3) displayed a significantly more severe CD8 lymphopenia than non-critical patients (groups 1 and 2). The percentages of senescent CD8+ T cells i.e. CD27−CD28−, EMRA and CD57 among CD8+ T cells were significantly increased in the severity groups 2 and 3 after adjustment for age (Table 3). To note, these associations were not found when considering the absolute values of these parameters. Sestrin-2 expression by CD8+ T cells was only positively associated with increased severity without adjustment for age. KLRG1 and CD56 expression on CD8 were not associated with severity. The percentage and number of early differentiated CD8+ T cells i.e. TSCM-like and CD27+CD28+ CD8+ T cells were significantly lower in the severity groups 2 and 3 compared to group 1 (Table 3 and Figure S5). To note, this difference was observed in absolute numbers for naïve CD8+ T cells, but not in percentage (Table 3 and Table S1). When comparing CD8 differentiation i.e. EM, EMRA and CM between severity groups, no difference was observed in both numbers and percentages (Table S1).
Table 3 CD8-senescence association with severity Myelo-senescence profile (Fig. 2 and Table S3 ) Fig. 2
Myelo-senescence parameters positively associated with COVID-19 severity. A) CXCL10 (IP-10), VEGF, IL-1b, GM-CSF, MIP-3a, CCL2 (MCP-1), TNFa concentrations (pg/mL), CRP, neutrophil and monocyte counts and Neutrophil to Lymphocyte Ratio (NLR) were compared between severity groups. Two-group differences were tested using a two-sided unpaired t-test. The difference was considered as significant when the p value was equal to or under 0.05. The p value are summarized with asterisks (< 0.05*, < 0.01**, < 0.001***, < 0.0001****). B) Venn diagram showing the cytokines positively associated with: (i) COVID-19 (COVID-19+versus COVID-19−), (ii) age in COVID-19+ patients (older versus younger cohort) and (iii) COVID-19 severity in older people. CXCL10, VEGF, GM-CSF, and CCL2 (MCP-1) are positively associated with age, COVID-19 and severity (results from Venny 2.1.). C) A clustering model (K-means) integrating the relevant senescence variable in a principal component analysis defined 3 clusters. Each point represents an individual for whom we have all the data for the variables listed (CXCL10, VEGF, IL-1B, GM-CSF, CCL2, CRP, neutrophils, monocytes, lymphocytes, NLR). The critical group 3 patients are mainly in the same clusters (red and blue) that is different from the green cluster in which non-severe non-critical patients are dominant
CRP, CXCL10, VEGF, GM-CSF, IL-1β, neutrophil counts and NLR showed a strong positive association with increased severity, both with and without adjustment for age. TNFα, CCL20, CCL2 and monocyte counts were weakly associated with increased severity after adjustment for age. G-CSF, IL-6, IL-1Ra and IL-10 were not associated with severity both with and without adjustment for age.
Immune ageing signature of COVID-19 severity in the elderlyThe cytokines positively associated with ageing, COVID-19 and severity are presented in Fig. 2B. The Venn diagram shows that TNFα, VEGF, GM-CSF, CXCL10 and CCL2 were significantly positively associated with senescence, COVID-19 and severity.
We performed a K means clustering based on variables chosen for their clinical, biological and statistical significance, from which three clusters were identified. The majority of the severity group 1 (non-severe) patients were in the same cluster which was well separated from the critical patients group 3 cluster (Fig. 2C). The severity group 3 cluster displayed a high myelo-senescence signature.
After FDR correction for multiple testing, the factors that remained positively associated with severity were the neutrophil counts, CRP, NLR, VEGF, CXCL10, GM-CSF, IL-1β, CCL2 and monocyte count, CD27−CD28− among CD8+ T cell and clinical variables BMI, serotonin reuptake inhibitors, male sex and the Rockwood Frailty Index. CD27+CD28+ and TSCM percentage among CD8 lymphocytes remained associated with decreased severity (Fig. 3).
Fig. 3
Immune ageing parameters positively associated with COVID-19 severity after correction for multiple testing. After FDR correction of p values for multiple testing, neutrophil, lymphocyte, monocyte count, NLR, CRP, VEGF, CXCL10, IL-10, IL-1B, G-CSF, GM-CSF, CCL2, CD27+CD28+, CD27−CD28−, TSCM-like CD8 + T cells, BMI (Body Mass Index), serotonin reuptake inhibitor (SRI) and Rockwood score were associated with severity. Bivariate analysis are adjusted for age
留言 (0)