
記住我
High performance gel permeation chromatography (HPGPC) was used to analyze the molecular weight and purity of CSGC and CSGs (Additional file SI 1: Fig. S1, S2).The content of total sugar, protein, flavonoid, uronic acid and Mw composition of CSGC and CSGs were summarized in Table 1. The total sugar content of CSGC was lower than that of CSGs, the flavonoid and uronic acid content of CSGC were higher than that of CSGs, and the molecular weight was also different.
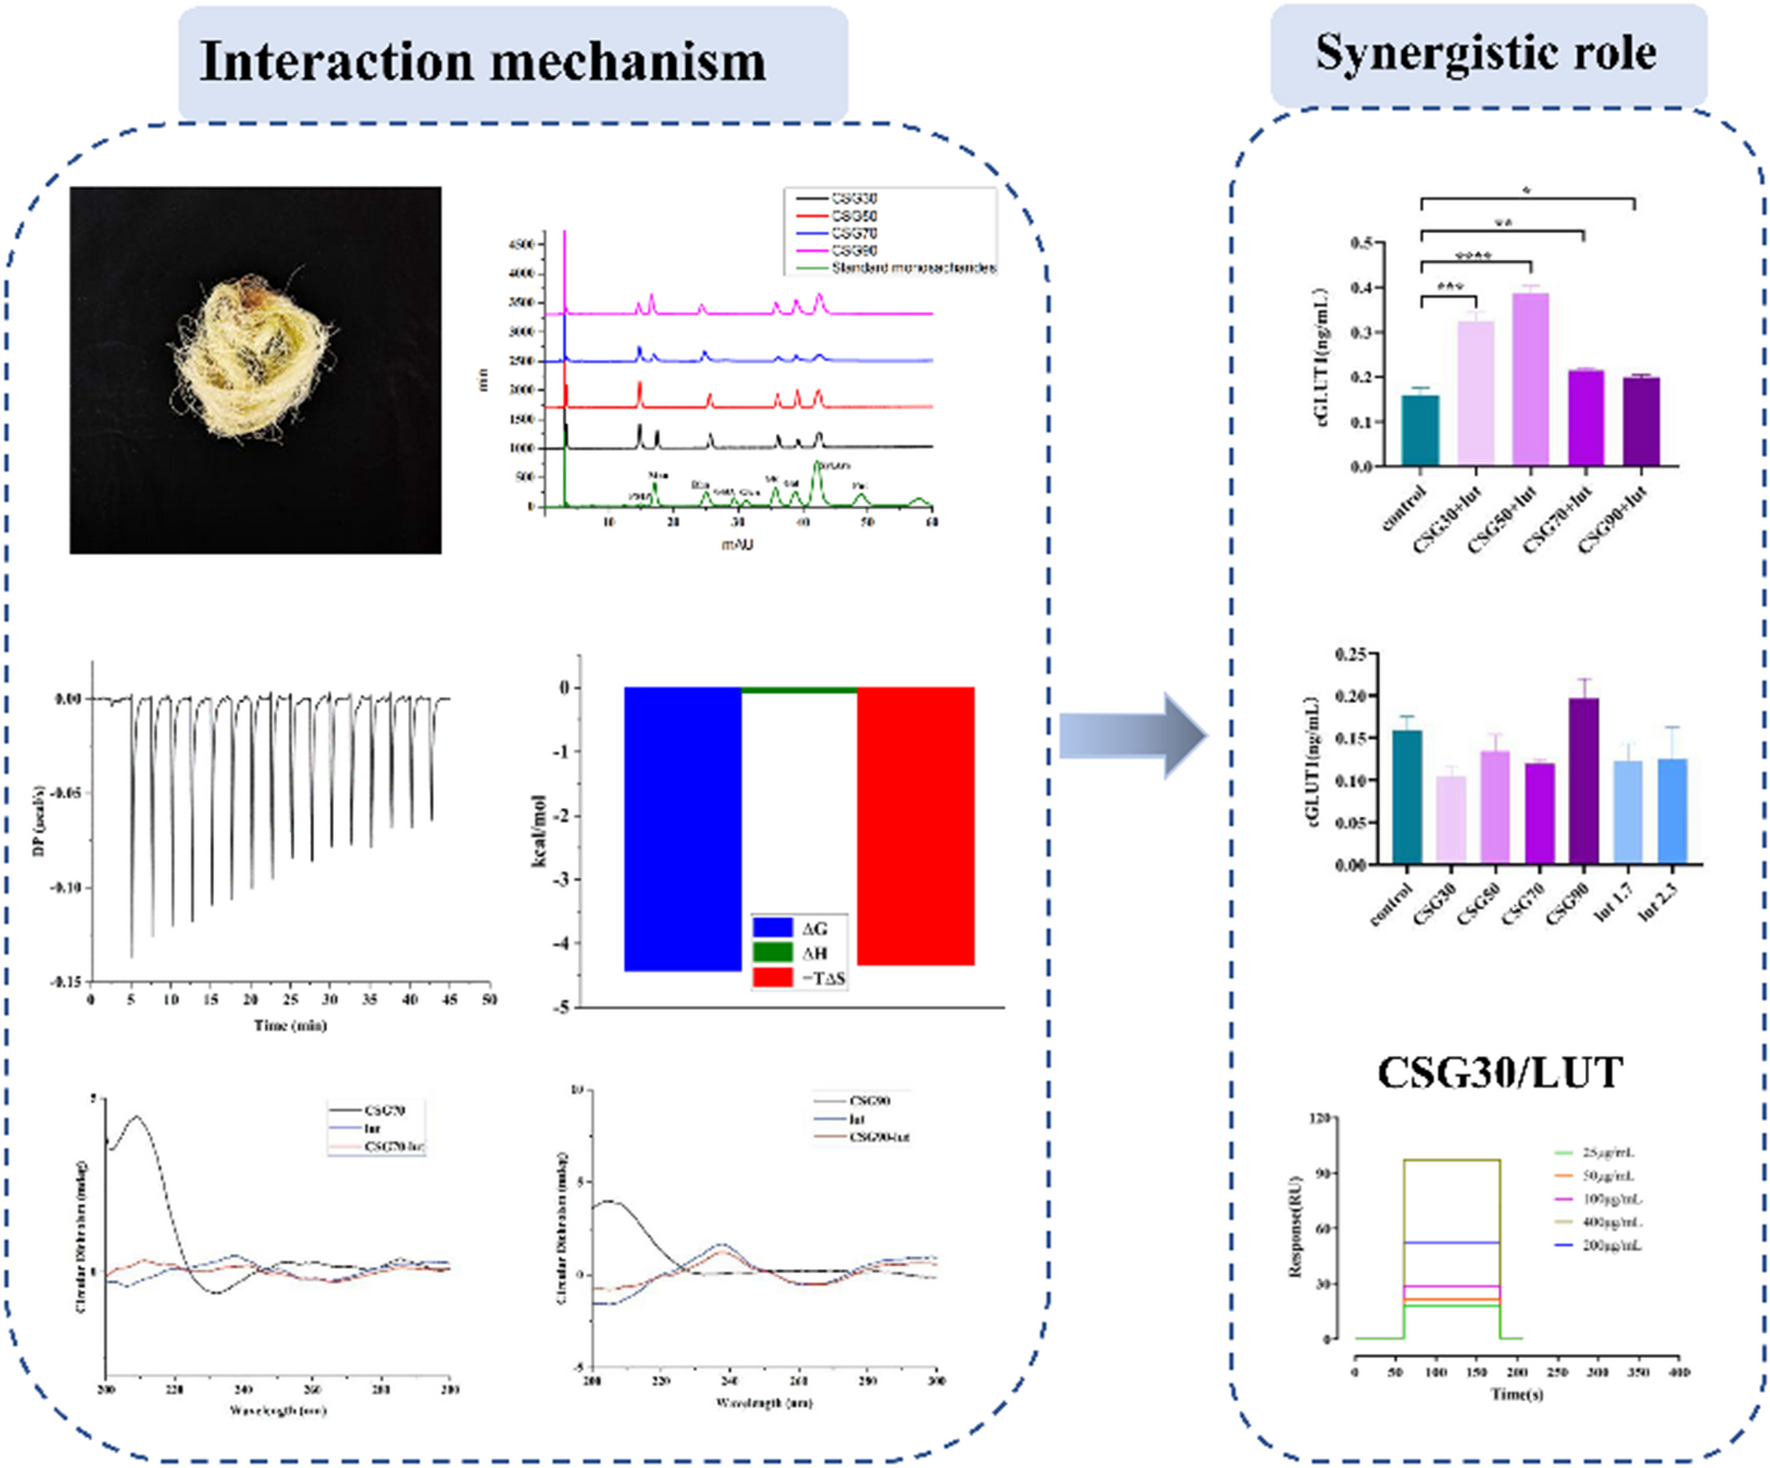
Table 1 Composition and molecular weight analysis of CSGC and CSGs2.2 Assay for monosaccharide compositionThe monosaccharide composition of CSGs was analyzed by PMP derivation method (Fig. 1a). The results showed that CSG30, CSG70, and CSG90 were composed of mannose, rhamnose, glucose, galactose, and arabinose, but with different mole ratio, respectively: 0.21:0.21:0.13:0.19:0.25; 0.15, 0.28, 0.11, 0.15, 0.30; 0.17: 0.12: 0.14: 0.19: 0.37,0.37. CSG50 was deficient in the mannose, with the molar ratio of 0.20: 0.17: 0.22: 0.39. As displayed in the UV spectrum (Fig. 1b), CSGs had no absorption peak from 190 to 400 nm, which confirmed that CSGs did not contain proteins and nucleic acids.
Fig. 1
Primary structural features of CSGs. a Monosaccharide composition of CSGs. b UV spectrum of CSGs
2.3 FT-IR spectrum of CSGsComparing the four FT-IR spectra (Fig. 2), it could be detected that the difference between CSG30, 50 and CSG70, 90 was mainly due to the vibration absorption peak at 2850 cm−1. The divide between CSG 50 and the other three spectrograms was the absorption peak near 599 cm−1 in the fingerprint area. The vibration absorption peak at 2920–2850 cm−1 owed to the stretching vibration of –CH3, –CH2, and –CH [21]. The absorption peak from 1600 cm−1 to 1900 cm−1 attributed to the stretching.
Fig. 2
Primary structural features of CSGs. a IR spectrum of CSG30. b IR spectrum of CSG50. c IR spectrum of CSG70. d IR spectrum of CSG90
vibration of –C=O [22, 23]. The characteristic peaks in the fingerprint area (400–1000 cm−1) could be used to distinguish the types of monosaccharides [24]. The deletion of the absorption peak near 600 cm−1 in CSG50 FT-IR spectra (Fig. 2b) indicated that CSG50 did not contain mannose, which was consistent with the results of CSGs monosaccharide composition analysis. CSG30, CSG50, CSG70, and CSG90 had absorbed around 1625 cm−1, suggesting that all of the CSGs contain uronic acid, which was consistent with the results of uronic acid content.
2.4 Interactions between luteoloside and CSGs2.4.1 CD spectra analysis of LUT and CSGs/LUT complexesWhen the molecule contains several chromogenic groups, the CD spectrum can effectively distinguish the positive and negative Cotton effects (CEs) of each absorption band. Carbonyl compounds can emanate two main transitions due to the influence of other functional groups (electronegativity of oxygen and conjugated double bonds): strong absorption (200–260 nm) of π → π* and weak absorption of n → π* around 300 nm [25]. The content of uronic acid in CSGs is about 5.00%. In the structure of LUT has α, β-unsaturated cyclic ketone. When these two chromophore groups are located closer in space, the CEs occur. The typical absorption bands of carboxylic acid derivatives and α, β-unsaturated cyclic ketone appears at 200 and 240 nm of CSGs groups and LUT group in CD spectra. However, after mixing the LUT to CSGs, the complex groups signals resulted in the CD spectra (Fig. 3). A positive CEs of the complex groups can be seen from 200 to 220 nm regions indicating that this complex was ordered. In addition, negative CEs appeared at 240 nm, suggesting that LUT may be wrapped by CSGs in water solution. The CD spectra of CSGs, LUT, and the mixed group were different evidenced that the mixing of LUT and CSGs forms a new hybrid embodiment [26].
Fig. 3
The interaction of CSGs/LUT complexes were identified by circular dichroism spectroscopy (CD). a CSG30 (5 mg/mL, 40 µL), LUT (3 mg/mL, 260 µL), and CSG30/LUT complexes. b CSG50 (5 mg/mL, 40 µL), LUT (2 mg/mL, 260 µL), and CSG50/LUT complexes. c CSG70 (5 mg/mL, 40 µL), LUT (2 mg/mL, 260 µL), and CSG70/LUT complexes. d CSG90 (2 mg/mL, 40 µL), LUT (3 mg/mL, 260 µL), and CSG90/LUT complexes
2.4.2 ITC analysis of LUT and CSGs/LUT complexesThe interaction mechanism between CSGs and LUT was determined by isothermal titration calorimetry (ITC). Titration with a deionized aqueous solution was used as a blank control (Additional file SI 1: Fig. S3). By titrating the CSGs aqua into the LUT liquor completed, the critical thermodynamic parameters of the equilibrium dissociation constant (KD), binding stoichiometry (N), Gibbs free energy (ΔG), entropy change (-TΔS), and enthalpy change (ΔH) were detected by software analysis. Firstly, the KD value reflected the affinity between LUT and CSGs (Table 2). The result demonstrated that the interactions between LUT and CSG30 are stronger than that in LUT/CSG50, 70, and 90 complexes. Secondly, the negative (ΔG < 0) Gibbs energy measured that the formations of the LUT/CSGs were a spontaneous interaction. Finally, according to the value of N, we calculated that CSG30 (N = 2.0 × 10⁻³), CSG50 (N = 3.7 × 10⁻³), CSG70 (N = 2.6 × 10⁻⁵), and CSG90 (N = 0.139), approximately bind with 500, 270.3, 38461.5, and 7.2 molecules of LUT in the solution (Fig. 4i).
We investigated the dominant intermolecular force to drive the assembly between LUT and CSGs. The signature of LUT and CSG30, 50, and 90 (Fig. 4b, d, h) showed that the ΔH values were negative (− 1.15, − 1.20, and − 8.3 kcal/mol) and the values of − TΔS were negative. This result indicated that the co-assembly between LUT and CSG30, 50, and 90 were enthalpy and entropy driven primarily by hydrogen bonds, hydrophobic effect, van der Waals force, conformational, etc. However, the entropically (− TΔS) driven by conformational and hydrophobic effect could be the hazardous factors in the LUT and CSG70 co-assembly systems (Fig. 4f). The ΔH value of the LUT and CSG70 co-assembly systems was − 159 kcal/mol suggested that the formation of CSG70/LUT was only driven by enthalpy (Additional file SI 1).
Fig. 4
The interaction mechanism of LUT and CSGs. a–h The schematic diagram for CSGs/LUT complexes. a Standard calorimetric titrations of 5 mg/mL CSG30 into 3 mg/mL LUT solution at 25 ℃. b The fitting data of ITC from LUT/CSG30 complexes ΔG, ΔH, −TΔS represented Gibbs free energy of binding (blue), enthalpy changes (green), and entropy changes (red). c The final figure of 5 mg/mL CSG50 into 2 mg/mL LUT solution at 25 ℃. d The signature of ITC from LUT/CSG50 complexes. e Standard calorimetric titrations of 5 mg/mL CSG70 into 2 mg/mL LUT solution at 25 ℃. f The fitting data of ITC from LUT/CSG70 complexes. g The final figure of 2 mg/mL CSG90 into 3 mg/mL LUT solution at 25 ℃. h The signature of ITC from LUT/CSG90 complexes
Table 2 Thermodynamic parameters of interactions between CSGs and luteoloside (LUT) measured by isothermal titration microcalorimetry (ITC)2.4.3 FI-IR analysis of CSGs and CSGs/LUT complexesThe combination of CSGs and LUT was characterized by infrared spectroscopy. The FI-IR spectra of CSGs and CSGs/LUT complex are shown in Fig. 5. The FT-IR spectra of CSGs/LUT after interaction are similar to those of CSGs. The broad peak intensity at 3443.59 cm−1 is lower than that of CSGs, possibly due to a decrease in the number of hydroxyl groups. After the interaction, the tensile vibration strength of methyl C–H (2927.38 cm−1) and the bending vibration strength outside the O–H plane (764.76 cm−1) were weakened, which may be due to the formation of hydrogen bonds between the hydroxyl group of LUT and the hydroxyl group of CSGs.
Fig. 5
Infrared spectra of CSGs and CSGs/LUT
2.4.4 The expression of GLUT-1 by LUT and CSGs/LUT complexesThe changes in GLUT-1 expression can significantly alter the basal glucose uptake. When GLUT-1 expression is increased, it modulates glucose transport into cells and lowers blood sugar [27]. After treatment with LUT and CSGs/LUT complexes, the expression of GLUT-1 in HCT-116 cells was detected. The result suggested that compared with the control group, the CSGs/LUT complexes treated group dramatically raised the expression of GLUT-1 (Fig. 6a). Among them, the GLUT-1 expression level of the CSG30/LUT and CSG50/LUT treatment groups are superior to others (Fig. 6b). The investigate of GLUT-1 expression also hinted that the synergistic role between CSG30, CSG50 and LUT in hypoglycemic activity.
Fig. 6
The expression of GLUT-1 in HCT116 cells after 24 h of treatment with CSGs, LUT and CSGs/LUT complexes. a GLUT-1 expression of CSGs/LUT complex (200 μg/mL) on HCT116 cells. b GLUT-1 expression of CSGs (200 μg/mL) and LUT (1.7 and 2.3 mg/mL) on HCT116 cells. Data represent the means ± standard errors of the means of at least three independent experiments; *p < 0.05, **p < 0.01, and ***p < 0.001
2.5 Assay for direct interaction by surface plasmon resonance (SPR)To further study whether LUT and CSGs/LUT complexes from corn silk directly bind to GLUT-1 protein, we investigated the binding affinity using a SPR system. The data of SPR experimentation showed (Additional file SI 1: Table S1) that the KD values of CSGs/LUT complexes and GLUT-1 (Fig. 7b–e), were 1.70 × 10⁻⁴ M,1.73 × 10−4 M, 2.02 × 10⁻⁴ M, and 1.17 × 10⁻² M, respectively. However, the affinity among LUT and GLUT-1 is only 2.2 × 10⁻² M (Fig. 7a). The affinity of LUT/CSG30, CSG50 and CSG70 complexes on GLUT-1 protein was stronger than that of LUT/CSG90 complex.
Fig. 7
The affinity between LUT, CSGs/LUT complexes and Glut-1. a The sensorgram of LUT interacts with GLUT-1 protein at different concentrations. b–e The sensorgram of CSGs/LUT complexes interacts with GLUT-1 protein at 25, 50, 100, 200, and 400 µg/mL
2.5.1 The expression of insulin by LUT and CSGs/LUT complexesThe level of insulin directly determines the concentration of blood sugar. With CSGs, LUT and CSGs/LUT complexes after processing, the detection of MIN6 cell secretion of insulin. The results showed that the CSGs/LUT complex treatment group significantly increased the secretion of insulin compared with the control group (Fig. 8). Among them, the insulin secretion of CSG70/LUT and CSG90/LUT treatment groups was better than that of other treatment groups. Studies on insulin secretion revealed a synergistic effect between CSG70, CSG90 and LUT.
Fig. 8
MIN6 cells were treated with LUT and CSGs/LUT complexes (100, 200, and 400 µg/mL) for 24 h. We detected the protein secretion of insulin. a The secretion of insulin protein was detected in MIN6 cells treated with LUT. b-e The secretion of insulin protein was detected in MIN6 cells treated with CSGs/LUT complexes. Data represent the means ± standard errors of the means of at least three independent experiments; *p < 0.05, **p < 0.01, and***p < 0.001
留言 (0)