
記住我
Unless otherwise indicated, all cell culture media and supplements were purchased from Biochrom AG, Germany (part of the Merck Millipore, USA).
Tissue collection and ALI-POEC cultureWe collected oviduct tissues from 11 healthy, non-cycling 6-month-old gilts. As the tissues are by-products from a local commercial slaughterhouse (Danish Crown Teterower Fleisch GmbH, Teterow, Germany), ethical approval does not apply to this study. Within 15 min after slaughter, oviducts were excised from the connecting tissues, rinsed twice in cold Dulbecco’s phosphate buffered saline (DPBS) supplemented with 0.05 mg/ml gentamycin, 1 μg/ml amphotericin B, 100 U/ml penicillin, 100 μg/ml streptomycin and immediately kept on ice. In parallel, ovarian morphology was assessed. Oviducts were included in the study if only small follicles and no corpora lutea were visible on the respective ovaries, indicative of a lack of cyclic activity. Samples were transported on ice within 45–60 min to the laboratory for further processing. Oviduct tubes from five animals were segregated into ampullary and isthmic regions to assess histological properties (see Sect. “Histology and histomorphometry”). Oviducts from another five animals were utilized to isolate primary oviductal epithelial cells following our previously established protocols (Chen et al. 2013b; Miessen et al. 2011), involving a sequential enzymatic digestion using 1 mg/ml collagenase from clostridium histolyticum 1A (C2674, Sigma-Aldrich, USA) and Accutase (A1110501, ThermoFisher Scientific, USA) (Chen and Schoen 2021). The freshly isolated POEC were cryopreserved in Gibco Recovery Cell Culture Freezing Medium (12648010, ThermoFisher Scientific, USA) and later thawed according to the manufacturer’s instructions. Freshly isolated POEC from one animal were lysed with ice-cold RIPA buffer (9806, Cell Signaling Technology, USA), and the supernatant was collected after centrifuging at 14,000 × g for 30 min at 4 °C. The cell lysate served as a reference sample for western blot (see Sect. “Western blot”).
Cells acquired from each animal were placed onto 24-well inserts (83.3932.040, Sarstedt, Germany) that had been pre-coated with human collagen IV (C5533, Sigma-Aldrich, USA) at a quantity of 12 inserts per animal. The seeding density was adjusted to 1.5 × 10⁵ cells per insert. The basal compartment was filled with 1 ml of culture medium, while the apical compartment received 0.2 ml of the same medium. The cells were cultured under four distinct conditions (three inserts per condition per animal): (a) one-step approach under 5% O2; (b) one-step approach under 18% O2; (c) two-step approach under 5% O2; (d) two-step approach under 18% O2. The cultures were maintained parallel in two incubators (Heracell 150i/Steri-Cycle i160, ThermoFisher Scientific, USA) set at 37 °C, 5% CO2, and either 5% or 18% O2. Prior to the medium change, all media were pre-equilibrated in their respective incubators for 1 h, and the media were refreshed twice weekly.
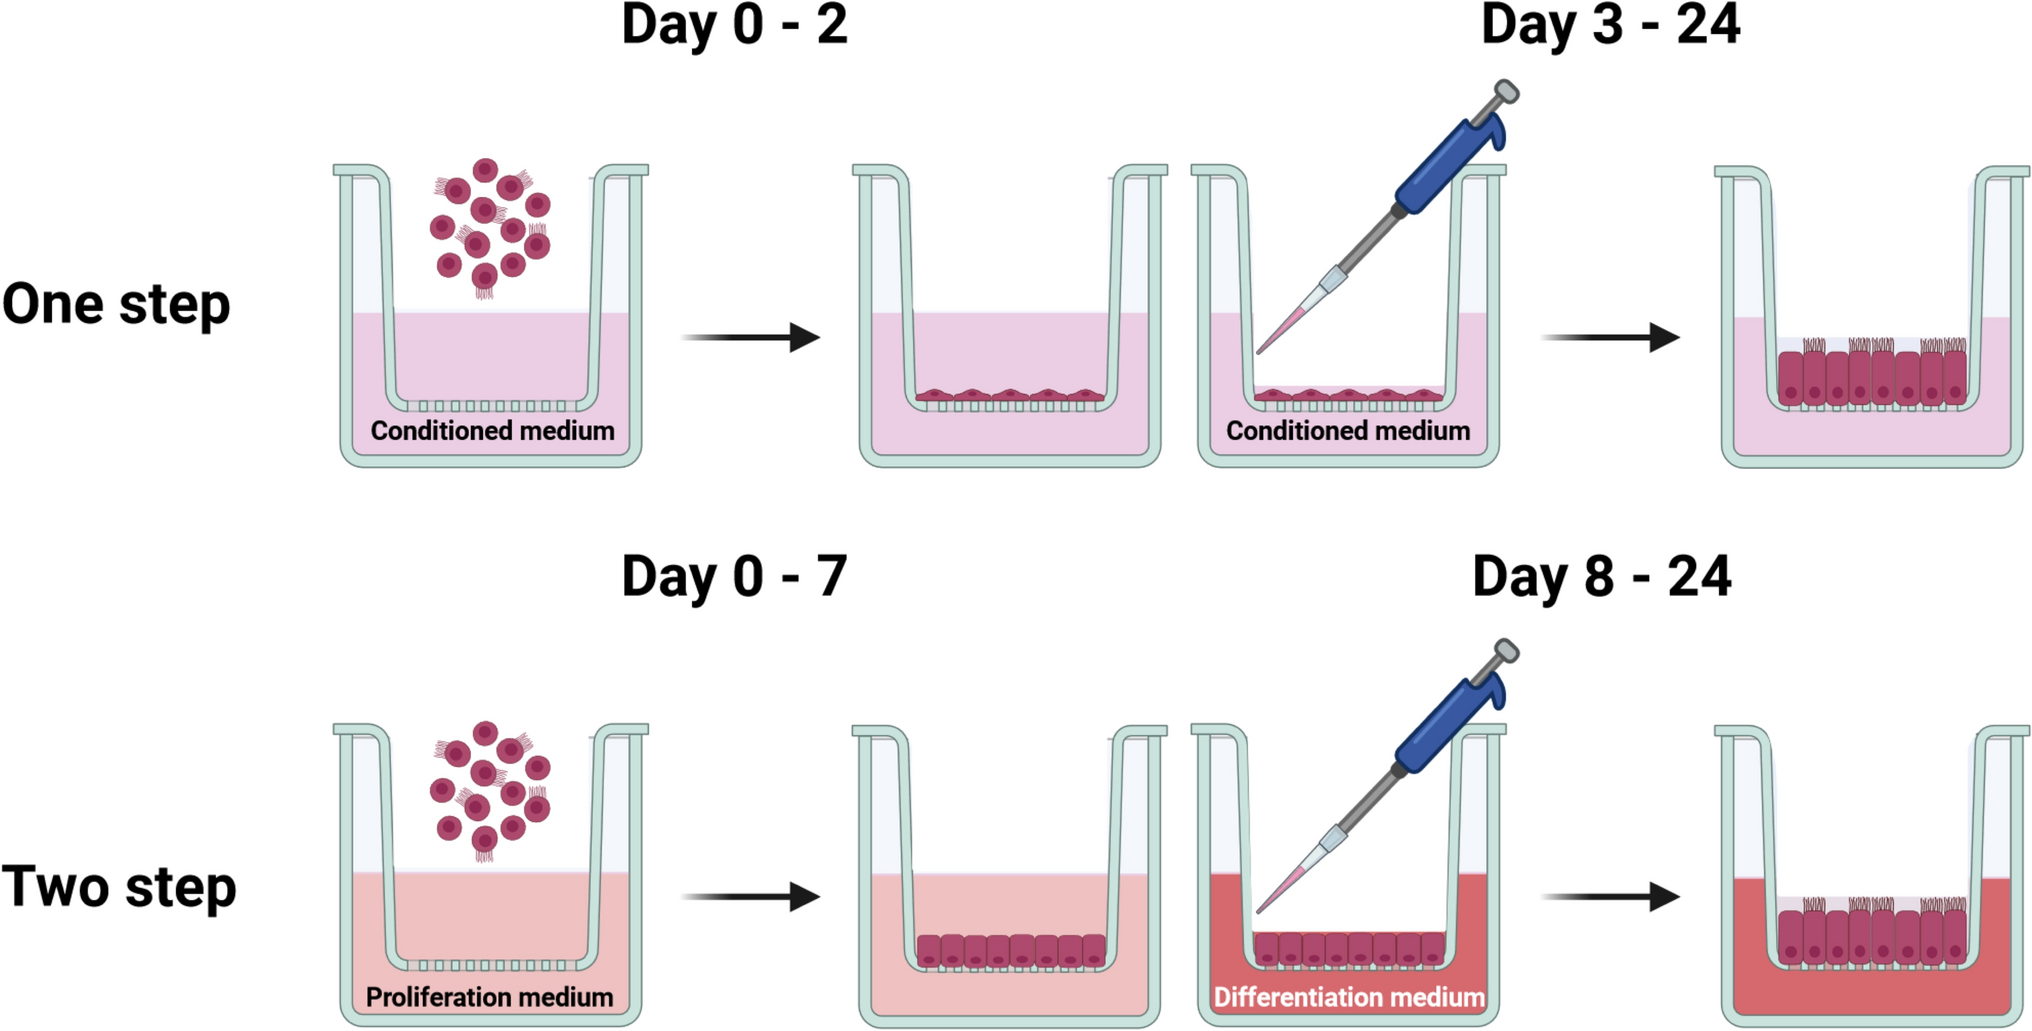
One-step approachThe one-step approach is based on a conditioned medium comprising nutrients and growth factors produced by a mouse embryonic fibroblasts cell line (NIH/3T3, ATCC CRL-1658) to support the growth and differentiation of oviduct epithelial cells throughout the entire culture period, as previously reported by our group (Miessen et al. 2011; Chen and Schoen 2021). Briefly, a stock of 3T3-enriched medium was initially generated using the NIH/3T3 cell line (Miessen et al. 2011). The final conditioned medium was prepared with two parts of Ham’s F-12 supplemented with 10% fetal bovine serum (FBS) and one part of the 3T3-enriched medium. It was then supplied with 0.05 mg/ml gentamycin, 1 μg/ml amphotericin B, 100 U/ml penicillin, 100 μg/ml streptomycin, 0.01 mg/ml ascorbic acid (A4544, Sigma-Aldrich, USA) and 0.01 mg/ml glutathione (G6013, Sigma-Aldrich, USA). Cells were maintained in the conditioned medium at the liquid–liquid interface for 2 days and subsequently differentiated at the ALI until day 24, as illustrated in Fig. 1.
Fig. 1
Schematic diagram illustrating the one-step and two-step approaches for the ALI-POEC culture procedures. ALI air–liquid interface, POEC porcine oviduct epithelial cells. Figure created with BioRender.com
Two-step approachThe two-step approach employed a proliferation medium for the liquid–liquid interface stage until day 7, and a differentiation medium for the ALI stage until day 24, as previously described (Chen et al. 2017; Chen and Schoen 2021) (Fig. 1). Both media were formulated on the basis of a basic medium comprising DMEM/Ham’s F-12 with 2.5 mM L-glutamine, 100 U/ml penicillin, 100 μg/ml streptomycin, 0.25 μg/ml amphotericin B and 15 mM HEPES. The proliferation medium was the basic medium supplemented with 10 µg/ml insulin (I6634, Sigma-Aldrich, USA), 5 µg/ml transferrin (T8158, Sigma-Aldrich, USA), 25 ng/ml epidermal growth factor (E4127, Sigma-Aldrich, USA), 0.1 μg/ml cholera toxin (C8052, Sigma-Aldrich, USA), 30 µg/ml bovine pituitary extract (P1476, Sigma-Aldrich, USA), 5% FBS and freshly added 0.05 μM retinoic acid (R2625, Sigma-Aldrich, USA). The differentiation medium was prepared by supplementing the basic medium with 3% FBS, 2% Nu-Serum growth medium supplement (355100, Corning, USA) and 0.05 μM retinoic acid.
Histology and histomorphometryBouin’s solution was freshly prepared just prior to use by mixing picric acid solution (P6744, Sigma-Aldrich, USA), 35% formaldehyde (4980.1, Carl Roth, Germany) and glacial acetic acid (45726, Sigma-Aldrich, USA) in a volume ratio of 15:5:1. For fixation of the obtained oviduct tissues, they were immersed in Bouin’s solution and kept in the refrigerator overnight. In the case of ALI-POEC cultures, on day 24, one insert per animal per condition was randomly selected for histological fixation immediately after measuring TEER (see next section), following a procedure previously described by our group (Chen and Schoen 2021). In brief, the membranes were gently washed with warm DPBS, and then the apical and basal compartments were filled with 0.2 ml and 1 ml of Bouin’s solution, respectively, for a 2-h incubation period. Subsequently, the membranes were carefully excised and vertically embedded in 1.5–2% agarose (16500-500, Invitrogen, USA), followed by post-fixation in 4% formaldehyde (P087.3, Carl Roth, Germany) for 1 h.
Following fixation, the oviduct tissues and POEC cultures were dehydrated using a series of ascending graded ethanol solutions (80–99%), cleared with Shandon xylene substitute (10128638, ThermoFisher Scientific USA) and then embedded in Paraplast Plus (39602004, Leica Biosystems, Germany). Afterwards, five 3-μm sections per sample were crafted for hematoxylin–eosin (HE) staining and analysed using a Zeiss Axio Imager A1 microscope (Carl Zeiss, Germany), coupled with the AxioVision SE64 Rel. 4.9 image analysis software. For the purpose of histomorphometry, five images were captured at ×400 magnification for each individual section. These images were subsequently subjected to analysis using ImageJ software (Bethesda, USA) to assess cellular features, including total cell counts, epithelial height and secretory cell numbers. The differentiation status of POEC cultures was evaluated using a set of morphological criteria encompassing ciliation, polarity, confluency, uniformity and monolayer formation, as outlined in Table 2. The maximum achievable score for a fully differentiated epithelial structure was 8 points.
Table 2 Morphological scoring system for the ALI-POEC cultures. Maximum score for a fully differentiated culture is 8 pointsTransepithelial electrical resistance (TEER) measurementTo test epithelial barrier formation, TEER measurement was performed before harvesting in all intact inserts using an EVOM2 Epithelial Voltohmmeter (WPI, USA) as detailed in our previously published book chapter (Chen and Schoen 2021). Inserts that displayed evident mechanical damage to the epithelial layer or ruptured membrane resulting from pipette or electrode handling were excluded. The average TEER value from three replicates of inserts was adopted to represent the value for each animal under a specific experimental condition. The new inserts, which contained only the corresponding culture medium during the one-step and two-step procedures without cells, were designated as blank controls. The readings from the corresponding controls were subsequently subtracted from the sample readings to determine the actual resistance of the samples. To calculate the unit area resistance (Ω∗cm2), the true resistance of the sample was multiplied by the membrane area (0.3 cm2 for a 24-well insert).
Oviduct fluid surrogates (OFS) collection and protein quantificationOn day 21, the accumulated OFS on the apical side was aspirated, followed by a careful rinse of the apical side with pre-equilibrated DMEM/Ham’s F-12. After a 72-h interval, the regenerated OFS in the apical compartment was collected from each insert, avoiding contact with the cellular layer. The collected OFS was subjected to two rounds of centrifugation at 2000 × g for 20 min at 4 °C, to eliminate any cellular debris. The resultant OFS was aliquoted and stored at − 70 °C until further use.
Quantification of the protein concentration within the OFS was performed in duplicate using the Micro BCA™ Protein Assay Kit (23235, ThermoFisher Scientific, USA), adhering to the manufacturer’s instructions. The absorbance of the samples was measured at 562 nm using a microplate reader (Infinite 200, TACAN, Switzerland) after a 2-h incubation at 37 °C.
Western blotWestern blot analysis was performed to assess the presence of oviduct-specific glycoprotein (OVGP1) in the OFS. For each sample, an aliquot of 5 μl OFS was mixed with Pierce™ Lane Marker reducing sample buffer (39000, ThermoFisher Scientific, USA) according to the manufacturer’s instruction and boiled at 95 °C for 5 min. Oviduct epithelial cells isolated from one animal were lysed with RIPA buffer and served as a reference sample for both gels (10 μg/lane). The denatured proteins were separated by electrophoresis in 8% SDS–polyacrylamide gels and then electro-transferred onto polyvinylidene difluoride (PVDF) membranes (IPVHC0010, Merck Millipore, USA). Afterwards, the membranes were blocked with 5% non-fat dry milk (T145.2, Carl Roth, Germany) dissolved in PBS/0.2% Tween 20 (9127.1, Carl Roth, Germany) for 1 h at room temperature. Following the blocking step, membranes were incubated with rabbit anti-human OVGP1 primary antibody (ab118590, Abcam, UK, 1:1500, RRID:AB_10898500; the manufacturer validated the anti-OVGP1 primary antibody using human fallopian tube) diluted in PBS/0.2% Tween 20 containing 5% bovine serum albumin (8076.2, Carl Roth, Germany) overnight at 4 °C. The membranes underwent three rounds of washing, each lasting 10 min, using PBS/0.2% Tween 20. Subsequently, the membranes were subjected to incubation for 1.5 h at room temperature with HRP-conjugated goat anti-rabbit IgG antibody (7074S, Cell Signaling Technology, USA, 1:2000, RRID:AB_2099233). Chemiluminescence detection was carried out using the ECLTM Prime Western Blotting Detection Reagent (RPPN2232, GE Healthcare, USA). Blot images were visualized by the AzureSpot system (Azure Biosystems, USA) and later analysed by the AzureSpot analysis software ‘1D gel/Western Blot Analysis’ for band quantification. The area of interest comprising the main OVGP1 signal was manually identified on the image, and lanes were automatically defined using the lane creation mode. The background intensity was subtracted from each blot using the lane edge subtraction method. To maintain consistency, same-sized areas for the major OVGP1 band in each lane were selected to assess the signal intensity. Afterwards, the signal intensity of OVGP1 in each sample lane was normalized against the density of the main OVGP1 band in the reference sample (oviduct cells) on the same gel image. To assess the abundance of OVGP1 in the complete OFS, the normalized signal intensity per microlitre was multiplied by the total volume of OFS produced by the corresponding sample.
RT-qPCR analysisFor gene expression analysis in ALI-POEC, subsequent to TEER measurement, total RNA was isolated from two inserts per animal per culture condition using the NucleoSpin RNA kit (740955.50, Macherey–Nagel, Germany). RNA quantity and quality were assessed using the NanoDrop™ 2000c (ThermoFisher Scientific, USA) and Agilent 2100 Bioanalyzer (Agilent Technologies, Germany), respectively. To prepare cDNA, 1 µg of total RNA was reverse transcribed using the RevertAid reverse transcriptase (EP0441, ThermoFisher Scientific, USA), following the procedure previously described (Palma-Vera et al. 2017). Similarly, qPCR was conducted in duplicate utilizing the SensiFast™ SYBR No-ROX reagents (BIO-98020, Bioline Reagent, USA) in a LightCycler 96 (Roche, Germany) as previously documented (Palma-Vera et al. 2017). The PCR program involved an initial step at 95 °C for 10 min, followed by 40 cycles of 95 °C for 5 s, 60 °C or 62 °C for 15 s, 72 °C for 10 s, and a final melting step at 65 °C for 5 s, and 97 °C for 1 s.
To assess primer efficiency, a standard curve was generated for all primers by conducting a series of 1:10 dilutions of PCR products, ensuring an efficiency ranging between 90% and 100%. Adjusted for the individual primer efficiency, 2−∆∆CT methodology was used to calculate the relative gene expression (Livak and Schmittgen 2001). The geNorm algorithm was used to determine the stability of four housekeeping genes, including actin beta (ACTB), succinate dehydrogenase complex flavoprotein subunit A (SDHA), glyceraldehyde-3-phosphate dehydrogenase (GAPDH), and transforming growth factor β-stimulated clone 22 domain family member 2 (TSC22D2) (Perkins et al. 2012). A normalization factor was calculated on the basis of the geometric mean of the most stable reference genes (ACTB and SDHA). Detailed information about the primers is listed in Table 3.
Table 3 Primer sequences for RT-qPCR with annealing temperaturesStatistical analysisBecause one sample set (animal 4 under one-step approach with 5% O2) demonstrated notably low TEER (Fig. 2g) that fell outside the suitable range for differentiated ALI-POEC culture (Chen et al. 2015), this particular sample set was excluded from subsequent analysis. Data were all analysed using the IBM SPSS Statistics 24 software (USA). The normality of datasets was assessed by the Shapiro–Wilk test. For normally distributed data (p > 0.05) as well as MUC16, in which the variance is homogeneous (p = 0.32) and data is approximately normal (p values within subgroups are 0.19, 0.15, 0.79, 0.05), the two-way analysis of variance (ANOVA) was applied, followed by Student’s t test (Larson 2008; Krzywinski and Altman 2014). For data (PGR, AQP3) that did not conform to a normal distribution, the non-parametric Kruskal–Wallis test was carried out followed by the Mann–Whitney U test. We consider statistical significance if p < 0.05.
Fig. 2
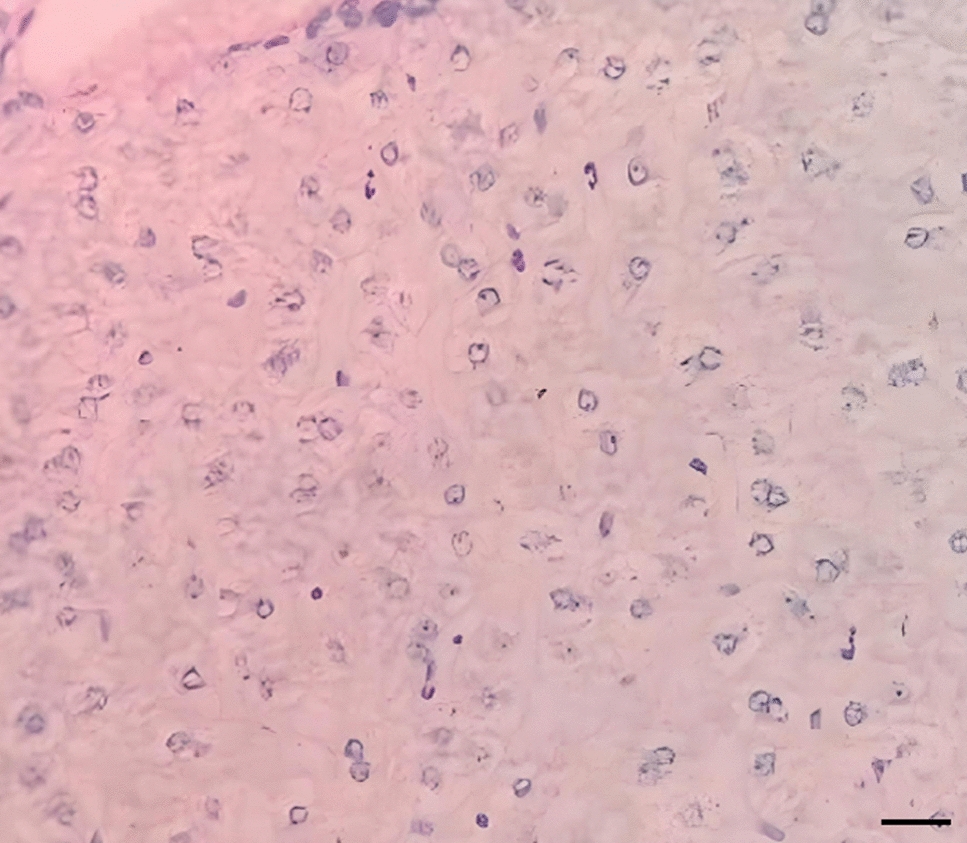
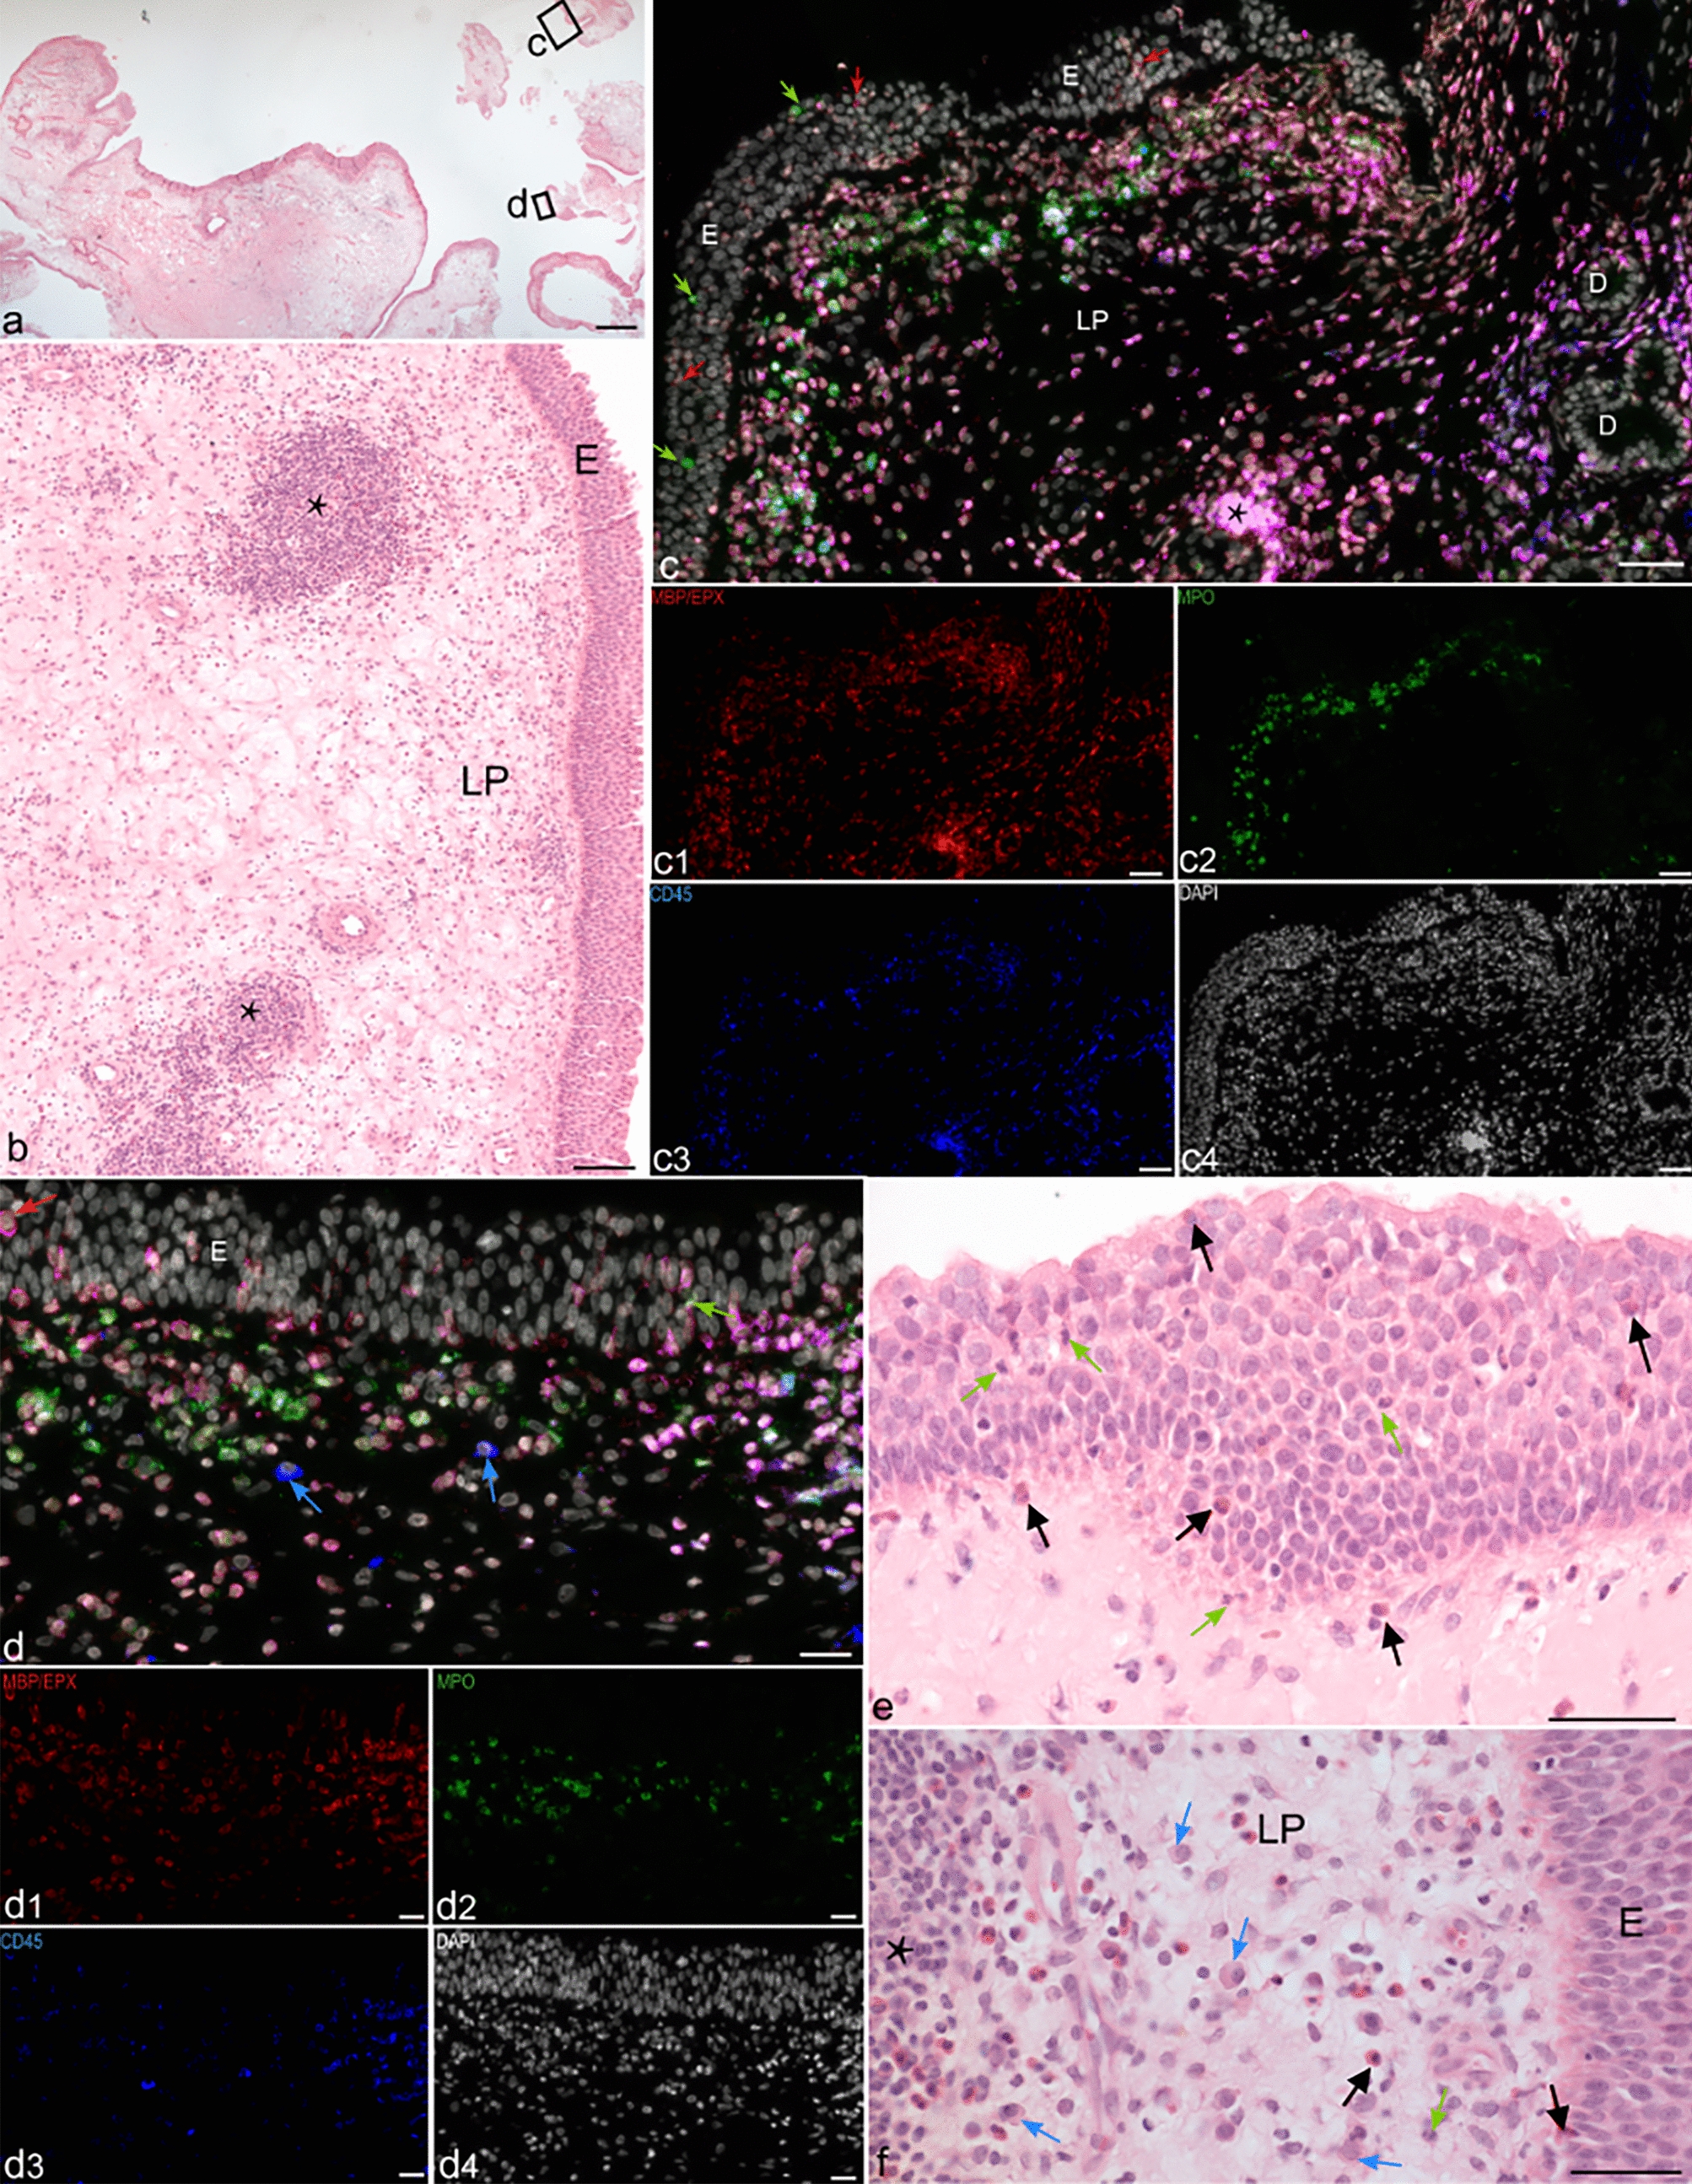
ALI-POEC exhibited in vivo-like morphology and epithelial barrier formation under all tested cell culture conditions. a–f POEC morphology in vitro and in vivo (HE staining, magnification ×400, scale bar = 20 µm). ALI-POEC cultivated under 5% O2 in one-step (a), 18% O2 in one-step (b), 5% O2 in two-step (c) and 18% O2 in two-step approach (d); tissue section of porcine oviduct ampulla (e) and isthmus (f) originating from a non-cycling 6-month-old gilt. g Morphology scores of ALI-POEC cultures and corresponding TEER values. Left y-axis, morphological scores; right y-axis, TEER values (Ω∗cm2). Red dashed lines indicate the TEER range for morphologically intact and differentiated ALI cultures. Shaded area specifically shows animal 4 under 5% O2_one-step media regime, which exhibited poor differentiation and low TEER, and was therefore excluded from further analyses. ALI air–liquid interface, POEC porcine oviduct epithelial cells, TEER transepithelial electrical resistance
留言 (0)