
記住我
Pancreatic cancer (PC) is the seventh leading cause of cancer death worldwide (1) and is predicted to be the second leading cause of cancer death in the United States by 2026 (2). The overall 5-year survival rate of PC is approximately 12% (3). While surgical resection and adjuvant therapy may increase 5-year survival to around 20% (4), more than 80% of patients with PC have advanced stage disease at diagnosis and are not candidates for resection (5). Approximately 90% of pancreatic cancers are pancreatic ductal adenocarcinoma (PDAC) (6). PDAC screening and surveillance may improve prognosis by detecting resectable early-stage PDAC or precursor lesions. Because of its relatively low incidence, PDAC screening is not feasible in the general population. The International Cancer of the Pancreas Screening Consortium guidelines (2013 and 2020) recommend pancreatic screening and surveillance at experienced academic pancreatic centers for PC high-risk individuals (HRIs) with a lifetime risk greater than 5% (7,8). High-risk conditions for PC include familial pancreatic cancer (FPC) and genetic causes. FPC is defined in families where 2 or more first-degree relatives (FDRs) have been diagnosed with PC. Genetic causes associated with PC risk include genes that predispose to inherited syndromes: BRCA1 and BRCA2 (BRCA1/2), STK11, Lynch syndrome (MLH1, MSH2, PMS2, MSH6 genes), CDKN2A, PALB2, ATM, APC, and PRSS1 (9–15). PDAC surveillance programs have shown increased 5-year survival rates to 25% in Europe (16) and 60% in the United States (17) in asymptomatic HRIs with screen-detected neoplasms. We followed a heterogeneous group of PC HRIs for 6 years. We aimed to identify pathogenic germline variants (PGVs) and explore a potential correlation between genetic status, extent of family history, and clinical findings.
METHODSDuring a period of 6 years (recruitment during 2014 and 2015, follow-up for 6 years, until 2020–2021, respectively), 239 Jewish HRIs with PC from 202 families were prospectively followed in a tertiary academic pancreatic referral center located in Tel Aviv, Israel. This cohort study was performed after obtaining institutional review board approval and written consent from each of the individuals included in the study.
All participants were scheduled for annual clinic visits that included evaluation by 2 senior gastroenterologists and a medical geneticist. Participants completed a questionnaire that included personal and familial medical history, dietary habits, daily activities with emphasis on smoking habits, alcohol use, and physical activity. Annual laboratory testing included complete blood count, chemistry profile, HbA1C level, and cancer markers CEA and CA19-9. All participants were scheduled for annual pancreatic imaging by endoscopic ultrasound (EUS) and/or abdominal magnetic resonance imaging (MRI) + magnetic resonance cholangiopancreatography (MRCP). Timing of first imaging was planned to be from age 40 years or 10 years before the youngest PC age occurrence in the family. EUS was performed in the first 2 years, and from the third year onward, MRI + MRCP or EUS was performed. Individuals had an average of 4 clinic visits and 4 imaging procedures.
Genetic evaluation was performed in all individuals. Genomic DNA was extracted from whole blood using a dedicated kit (ArchivePure; 5 PRIME, Gaithersburg, MD) as instructed by manufacturer guidelines. The genetic analysis was performed in 2 stages. First, the entire cohort was screened for a panel of 30 BRCA1/2 founder and predominant PGVs in different Israeli ethnic groups (see Supplementary Table 1, Supplementary Digital Content 3, https://links.lww.com/CTG/B59). Individuals with a normal BRCA1/2 PGV panel result were offered more comprehensive genetic evaluation by either whole-exome sequencing (WES) or a multigene cancer panel. Multigene cancer panel testing was performed by Pronto Diagnostics in Israel. WES was performed by Centogene in Germany.
Seventy individuals were tested by multigene cancer panel, and 43 individuals were tested by WES. Multigene cancer panel and WES were performed mainly in individuals with a family history of familial PC (group 1 as described below in the results section) or familial non-FPC (group 2 as described below in the results section), in similar numbers in both groups. Only few individuals from the hereditary PC group (group 3 as described below in the results section) were tested by multigene cancer panel or WES.
Multigene cancer panel testing performed by Pronto Diagnostics is based on testing the sequence of DNA bases using next-generation technology sequencing of the coding region and its boundaries in the tested genes. The test is performed in a kit developed by Pronto Diagnostics. This kit allows simultaneous sequencing of 44 genes known to be associated with various types of hereditary cancers. The test allows the identification of point changes in the DNA sequence, including small deletion changes. In addition, large deletion and duplication changes are also tested. The run is performed on an Illumina sequencing device. The bioinformatic analysis is performed using the DDM SOPHiA software. The clinical interpretation is performed using database incidences, medical literature, and bioinformatic tools available at the time of the test. Pathogenic and suspected pathogenic changes are not verified by another method as long as they meet the defined quality standards. If findings are found deep in the intron, they are reported if they are unequivocally classified in the literature as pathogenic or suspected to be pathogenic. No polymorphic changes known to be clinically insignificant are reported. Changes defined as variants of unknown significance (VUSs) are not validated in any case; if their level of certainty is less than high, a note is added to that effect. No changes are reported with low confidence. Genomic locations are reported as hg19. The list of the genes tested includes ABRAXAS1, APC, ATM, AXIN2, BAP1, BARD1, BMPR1A, BRCA1, BRCA2, BRIP1, CDH1, CDK4, CDKN2A, CHEK2, CTNNA1, EPCAM, GALNT12, GREM1, HOXB13, MLH1, MRE11, MSH2, MSH3, MSH6, MUTYH, NBN, NF1, NTHL1, PALB2, PIK3CA, PMS2, POLD1, POLE, PTEN, RAD50, RAD51C, RAD51D, RNF43, RPS20, SMAD4, SMARCA4, STK11, P53, and XRCC2.
WES at Centogene: Genomic DNA is enzymatically fragmented, and libraries are generated by PCR-mediated addition of Illumina compatible adapters. The libraries are paired-end sequenced on an Illumina platform to yield an average coverage depth of ∼30×. Centogene's bioinformatics pipeline including read alignment to GRCh37/hg19 genome assembly, variant calling, and annotation is used. Structural variant calling is based on the DRAGEN pipeline from Illumina. All variants with minor allele frequency less than 1% in the gnomAD database and disease-causing variants reported in HGMD, in ClinVar, or in CentoMD are considered. The evaluation is focused on coding exons and flanking ±20 intronic bases; the complete gene region is interrogated for candidate variants with plausible association to the phenotype. All potential modes of inheritance patterns are considered. In addition, provided family history and clinical information are used to evaluate identified variants for their pathogenicity and causality. Variants are categorized into 5 classes (pathogenic, likely pathogenic, VUS, likely benign, benign). All variants related to the phenotype of the patient were reported. Variants of unknown significance are not reported. A specificity of >99.9% for all reported variants is warranted.
The statistical review of the study was performed by a biomedical statistician. Categorical variables were described as frequency and percentage. Continuous variables were evaluated for normal distribution using histogram and reported as mean and SD. χ2 test was used to compare categorical variables, and analysis of variance and independent samples t test were applied to compare continuous variables. All statistical tests were 2-sided, and P < 0.05 was considered as statistically significant. Statistical analysis was performed using SPSS statistical software (IBM SPSS Statistics for Windows, version 24, IBM, Armonk, NY, 2016).
RESULTS Study groupsA total of 239 individuals from 202 families were recruited and followed. Based on family history and results from the initial BRCA1/2 PGV panel analysis, participants were divided into 3 groups. Group 1: FPC (family with 2 or more FDR with PDAC) included 70 individuals from 54 families (26.7%); group 2: familial non-FPC (family with at least 2 biological relatives with PDAC and not meeting FPC criteria, e.g., 1 FDR and at least 1 additional blood relative with PDAC or 2 second-degree relatives with PDAC) included 81 individuals from 73 families (36.1%); and group 3: hereditary PC (individuals with PGV in a PC susceptibility gene and a family member with PDAC carrying the same PGV) included 88 individuals from 75 families (37.1%). Demographic data are presented in Tables 1 and 2.
Table 1. - Demographic data Total cohort FPC Familial non-FPC Hereditary PC No. of patients 239 70 81 88 Male 105 35 32 38 Female 134 35 49 50 Mean age (SEM) 61.3 ± 1.38 55.7 ± 1.3 53.6 ± 1.27 Median age (SD) 62 ± 11.5 53.7 ± 11.5 52.7 ± 11.8 Age at first visit 58 ± 1.38 52.6 ± 1.28 50.2 ± 1.24 Positive smoking history (past or current), n (%) 25 (35.7) 30 (37) 29 (32.95) Type 2 diabetes mellitus, n (%) 10 (14.3) 6 (7.4) 7 (7.95)FPC, familial pancreatic cancer; PC, pancreatic cancer; SEM, standard error of mean.
FDR, first-degree relative; FPC, familial pancreatic cancer; PC, pancreatic cancer; PDAC, pancreatic ductal adenocarcinoma.
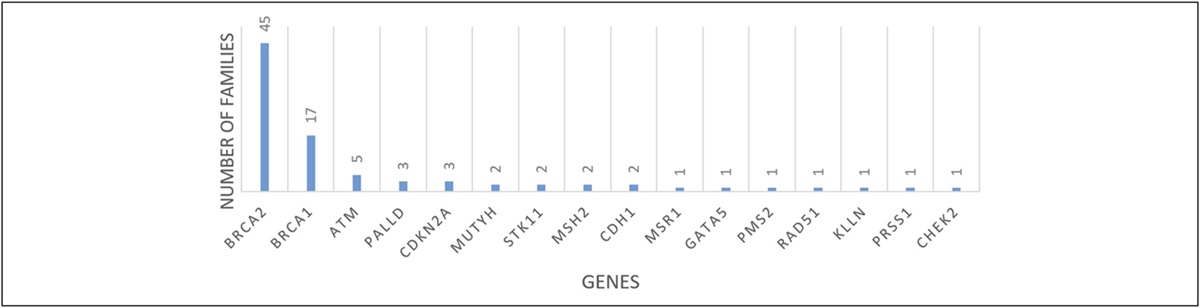
In addition to BRCA1/2 PGV panel analysis that was performed in the entire cohort, multigene cancer panel was performed in 70 individuals and WES was performed in 43 individuals. Genetic variants were found in 88 of the 202 families in our cohort (43.5%). Of these, PGVs were detected in 76 families (37.6%) while in 12 families, genetic variants were defined as VUSs or likely benign changes. We refer to the number of families and not to the number of individual carriers because in each family, there might have been more than 1 affected family member that would have falsely increased the percentage of positive genetic findings. PGVs detected are defined as either pathogenic or likely pathogenic according to American College of Medical Genetics and Genomics classification. Figure 1 shows the number of families with genetic variants that were detected. Table 3 summarizes each coding variant alongside its protein variant and interpretation of pathogenicity according to ClinVar (https://www.ncbi.nlm.nih.gov/clinvar/), Franklin Genoox (https://www.genoox.com), and Varsome (https://varsome.com/variant/hg38) resources (last accessed on Oct 1, 2023).
 Figure 1.:
 Genetic variants. Genes with genetic variants detected in the cohort are presented on the X axis. Bars (Y axis) represent the number of families carrying variants in these genes.
Table 3. - Variants detected and their interpretation Gene variant No. of families Study group ClinVar Franklin Geenox Varsome Method of variant detection BRCA2 c.6174delT, p.Phe2058fs (rs80359550, chr13:32,340,529) 39 Hereditary PC Pathogenic Pathogenic Pathogenic BRCA1/2 mutation panel BRCA2 c.8537_8538del AG (8765delAG), p.Glu2846GlyfsX22 (rs80359714, chr13:32,371,001) 1 Hereditary PC Pathogenic Pathogenic Pathogenic BRCA1/2 mutation panel BRCA2 c.3847_3848del GT (4075delGT), p.Val1283Lysfs*2 (rs80359405, chr13:32,338,202-32,338,203) 1 Hereditary PC Pathogenic Pathogenic Pathogenic BRCA1/2 mutation panel BRCA2 c.3187C>T, p.Gln1063fs (rs1555289789, chr13:32,337,542) 1 Hereditary PC Pathogenic Pathogenic Pathogenic Whole-exome sequencing BRCA2 c.1813_1814insA, p.Ile605fs (rs80359306, chr13: 32333283–32333284) 1 Hereditary PC Pathogenic Pathogenic Pathogenic BRCA1/2 mutation panel BRCA2 c. 3751dupA, p.Thr1251fs (rs397507683, chr13: 32338103–32338104) 1 Hereditary PC Pathogenic Pathogenic Pathogenic BRCA1/2 mutation panel BRCA2 c.4829_4830delTG, p.Val1610fs (rs80359468, chr13: 32339182–32339183) 1 Hereditary PC Pathogenic Pathogenic Pathogenic BRCA1/2 mutation panel BRCA1 c.68_69delAG (185delAG), p.Glu23fs (rs80357914, chr17: 43124028–43124029) 15 Hereditary PC Pathogenic Pathogenic Pathogenic BRCA1/2 mutation panel BRCA1 c.5381_5382insC (5266dup), p.Glu1756fs (rs80357906, chr 17: 43057062–43057063) 2 Hereditary PC Not reported Pathogenic Pathogenic BRCA1/2 mutation panel ATM c.6228delT (6227delT), p.Leu2077fs (rs786203008, chr11: 108317401) 2 Hereditary PC Pathogenic Pathogenic Pathogenic Whole-exome sequencing ATM c.6315G>C, p.Arg2105Ser (rs587780632, chr11:108,317,489) 2 Hereditary PC Conflicting interpretations of pathogenicity VUS VUS Whole-exome sequencing ATM c.1703G>T, p.Arg568Ile, (rs200381392, chr11:108251932) 1 Hereditary PC Conflicting interpretations of pathogenicity Likely benign Likely benign Multigene panel PALLD c.2285T>C, p.Ile762Thr (rs757164572, chr4:168898527) 2 Familial non-FPC VUS VUS Likely benign Whole-exome sequencing PALLD c.368C>T, p.Ala123Val (rs751116198, chr4: 168511872) 1 FPC VUS VUS Likely benign Whole-exome sequencing CDKN2A c.176T>G, p.Val59Gly (rs104894099, chr9: 21971183) 3 FPC Pathogenic Likely pathogenic Likely pathogenic Multigene panel MUTYH c.1187G>A, p.Gly368Asp (rs36053993, chr1: 45331556) 1 Familial non-FPC Pathogenic Pathogenic Pathogenic Whole-exome sequencing MUTYH c.1227_1228dupGC (1143_1144dup), p.His410fs (rs2275602, chr1: 45331431) 1 Familial non-FPC Pathogenic Likely pathogenic Likely pathogenic Multigene panel STK11 c.992G>A, p.Arg331Gly (rs371264852, chr19:1223056) 1 Hereditary PC Conflicting interpretations of pathogenicity VUS Benign Multigene panel STK11 c.290+1G>A (rs1131690950, chr 19:1207204) 1 Hereditary PC Pathogenic Pathogenic Pathogenic Multigene panel MSH2 c.2634+1G>A (rs267608019, chr 2:4748087) 1 Hereditary PC Pathogenic Pathogenic Pathogenic Multigene panel MSH2 c.970_971delCA, p.Gln324fs (rs63751044, chr2: 47416323) 1 Hereditary PC Pathogenic Pathogenic Pathogenic Multigene panel CDH1 c.1849G>A, p.Ala617Thr (rs33935154, chr16:68822138) 1 Hereditary PC Benign Benign Benign Multigene panel CDH1 c.2440-6C>G (rs139757930, chr16:68833284) 1 Familial non-FPC Benign Benign Benign Whole-exome sequencing MSR1 c.877C>T, p.Arg293fs (rs41341748, chr8:16,155,085) 1 FPC Conflicting interpretations of pathogenicity Pathogenic VUS Whole-exome sequencing GATA5 c.616G>C, p.Gly206Arg (rs141050743, chr20:62473486) 1 FPC Conflicting interpretations of pathogenicity Likely pathogenic Likely benign Whole-exome sequencing PMS2 c.1243G>A, p.Val415Met (rs138387687, chr7:5987522) 1 Hereditary PC Conflicting interpretations of pathogenicity VUS Likely benign Multigene panel RAD51 c.166C>T, p.Pro56Ser (rs45623838, chr15:40701142) 1 Familial non-FPC Benign VUS Benign Multigene panel KLLN c.197G>A, p.Arg66His (rs780478359, chr10:87862291) 1 Familial non-FPC Not reported VUS VUS Whole-exome sequencing PRSS1 c.292C>A, p.Gln98Lys (rs750348889, chr7:142751865) 1 Hereditary PC Likely benign VUS Likely benign Multigene panel CHEK2 c.1412C>T, p.Pro471Leu (rs28909981, chr22:28694081) 1 Hereditary PC VUS VUS Likely benign Whole-exome sequencingPC, pancreatic cancer; VUS, variant of unknown significance.
Most PGVs were found in BRCA2 (45 families) and BRCA1 (17 families), correlating with 30.7% of all families (62/202). Other genes with PGVs included ATM (5 families), PALLD (3 families), and CDKN2A (3 families). Three families had a variant in a Lynch syndrome-associated gene (2 in MSH2 and 1 in PMS2), 2 families had MUTYH variants, and 2 families had STK11 variants. Four families had a variant in breast cancer-associated genes (2 in CDH1, 1 in RAD51, and 1 in CHEK2). Four families had variants in other genes: MSR1 (1 family), GATA5 (1 family), KLLN (1 family), and PRSS1 (1 family). Most PGVs were detected in genes known as pancreatic cancer risk genes while only few PGVs were detected in genes not considered to be directly related to pancreatic cancer risk (MUTYH, CDH1, RAD51, KLLN, CHEK2).
In group 1 (FPC), 6 of the 54 families (11.1%) were found to carry a PGV. Mutated genes were MSR1, PALLD, CDKN2A, and GATA5. In group 2 (familial non-FPC), 7 of the 73 families (9.6%) were found to carry a PGV. Genetic changes were found in PALLD, MUTYH, KLLN, RAD51, and CDH1. In group 3 (hereditary PC), genetic variants were found in BRCA1, BRCA2, ATM, STK11, MSH2, CDH1, PMS2, PRSS1, and CHEK2. No correlation was detected between genetic status (PGV carriers vs non-carriers) and findings on pancreatic surveillance imaging in groups 1 and 2.
We explored whether WES enhances the genetic evaluation of HRIs with PC by detecting PGVs in genes that are not included in the multigene cancer panels. WES was performed in 43 individuals from 35 families. PGVs were detected in 11 of the 35 families (31.4%), VUS were detected in 12 families (34.3%), and 12 families (34.3%) had normal exome analysis. Genetic variants were detected in BRCA2, PALLD, and ATM and in other genes including MSR1 and GATA5 that are not included in the multigene cancer panels.
Clinical characteristicsWhen comparing the age of PDAC occurrence in the 3 groups (see Supplementary Figure 1, Supplementary Digital Content 1, https://links.lww.com/CTG/B57), group 3 (hereditary PC group) was found to have earlier PDAC detection compared with the other 2 groups (P = 0.07, overall interquartile range [IQR] 25%–75%, 54–84). The mean and median ages of individuals with PDAC were 69.1 and 67.4 years in group 1 (SE 2.437, IQR 25%–75%, 64–89), 60.3 and 62.3 years in group 2 (SE 1.52, IQR 25%–75%, 54–71), and 59.8 and 53.7 years in group 3 (SE 2.596, IQR 25%–75%, 52–84), respectively. In 2 individuals in the cohort, PDAC was detected at younger than 50 years, 1 in group 2 (not a PGV carrier) and 1 in group 3 (carrier of BRCA2 c.4829_4830delTG PGV). The age of PDAC diagnosis was not affected by sex (P = 0.53, female: mean 64.33, median 61.25, SE 2.09, IQR 25%–75%, 54–84; male: mean 63.98, median 64.86, SE 1.96, IQR 25%–75%, 55–78).
The mean age of pancreatic cyst detection was similar in the 3 groups: 67.8 (SE 1.741), 66.0 (SE 1.652), and 67.7 (SE 3.137) years in groups 1, 2, and 3, respectively (P = 0.965, IQR 25%–75%, 64.97–79.89). Analysis of group 3 showed that in BRCA2 PGV carriers, pancreatic cysts were detected at an earlier age (mean and median age 52.8 and 49.8 years, respectively, SE 2.021, IQR 25%–75%, 48.9–62.8), compared with individuals who were not BRCA2 carriers (mean and median age 60.0 and 60.7 years, respectively, SE 1.212, IQR 25%–75%, 53.6–70.7). These results were statistically significant (P = 0.034) (see Supplementary Figure 2, Supplementary Digital Content 2, https://links.lww.com/CTG/B58).
Table 4 presents pancreatic imaging findings (EUS and MRI + MRCP) during the 6 years of follow-up. Clinically significant imaging findings were detected in 25.9% (62/239) of HRIs: 15 cases of cancer (11 PDAC and 4 pancreatic neuroendocrine tumor [PNET]), 6 main-duct IPMN, and 41 side-branch IPMN (SB-IPMN). The percentage of significant pancreatic findings was similar in all 3 groups (P = 0.859). Seventeen individuals with clinically significant pancreatic findings were referred for surgical resection. These included 11 cases of PDAC, of which 73% were diagnosed at a localized stage (stages I and II), 4 cases of PNET, and 2 cases of main-duct IPMN with dysplastic changes (Table 5). Twelve of the 17 individuals were alive at the end of the study (6 years of follow-up). Five individuals, all with PDAC, died during follow-up. Notably, 4 of these 5 individuals were already symptomatic at their first visit and had advanced disease at the time of diagnosis (stage IIB or III, Table 5).
Table 4. - Pancreatic imaging (EUS and MRI/MRCP findings) Study group Total no. of individuals Side-branch IPMN Main-duct IPMN Chronic pancreatitis like changes Fatty infiltration Cancer Total no. of findings No. of significant findings (IPMN and cancer) PC percentage Group 1: FPC 70 12 4 3 2 5 (3 PDAC, 2 PNET) 26/70 = 37.1% 21/70 = 30% 3/70 = 4.3% Group 2: Familial non-FPC 81 15 1 11 0 5 (5 PDAC) 32/81 = 39.5% 21/81 = 26% 5/81 = 6.2% Group 3: Hereditary PC BRCA1,2 + PDAC (68) 12 1 9 1 5 (3 PDAC, 2 PNET) 28/68 = 41.2% 18/68 = 26.5% 3/68 = 4.4% PJS (3) 1 0 0 0 0 1/3 = 33.3% 1/3 = 33.3% 0 HNPCC + PDAC (3) 1 0 1 0 0 2/3 = 66.6% 1/3 = 33.3% 0 Other PGV (14) 0 0 1 0 0 1/14 = 7% 0/14 = 0% 0EUS, endoscopic ultrasound; FPC, familial pancreatic cancer; HNPCC, hereditary nonpolyposis colon cancer; IPMN, intraductal papillary mucinous neoplasm; MRCP, magnetic resonance cholangiopancreatography; MRI, magnetic resonance imaging; PC, pancreatic cancer; PDAC, pancreatic ductal adenocarcinoma; PGV, pathogenic germline variant; PJS, Peutz-Jeghers syndrome; PNET, pancreatic neuroendocrine tumor.
留言 (0)