
Remember me


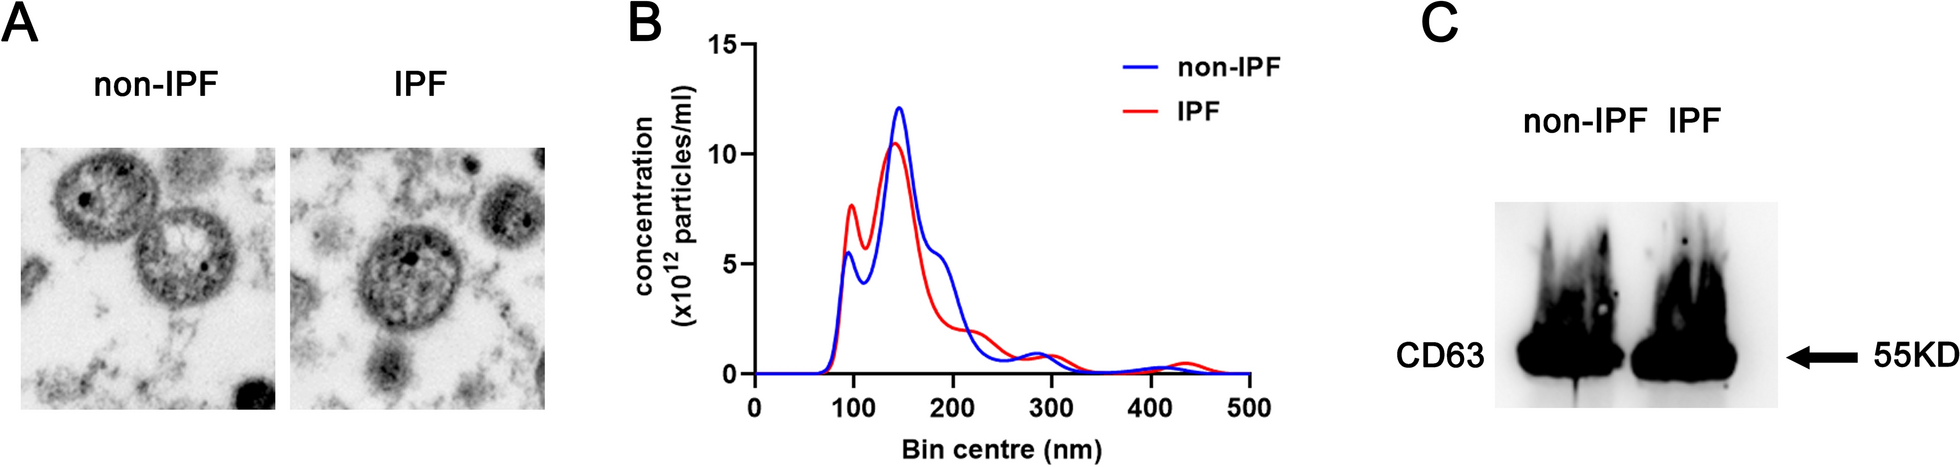
Exosomes were isolated from the plasma of both IPF patients and control volunteers using CD63 Exosome Capture Beads. The isolated vesicles were then identified through TEM, NTA, and western blotting after elution. The TEM and NTA analysis revealed that the isolated vesicles had a spherical morphology with an average size distribution of 100 nm (Fig. 1A). Furthermore, the western blot analysis showed an enrichment of the exosomal marker CD63 (Fig. 1C). These results confirm the successful isolation of exosomes from the plasma. Additionally, there was no significant difference in the number and size of exosomes between IPF patients and control volunteers, as shown in Fig. 1.
Fig. 1
Identification of plasma exosomes. A Structural characteristics of exosomes under TEM. B Exosome diameter was detected by NTA. C Exosome specific protein CD63 was detected by Western blotting. IPF IPF patients, non-IPF control volunteers
Screening the expression of circRNAs in exosomes derived from plasma of IPF patients and control volunteersA high-throughput circRNA microarray was conducted to identify dysregulated exosomal circRNAs in the plasma of three IPF patients and three control volunteers. The expression patterns of exosomal circRNAs in the plasma of IPF patients and control volunteers were found to have a significant difference, as confirmed by the heatmap (Fig. 2A and Additional file 1: Table S2). The volcano plot was used to visualize the differentially expressed exosomal circRNAs between IPF patients and control volunteers. The results indicated 11 dysregulated circRNAs, with six upregulated (marked by red dot) and five downregulated (marked by blue dot) circRNAs, exhibiting a fold change > 2 and p < 0.05 (Fig. 2B and Table 2). To further validate these findings, the six upregulated circRNAs were selected for individual sample analysis using RT-qPCR.
Fig. 2
Exosomal circRNA expression profile in IPF patients and control volunteers. A The heat map of exosomal circRNA expression profile in IPF patients and control volunteers. B The volcano map of exosomal circRNA expression profile in IPF patients and control volunteers. The blue dots represent the descending circular RNA; The red dots represent rising circular RNA. C The six upregulated exosomal circRNAs in 10 IPF patients and 10 control volunteers by RT-qPCR. IPF IPF patients, non-IPF control volunteers. Each test was repeated three times. The mean differences between diagnostic groups were analyzed by Student’s t test. ***P < 0.001
Table 2 Dysregulated exosomal circRNAs derived from plasma of IPF patients and control volunteers with fold change (FC) > 2 and p < 0.05Selecting exosomal circRNAs for qRT-PCR validationTo determine the expression levels of the selected six upregulated circRNAs (hsa_circ_0044226, hsa_circ_0004099, hsa_circ_0008898) with fold change > 2 and p < 0.05, we used circPrimer to design specific and accurate detection primers for circular RNAs across the circular junction sites [16]. We then investigated the specificity of the primer set for circRNAs by serially diluting and assessing synthetic circRNA of the six upregulated circRNAs using qRT-PCR assay to generate a standard curve. We consistently and efficiently amplified the six circRNAs with the specific primers. Moving forward, we analyzed these six circRNAs in the training stage involving 10 IPF patients and 10 control volunteers using qRT-PCR assays. Three of the six circRNAs, namely hsa_circ_0044226, hsa_circ_0004099, and hsa_circ_0008898, were found to be significantly upregulated in the exosomes with fold change > 2 and p < 0.01 (Fig. 2C). Therefore, we selected these three circRNAs for further validation in the validation cohort.
In the validation cohort, we collected samples from 113 IPF patients and 76 control volunteers, including the samples used for the high-throughput circRNA microarray assay and training assay, at the Drum Tower Hospital of Nanjing University (Table 1). Consistent with the results from the training stage, exosomal hsa_circ_0044226, hsa_circ_0004099, and hsa_circ_0008898 were remarkably increased in the plasma of IPF patients compared to control volunteers (Fig. 3A–C). We performed ROC curve analysis to investigate the diagnostic value of these three exosomal circRNAs for IPF. The AUCs of hsa_circ_0044226, hsa_circ_0004099, and hsa_circ_0008898 were 0.936, 0.887, and 0.934, respectively (Fig. 4A and Table 3). Furthermore, we evaluated the performance of the combination of these three circRNAs in distinguishing IPF patients from non-IPF controls through logistic regression and ROC analysis. According to the results of the logistic regression, the risk score (Logit(P)) for the diagnosis based on the three exosomal circRNAs is shown in Fig. 4B and Table 3. The combination of the three circRNAs (hsa_circ_0044226 + hsa_circ_0004099 + hsa_circ_0008898) had the highest AUC value of 0.991, with a discriminative sensitivity and specificity of 98.23 and 93.42, respectively.
Fig. 3
The expression level of exosomal hsa_circ_0044226 (A), hsa_circ_0004099 (B), hsa_circ_0008898 (C) in IPF patients and control volunteers by RT-qPCR. IPF IPF patients, non-IPF control volunteers. Each test was repeated three times. The mean differences between diagnostic groups were analyzed by Student’s t test. ***P < 0.001
Fig. 4
ROC curve analysis for exosomal circRNAs derived from the plasma. A The ROC curve analysis of hsa_circ_0044226, hsa_circ_0004099 and hsa_circ_0008898. B The ROC curve analysis of the combination of hsa_circ_0044226 + hsa_circ_0004099, hsa_circ_0044226 + hsa_circ_0008898, hsa_circ_0004099 + hsa_circ_0008898 and hsa_circ_0044226 + hsa_circ_0004099 + hsa_circ_0008898
Table 3 Receiver operating characteristic (ROC) analysisHsa_circ_0044226 is associated with lung function of IPF patientsThrough the analysis of the relationship between lung function and hsa_circ_0044226, hsa_circ_0004099, and hsa_circ_0008898 in IPF patients, it was observed that the expression level of exosomal hsa_circ_0044226 exhibited an inverse correlation with Forced Expiratory Volume (FEV1) (r = −0.633, P < 0.001) and Forced Vital Capacity (FVC) (r = −0.737, P < 0.001) in IPF patients (Fig. 5A, B). The other two circRNAs (hsa_circ_0004099 and hsa_circ_0008898) don't have a clear correlation with FEV1 and FVC (data not shown).
Fig. 5
The association of lung function with exosomal circRNAs in plasma of IPF patients. A The association of FEV1 with hsa_circ_0044226. B The association of FVC with hsa_circ_0044226
The diagnostic value of hsa_circ_0044226 in progression prediction of IPFAcute exacerbations of IPF (AE-IPF), characterized by the onset of widespread acute lung injury, significantly contribute to the progression and mortality associated with IPF [17, 18]. This can even occur in individuals with limited fibrosis and well-preserved lung function [17, 18]. Timely diagnosis is critical in reducing mortality rates related to acute exacerbations of IPF. Currently, there are no validated non-invasive biomarkers for diagnosing or predicting AE-IPF. The expression levels of exosomal hsa_circ_0044226, hsa_circ_0004099, and hsa_circ_0008898 were assessed in 71 Acute exacerbations of IPF (AE-IPF) patients and 42 stable IPF (S-IPF) patients. The results revealed that exosomal hsa_circ_0044226 was significantly higher in the plasma samples of AE-IPF patients compared to S-IPF patients (Fig. 6A). Moreover, the areas under the curve (AUCs) of hsa_circ_0044226 in distinguishing between AE-IPF and S-IPF were 0.9517 (Fig. 6B), with a discriminative sensitivity of 100 and specificity of 88.89.
Fig. 6
The expression of exosomal cirRNAs in the plasma of S-IPF patients and AE-IPF patients. A The level of exosomal cirRNAs in the plasma of stable IPF patients (S-IPF) and acute exacerbation IPF patients (AE-IPF). B Receiver operating characteristic curve of hsa_circ_0044226. C The level of exosomal cirRNAs in the plasma of IPF patients with smoking (smoking) and non-smoking (non-smoking). Each test was repeated three times. The mean differences between diagnostic groups were analyzed by Student’s t test. ***P < 0.001
Cigarette smoking is one of the most recognized risk factors for development of IPF [2]. The relationship between cigarette smoking and hsa_circ_0044226, hsa_circ_0004099, and hsa_circ_0008898 in IPF patients was also investigated. As the result showed in Fig. 6C, the expression level of exosomal hsa_circ_0044226 was significantly increased in IPF patients with cigarette smoking, while the hsa_circ_0004099 and hsa_circ_0008898 had no difference.
Exosomal mmu_circ_0002687 upregulated in the plasma of bleomycin-induced IPF mice modelThrough sequence alignment, hsa_circ_0044226 was observed to be conserved in both humans and mice, where it is referred to as mmu_circ_0002687 in mice (Additional file 1: Figure S1). Consequently, the expression level of exosomal hsa_circ_0044226 in plasma was investigated in an IPF mice model induced by a single dose of bleomycin. Consistent with previous reports [17, 18], the IPF induced by a single dose of bleomycin initially progressed rapidly and then entered a stable phase after approximately 21 days due to the disappearance of bleomycin-induced effects (Fig. 7A, B). In comparison to control mice without bleomycin treatment (CTL), noticeable inflammatory cell infiltration in the lungs and local fibrotic features such as collagen deposition were evident at day 7 (Fig. 7A). The lung inflammation gradually subsided over time after modeling and was replaced by the gradual accumulation of collagen deposition, leading to the collapse of alveolar structure and the loss of local lung tissue respiratory function (Fig. 7A, B). After 21 days, the IPF mice model entered a stable phase (Fig. 7A, B). Plasma samples were collected at 7, 14, 21, 35, and 49 days, and the expression level of exosomal mmu_circ_0002687 in the plasma was determined using RT-qPCR. The results demonstrated that exosomal mmu_circ_0002687 in the plasma rapidly increased initially and then began to decrease at 21 days, consistent with the trend of pathological changes (Fig. 7C). These findings reaffirm that blood exosomal hsa_circ_0044226 not only holds potential as a biomarker for IPF diagnosis but also indicates the progression of IPF.
Fig. 7
The pathology and expression level of plasma exosomal mmu_circ_0002687 of single does bleomycin-induced IPF mouse model. A–B The pathology of single does bleomycin-induced IPF mouse model. observation time points of bleomycin-induced mouse model at 7, 14, 21,35 and 49 days, CTL/0: mice without bleomycin treatment. A: Represent image (4x); B: statistic value of fibrotic area. C The expression level of plasma exosomal mmu_circ_0002687at 0, 7, 14, 21,35 and 49 days. 0 days means mice without bleomycin treatment (CTL). Five mice were at each time point. Each test was repeated three times. The mean differences were analyzed by Student’s t test. *P < 0.5;**P < 0.01;***P < 0.001
The biological function of hsa_circ_0044226Due to the inverse correlation between the expression level of blood exosomal hsa_circ_0044226 and lung function (Fig. 5), as well as its upregulation in AE-IPF, the function of hsa_circ_0044226 was investigated through in vitro experiments. The human fetal lung fibroblast cell line HFL1 was subjected to TGFβ1 treatment to induce myofibroblasts. Following TGFβ1 treatment, hsa_circ_0044226 exhibited a significant increase, which could be attenuated by hsa_circ_0044226 siRNAs (Fig. 8A). TGFβ1, a crucial cytokine in IPF, was found to induce the expression of collagen (COL1), smooth muscle actin (α-SMA), and fibronectin (FN) in myofibroblasts, leading to their secretion and deposition in the extracellular matrix (Fig. 8B–E). However, the protein levels of α-SMA, FN, and COL1 were downregulated by hsa_circ_0044226 siRNAs in the myofibroblasts (Fig. 8B–E). Furthermore, the impact of hsa_circ_0044226 on myofibroblast proliferation was assessed using a CCK-8 assay. As per previous reports, TGFβ1 was observed to promote myofibroblast proliferation (Fig. 8F), whereas the promotion by TGFβ1 was nullified by hsa_circ_0044226 siRNAs.
Fig. 8
The biological function of hsa_circ_0044226. A The expression level of hsa_circ_0044226 in HFL1 cells treated with TGFβ1, TGFβ1 plus scramble RNA (TGFβ1 + NC) or TGFβ1 plus hsa_circ_0044226 siRNA (TGFβ1 + siRNA). B–E The protein levels of α-SMA, FN and COL1 in HFL1 cells treated with TGFβ1, TGFβ1 plus scramble RNA (TGFβ1 + NC) or TGFβ1 plus hsa_circ_0044226 siRNA (TGFβ1 + siRNA). B Represent image; C–E statistic value of α-SMA, FN and COL1. F the proliferation ability of HFL1 cells treated with TGFβ1, TGFβ1 plus scramble RNA (TGFβ1 + NC) or TGFβ1 plus hsa_circ_0044226 siRNA (TGFβ1 + siRNA). CTL: HFL1 cells treated without TGFβ1. Each test was repeated three times. The mean differences were analyzed by Student’s t test. *P < 0.5;**P < 0.01;***P < 0.001
These findings suggest that hsa_circ_0044226 plays a critical role in the progression of IPF through the TGFβ1 signaling pathway and could potentially serve as a new therapeutic target for IPF treatment. However, further studies are required to validate these findings.
Comments (0)