Ethical statement
This study was pre-approved by the Ethics Committee of the Second Hospital of Tianjin Medical University (No. KY2022K060). All participants were informed of the study and signed the study consent form for the collection and analysis of their urine, serum, and stone samples.
Human urine and serum samples
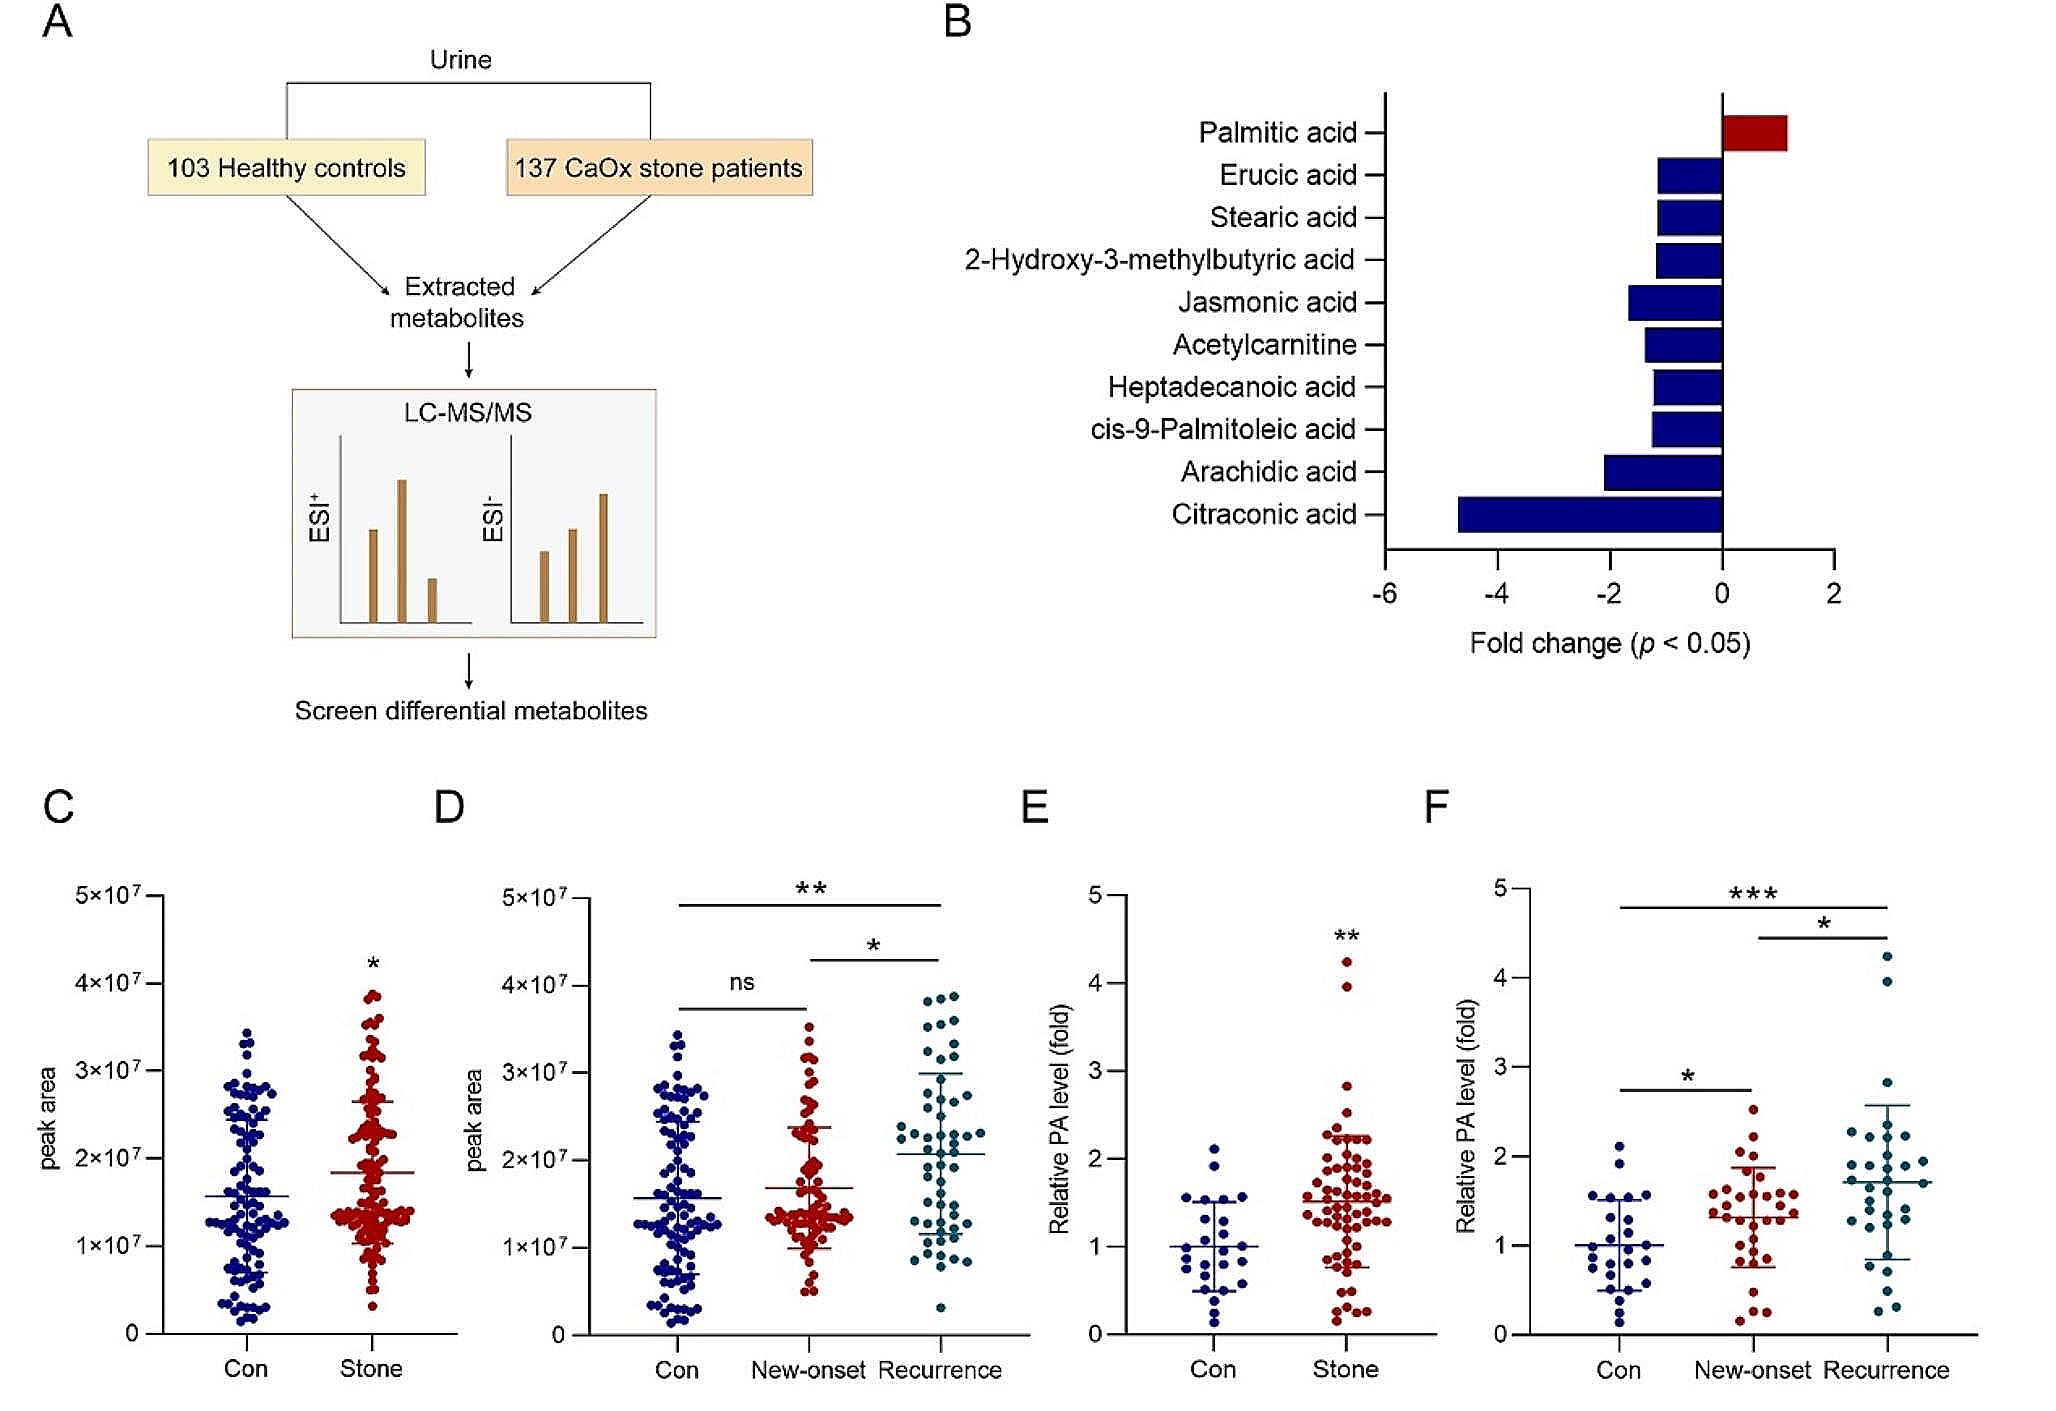
Urine samples were collected from 137 patients with renal CaOx stones and 103 healthy controls. In our previous study, we conducted untargeted metabolomics on these urine samples and presented the discovery of PA as a notably differential metabolite in patients with renal CaOx stones [15]. Among these 137 patients, 82 and 55 patients were new-onset and relapse cases, respectively. The clinical characteristics of these patients and healthy controls are presented in Table S1.
Additionally, in this study, serum samples were obtained from 33 new-onset patients, 32 relapsed patients, and 20 healthy controls to assess whether serum PA level was also higher in patients with renal CaOx stones than in healthy individuals. These serum samples were collected after an overnight fast and stored at -80 ℃. The baseline features of each group are summarized in Table S2. Patients diagnosed with secondary causes of urolithiasis, monogenic-induced nephrolithiasis, renal dysfunction, urinary tract infection, liver disease, parathyroid dysfunction, anemia, cancer, congenital renal or urinary tract anomalies, or pregnancy were excluded from the study.
Animal experiments
Animal experiments were conducted following the approval and protocol of the Second Hospital of Tianjin Medical University and the Declaration of Helsinki. Wild-type male mice, aged 8 weeks and weighing 22–24 g, were obtained from SPF Biotechnology (SCXK 2019-0010), and then randomly assigned to the PA-treated and untreated group. To induce renal injury by using PA, mice were placed on a regular diet containing 7.5% PA (H8780, Solarbio) by weight for 20 weeks. The diet composition was formulated based on our preliminary experiments and previous reports [16,17,18]. The control group was fed a regular diet. After the 20-week period, all the mice were sacrificed, and blood samples (> 0.5 mL each) were collected through cardiac puncture and put into 1.5 ml tubes with heparin. Additionally, their kidneys were harvested.
Via renal histological analysis and continuous monitoring of renal function, the above-mentioned regimen was verified to induce injury to renal tubular epithelial cells of these mice fed with PA. Then, mice in each group were subjected to daily intraperitoneal injections of glyoxylic acid (Gly) (G10601, Sigma, 80 mg/kg dissolved in sterile saline) to establish the model of renal CaOx stones [19, 20].
Within the 20 weeks of feeding with PA, ferrostatin-1 (Fer-1) (HY 100,579, MCE, 2 mg/kg dissolved in 5% DMSO and then diluted in sterile saline), ζ-Stat (HY-123,979, MCE, 1 mg/kg dissolved in sterile saline) and GW6471 (HY-114,263, MCE, 10 mg/kg dissolved in 5% DMSO diluted in sterile saline) were administered daily via intraperitoneal injections starting from the 16th week until the establishment of the renal CaOx stone model. The corresponding control groups received an equivalent volume of sterile saline or DMSO (< 5%).
Cell experiments
HK-2 human renal tubular epithelial cells were purchased from the American Type Culture Collection and maintained in DMEM/F-12 containing 10% fetal bovine serum (Gibco) at 37 ℃ with 5% CO2. To induce cell injury, they were plated in 96-well plates and then treated with PA (P0500, Sigma) (IC50 estimated at approximately 400 µM) for 24 h. Afterward, their viability was assessed using the MTT assay (0.5 mg/ml) (M5655, Sigma) according to the instructions of the manufacturer. For cell experiments, such as the extraction of mRNA or proteins, HK-2 cells were seeded at a density of 2 × 10⁵ cells/well in a 6-well plate.
Immunohistochemistry
Formalin-fixed paraffin-embedded sections of 5 μm thickness were used. After deparaffinization, rehydration, and heat-mediated antigen retrieval by using 10 mM sodium citrate, endogenous peroxidase activity was blocked using 3% hydrogen peroxide. Then the sections were incubated overnight at 4 °C with appropriately diluted primary antibodies, followed by incubation with a horseradish peroxidase (HRP)-conjugated secondary antibody (PV-6000, Zsbio). A DAB kit (ZLI-9018, Zsbio) was used for visualization, following the instructions of the manufacturer. The antibodies used are presented in Table S3.
Immunocytofluorescence
HK-2 cells were seeded into 12-well glass plates at a density of 30,000/well. After they were fixed at room temperature for 30 min by using 4% paraformaldehyde and then permeabilized using 0.1% Triton-100 for 15 min. Afterward, the cells were subjected to immunofluorescence staining. For dual renal immunofluorescence staining for phosphatidyl ethanolamine binding protein 1 (PEBP1) and 15-lipoxygenase (15-LO), kidney sections were subjected to antigen retrieval and then incubated overnight at 4 ℃ with primary antibodies against these proteins, followed by incubation with goat anti-mouse and anti-rabbit secondary antibodies (Table S3).
Hematoxylin and eosin (HE), periodic acid-Schiff (PAS), and Von Kossa staining
Kidney sections were subjected to HE staining to assess the injury to the renal tubular epithelial cells. To observe the structural changes in the epithelium and brush border of renal tubules, a PAS assay kit (G1280, Solarbio) was used according to the instructions of the manufacturer. For quantitative analysis of CaOx crystal deposition, a Von Kossa kit (150,687, Abcam) was used according to the instructions.
Monitoring of serum creatinine (scr) and blood urea nitrogen (BUN) levels of mice
To monitor the changes in the renal function of mice fed with PA, Scr and BUN assay kits (AS0174 and AS0172, SAB) were used according to the instructions of the manufacturers. For these assessments, blood was collected from mice at 5, 10, 15, and 20 weeks.
Enzyme-linked immunosorbent assay (ELISA)
ELISA kits were adopted to measure the levels of PA (69-26485, Mskbio), hyaluronic acid (HA) (69-22935, Mskbio), phosphatidic acid (69-99778, Mskbio), and arachidonic acid (AA) (69-10011, Mskbio) following the instructions.
RNA-sequencing
To examine the effect of PA on gene transcription, three paired and biologically duplicated HK-2 cell samples that were PA-treated or untreated were collected. The total RNA of each sample was extracted with TRIzol (15,596,026, Invitrogen), and then subjected to RNA high-throughput sequencing by Cloud-Seq Biotech. Briefly, RNA libraries were constructed and library sequencing was then performed on an Illumina Novaseq 6000 instrument by using 150 cycles. High-quality clean reads were aligned to the reference genome (UCSC HG19). Subsequently, guided by the Ensembl GTF-gene annotation file, the Cuffdiff software (a component of Cufflinks) was used to derive gene-level FPKM values, representing the mRNA levels. Differential mRNA levels were identified based on fold change (FC ≥ 2) and a significance threshold of p < 0.05. Accordingly, 797 and 469 genes were upregulated and downregulated in PA-treated HK-2 cells, respectively. The dataset was deposited in the Gene Expression Omnibus under accession number GSE240279, as per NCBI guidelines.
Quantitative reverse transcription–polymerase chain reaction (qRT-PCR)
Total RNA was extracted from cells by using the TRIzol reagent (15,596,026, Invitrogen), and then 5 µg of total RNA was reverse-transcribed in a 20 µL volume by using oligo dT primers and the Revertaid First-strand cDNA synthesis kit (K1622, ThermoFisher). The resulting cDNA was then subjected to PCR analysis by using the Applied Biosystems 7900 Real-Time PCR System (ThermoFisher) and the Faststart Universal SYBR green master mix (4,913,914,001, Roche). The relative expression levels of target genes were calculated using the 2-ΔΔCt method. GAPDH was used as an internal control. The sequences of the primers used are shown in Table S4.
Western blotting
HK-2 cells that were PA-treated or untreated were lysed using RIPA buffer (R0010, Solarbio) containing 1% cocktail proteinase inhibitors (78,441, ThermoFisher). Then, samples with equal amounts of protein (30 µg) were resolved using SDS-polyacrylamide gel electrophoresis (A1010, Solarbio) and transferred onto PVDF membranes (IPVH00010, Millipore). After blocking the membranes with 5% bovine serum albumin (BSA) (A8020, Solarbio), they were incubated with primary antibodies at 4 °C overnight. Afterward, the membranes were washed three times with Tris-buffered saline containing 0.05% Tween and then incubated with HRP-conjugated secondary antibodies (1:10,000 dilution) at room temperature for 1 h. Target bands were visualized using an ECL system (5200, Tanon). The expression levels of the target proteins were calculated using Image J based on the gray values of the corresponding bands. All the primary antibodies used are listed in Table S3.
Assessment of cellular ROS, Fe2+, lipid ROS, glutathione (GSH), and 4-hydroxynonenal (4-HNE) levels, and the activity of glutathione peroxidase 4 (GPX4)
Cellular ROS levels were assessed using the 2′,7′-dichlorofluorescin diacetate probe (D6470, Solarbio). Cellular Fe2+ levels were measured using an iron assay kit (ab83366, Abcam) by following the instructions of the manufacturer. In this assay, Fe2+ reacts with an iron probe, forming a stable colored complex with a maximum absorption peak at 593 nm. Cellular glutathione levels were assessed using a GSH/GSSG ratio detection assay kit (ab138881, Abcam). This assay employs a proprietary non-fluorescent dye, which undergoes significant fluorescence upon reacting with GSH, with the absorbance measurements performed at 490/520 nm.
Cellular 4-HNE levels were measured using a lipid-peroxidation (4-HNE) assay kit (ab238538, Abcam). This kit measures the 4-HNE adducts in cell lysates by comparing the absorbance of the samples to a known 4-HNE-BSA standard curve. The GPX4 activity was evaluated using an HT glutathione peroxidase assay kit GPX4 activity (7512-100-K, Trevigen). To evaluate intracellular and membrane lipid ROS accumulation, cells were stained with BODIPY (581/591) c11 (D3861, Invitrogen). All the measurements were performed by following the instructions.
Co-immunoprecipitation
Cells treated as indicated were collected and then lysed using 500 µL cell lysis buffer (88,804, ThermoFisher). Subsequently, 2–10 ug (per 500–1000 ug protein) of mouse anti-PEBP1 primary antibody (101,504, Santa Cruz) was added to the samples, followed by overnight incubation at 4 ℃. Next, 25 µL of pre-washed Protein A/G Magnetic Beads were introduced into the samples, which were then incubated at room temperature for 1 h. Afterward, the magnetic beads were isolated and washed. Then, 100 µL of elution buffer was added to the beads, and the mixture was shaken at room temperature for 10 min. Finally, the supernatants were collected to be analyzed via western blotting.
Transmission electron microscopy
HK-2 cells treated as indicated were fixed at 4 ℃ for 2 h by using 2.5% glutaraldehyde. After the dehydration, permeabilization, embedding, and sectioning, mounting steps, the samples were analyzed by using a transmission electron microscope (SU8100, Hitachi).
Lipidomics analysis
The medium- and long-chain FA (M/LCFA) profiles of PA-treated HK-2 cells were characterized via lipidomics analysis. To this end, 1 mL of a chloroform-methanol solution was added to the cell samples, followed by sonication for 30 min. Subsequently, 2 mL of a 1% sulfuric acid-methanol solution was introduced to the supernatant, which was then heated at 80 ℃ for 30 min. Afterward, 1 mL of n-hexane was added to extract the total lipid content of the sample. Then, 500 µL of the supernatant was combined with 25 µL of methyl n-nineteenth acid, serving as an internal standard. In the gas chromatography–mass spectrometry (GC-MS) analysis, an injection volume of 1 µL and a split ratio of 10:1 were used. The lipids were resolved using an Agilent DB-WAX capillary column (30 m×0.25 mm ID×0.25 μm) in a GC system. The initial temperature was set at 50 ℃ for 3 min, followed by an increase to 220 ℃ for 5 min at a rate of 10 ℃/min. Helium served as the carrier gas at a flow rate of 1 mL/min.
For quality control, each quality-control sample was randomly inserted to assess the stability of the mass-spectrometry separation and the reliability of the results. Mass spectrometry was performed using an Agilent 7890/5975c gas-mass spectrometer, with the sample-port, ion-source, and transmission-line temperatures set at 280, 230, and 250 °C, respectively, and the electron energy set as 70 eV. Peak areas and retention times were extracted using the MSD ChemStation software, and calibration curves were generated to calculate the concentrations of the M/LCFAs in the samples.
Statistical analysis
SPSS 21.0 and GraphPad Prism 8.0 were used for data analysis and graph generation. Comparative analyses between groups were executed using either t-tests or ANOVA. A p-value < 0.05, based on a two-sided test, was considered to indicate statistically significant. All the experiments were independently repeated three times, yielding consistent results.

留言 (0)