
記住我
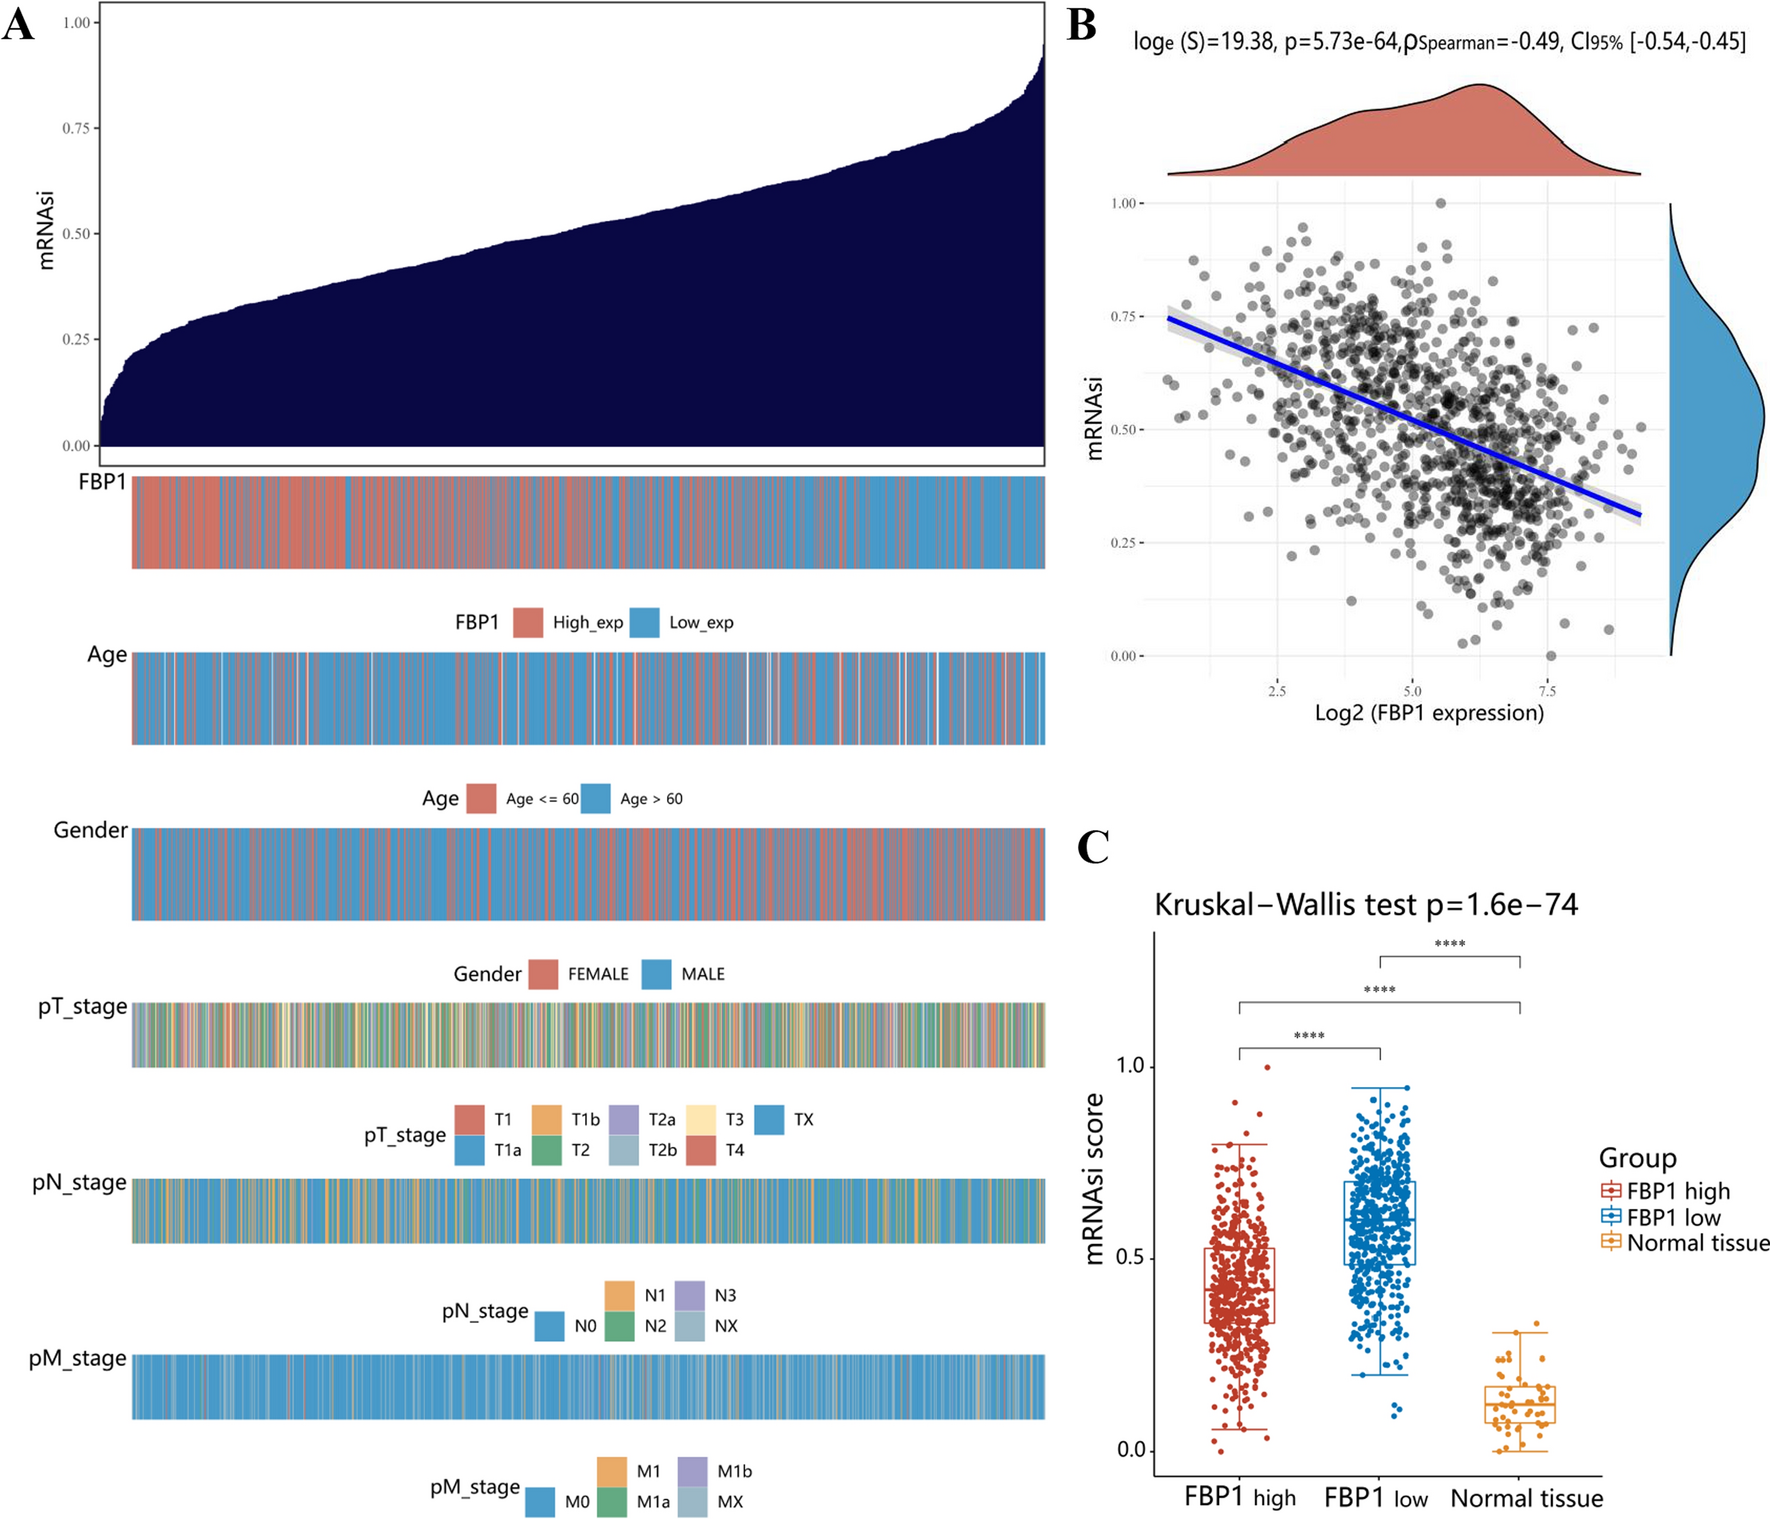
Our previous investigation confirmed the down-regulation of FBP1 in lung adenocarcinoma, where it functioned as a tumor suppressor by inhibiting proliferation and epithelial–mesenchymal transition (EMT) in lung adenocarcinoma cells [31]. Accumulating research findings support a direct association between EMT and the preservation of cancer stem cell (CSC) characteristics [32,33,34,35,36]. To enhance our comprehension of FBP1 in NSCLC, we conducted an investigation into the role of FBP1 in maintaining the phenotype of cancer stem cells. We acquired the RNA-sequencing expression profile and relevant clinical data of 1 017 NSCLC patients (including lung squamous cell carcinoma and lung adenocarcinoma) from the TCGA database. Subsequently, we utilized the OCLR algorithm, developed by Malta et al. [29], to compute the mRNA stemness index (mRNAsi) for each sample (Fig. 1A). Upon comparing the mRNAsi with the expression level of FBP1 and the clinical characteristics of the patients, we discovered that a higher mRNAsi was linked to a lower FBP1 expression, as well as advanced age (> 60 years), female gender, and advanced pTNM stage (Fig. 1).
Fig. 1
The mRNA stemness index model demonstrated a negative correlation between FBP1 and stemness in non-small cell lung cancer (NSCLC). A The distribution map of mRNA stemness index (mRNAsi) score and clinical information. The top figure depicting the distribution of mRNAsi score from low to high, and the bottom figure illustrating the distribution of FBP1 expression level and clinical information characteristics after sorting. B Spearman correlation analysis of mRNAsi score and FBP1 expression. The density curve on the right illustrates the distribution trend of the mRNAsi score, while the upper density curve represents the distribution trend of gene expression. The value displayed on the top indicates the correlation p value, correlation coefficient, and the method used for correlation calculation. C The distribution of mRNAsi scores in FBP1 high expression NSCLC group, FBP1 low expression NSCLC group, and Normal tissue group. ****p < 0.0001. The Wilcox test was used to compare the statistical difference between two groups, while the Kruskal–Wallis test was employed to test the significance difference among the three groups
FBP1 was found to suppress the cancer stem cell phenotype of NSCLCFurther validation was performed in NSCLC cell lines. Initially, the protein levels of FBP1 were compared between NSCLC cell lines (A549, H1299, H838, H1975, PC9, H1650, and H460) and a normal bronchial epithelial cell line (Beas-2B). It was observed that FBP1 was down-regulated in most NSCLC cells, except for PC9, when compared to the normal bronchial epithelial cell (Fig. 2A). To investigate the necessity of FBP1's metabolic enzymatic activity for its ability to inhibit stemness, flag-tagged FBP1 plasmids were constructed with a G260R point mutation, rendering the metabolic enzymatic activity inactive, based on previous research [7]. A549 and H1299 cells were chosen for introducing exogenous FBP1 overexpression, including both wild-type (WT) and G260R mutant variants. The efficacy of FBP1 expression was assessed using Western blot analysis (Fig. 2B). The enzymatic activity of FBP1 G260R mutant variants in H1299 cells was detected to be in the inactive state (Fig. 2C). CD133, a well-established surface marker for lung cancer stem cells [37,38,39], was utilized to determine the proportion of CD133-positive cells in A549 cells through flow cytometry. Intriguingly, the results indicated that the overexpression of either wild-type or G260R mutant FBP1 led to a decrease in the proportion of CD133-positive cells compared to the control group. Furthermore, there was no significant difference observed between the overexpression of FBP1 (G260R) and FBP1 (WT) (Fig. 2D). Following this, we conducted an examination to ascertain the impact of FBP1 overexpression on the in vitro ability of tumor spheres formation. The overexpression of both FBP1 (WT) and FBP1 (G260R) resulted in a hindered sphere formation ability in A549 and H1299 cells, as evidenced by a reduction in the quantity and size of tumor spheres (P < 0.001, Fig. 2E). The resistance to chemotherapy drug is a critical characteristic of cancer stem cells (CSCs) and is the primary cause of their recurrence following chemotherapeutics [40]. To investigate this, we subjected A549 and H1299 cells to varying concentrations of cisplatin and assessed cell viability using the CCK8 assay. The findings of the study indicated that the overexpression of FBP1 (WT) resulted in a significant decrease in the IC50 value of cisplatin treatment. Conversely, there was no significant difference observed between FBP1 (G260R) and the FBP1 (WT) group (Supplemental Fig. 1A). A549 and H1299 cells overexpressed with FBP1 demonstrated a notably elevated proportion of apoptosis and necrotic cells subsequent to a 48-h cisplatin treatment, in comparison to the control cells (Supplemental Fig. 1B). Additionally, an analysis was conducted to investigate the mRNA level correlation between FBP1 and stemness markers (ALDH1A1, Nanog, KLF4, OCT4a, and SOX2) in NSCLC, utilizing the TCGA database. The results revealed a significant negative correlation between FBP1 and most stemness markers (P < 0.05), with the exception of KLF4 (Fig. 2F). Consequently, the impact of FBP1 overexpression on stemness markers at the protein level was further examined. Consistent with the previous findings, both FBP1 (WT) and FBP1 (G260R) were found to inhibit the expression of ALDH1A1, Nanog, OCT4a, and SOX2 (Fig. 2G). The aforementioned findings suggest that the overexpression of FBP1 negatively affects the cancer stem cell characteristics of NSCLC, regardless of the metabolic enzyme activity of FBP1.
Fig. 2
Overexpression of exogenous FBP1 impairs the cancer stem cell phenotype in NSCLC. A549 and H1299 cells were infected with lentivirus carrying vector, FBP1 (wild type, WT), or FBP1 (G260R mutation, G260R) for stable overexpression. A The expression levels of FBP1 in different tumors were examined using TCGA database. B The efficiency of FBP1 overexpression in A549 and H1299 cells was assessed by Western blot analysis. C The FBPase activity of the blank vector, FBP1 wild-type (WT) and FBP1 G260R mutant variants was detected using a FBPase activity assay kit in H1299 cells. D Viable A549 and H1299 cells were stained with CD133 dye, and the proportion of CD133-positive cells was determined using flow cytometry. E Representative images of A549 and H1299 tumor spheres were observed under a microscope at 40X magnification. **P < 0.01. ***P < 0.001. F The relationship between FBP1 and stemness factors at the mRNA level was investigated using the TCGA dataset. G The expression levels of stemness factors in A549 and H1299 cells were determined through Western blot analysis. NS No significant difference. *P < 0.05. **P < 0.01. ***P < 0.001
To further investigate the role of FBP1 in mediating the cancer stem cell phenotype, we generated stable knockdown PC9 cells with reduced FBP1 expression (Fig. 3A). The knockdown of FBP1 resulted in an increased proportion of CD133-positive cells in PC9 (Fig. 3B). Additionally, the knockdown of FBP1 enhanced the capacity for tumor sphere formation, as evidenced by an increased number of spheres (P < 0.001) and larger sphere diameter (P < 0.01, Fig. 3C). Furthermore, the inhibition of FBP1 led to an increased resistance of PC9 cells to cisplatin (P < 0.05, Supplemental Fig. 1C). After a 48-h treatment with cisplatin, the FBP1 knockdown group exhibited a significantly lower proportion of necrotic cells in PC9 cells compared to the control group (Supplemental Fig. 1D). Consistent with previous observations, the knockdown of FBP1 also led to an increase in the protein expression levels of stemness markers (Fig. 3D).
Fig. 3
Knockdown of FBP1 enhanced the cancer stem cell phenotype of NSCLC. PC9 cell was infected with lentivirus carrying vector or shFBP1 for stable overexpression. A The efficiency of FBP1 knockdown in the PC9 cell was assessed using Western blot analysis. B The proportion of CD133-positive cells was determined through flow cytometry. C Microscopic images of PC9 tumor spheres were captured at a magnification of 40X. **P < 0.01. ***P < 0.001. D The expression levels of stemness factors were evaluated in PC9 cell. NS No significant difference. *P < 0.05. **P < 0.01. ***P < 0.001
FBP1 inhibits the activation of NOTCH1 and its downstream pathwaysTo investigate the mechanism through which FBP1 regulates the CSC phenotype in NSCLC, we examined the impact of FBP1 overexpression or knockdown on the Notch1 signaling pathway, which is widely acknowledged to be involved in the regulation of stemness. Western blot analysis of the expression levels of Notch1 intracellular domain (NICD1), its ligand Jagged1, and its downstream target Hes1/Hey1 revealed that the overexpression of FBP1 in A549 and H1299 cells resulted in the down-regulation of markers associated with the Notch1 signaling pathway (Fig. 4A). The results obtained from qPCR analysis demonstrated that the overexpression of FBP1 resulted in a decrease in the mRNA expression levels of jagged1, Hes1, and Hey1. However, there was no significant impact observed on the mRNA expression level of Notch1 (Supplemental Fig. 1E). Moreover, the expression levels of FBP1 and NICD1, along with the downstream markers of the NOTCH pathway, were detected at various time intervals subsequent to the infection of A549 and H1299 cells with FBP1 overexpression lentivirus. The findings revealed a significant increase in FBP1 expression at 48-h post-lentivirus infection compared to 24 h post-infection. Conversely, the protein level of NICD1 at 48-h post-lentivirus infection was notably lower than that at 24 h post-infection, and the expression levels of downstream markers of the NOTCH pathway were also diminished (Supplemental Fig. 1F). In PC9 cells, the depletion of FBP1 resulted in elevated levels of associated proteins (Fig. 4B). Conversely, the overexpression of FBP1 did not induce notable alterations in the expression of pathway markers within the Hedgehog pathway, which is also implicated in the regulation of cancer stem cell phenotype (Supplemental Fig. 1G). Intriguingly, an examination of mRNA expression data from the TCGA database revealed no significant transcriptional correlation between FBP1 and NOTCH1 in NSCLC (Fig. 4C). Furthermore, our findings substantiate a significant correlation between elevated NOTCH1 expression and unfavorable prognosis in NSCLC, as indicated by the Kaplan–Meier survival analysis results (Fig. 4D). Additionally, we conducted a protein-level assessment of NICD1 and Jagged1 in both a normal alveolar epithelial cell line (Beas-2B) and seven NSCLC cell lines (Supplemental Fig. 1H).
Fig. 4
FBP1 inhibits the activation of NOTCH1 and its downstream pathways. A, B A549 and H1299 cells were infected with either vector or FBP1 overexpression lentivirus, while PC9 cells were infected with either vector or shFBP1 lentivirus. The expression levels of NOTCH1 pathway markers were determined using Western blot analysis. C Additionally, the correlation between FBP1 and NOTCH1 expression levels in NSCLC was analyzed using the TCGA database. D Kaplan–Meier analysis was performed to assess overall survival based on the expression level of NOTCH1
The impairment of the NOTCH signaling pathway is a crucial factor in the suppression of the lung cancer stem cell phenotype by FBP1To validate the critical role of NICD1 in FBP1-mediated suppression of the CSC phenotype, A549 and H1299 cells were subjected to overexpression of flag-tagged FBP1 (WT) or flag-tagged FBP1 (WT) with HA-tagged NICD1 (Fig. 5A). The overexpression of flag-tagged FBP1 (WT) resulted in a significant transcriptional inhibition of Notch1 signaling pathway markers (P < 0.05). However, the introduction of HA-tagged NICD1 effectively reversed this trend (Fig. 5B). In a similar manner, the up-regulation of flag-tagged FBP1 (WT) resulted in a down-regulation of stemness transcription factors (Nanog, OCT4a, ALDH1A1 and SOX2) at the mRNA level (P < 0.05). However, this effect was reversed when HA-tagged NICD1 was co-overexpressed (Fig. 5C). This trend was also observed at the protein level (Supplemental Fig. 2A, B). Furthermore, in the sphere formation assay, the number of tumor spheres formed in A549 and H1299 cells with stable overexpression of FBP1 (WT) was significantly lower compared to the control group (P < 0.001). Nevertheless, the number of tumor spheres was restored in A549 and H1299 cells co-overexpressing NICD1 (Fig. 5D).
Fig. 5
NICD1 plays a pivotal role in the inhibition of NSCLC stemness by FBP1. A549 and H1299 cells were transfected with either a vector, flag-FBP1 plasmid, or HA-NICD1 plasmid for a duration of 48 h. Similarly, PC9 cells were transfected with a vector, shFBP1#2 plasmid, or shNotch1 plasmid for the same duration. A, E The transfection efficiency of flag-FBP1 and HA-NICD1 plasmids (A) and knock down efficiency of FBP1 (E) were confirmed through Western blot analysis. B, F qPCR was employed to assess the expression levels of downstream markers of the NOTCH1 pathway in A549, H1299 cells (B), and PC9 cells (F). C, G qPCR was utilized to determine the expression levels of stemness transcriptional factors (C, G). D, H Representative images of A549, H1299 (D), and PC9 (H) tumor spheres were captured under a microscope at 40X magnification. NS: No significant difference. ***P < 0.001. I Tumor incidence and CSCs frequency were calculated using limiting dilution analysis. J The weight of subcutaneous tumors in the three groups of mice injected with 104 H1299 cells was measured on day 36. NS No significant difference. *P < 0.05. K Tumor volume growth curves of three groups of mice injected with 104 H1299 cells. NS No significant difference. *P < 0.05. Blue line: vector vs flag-FBP1; Green line: flag-FBP1 vs flag-FBP1 + HA-NICD1; Red line: vector vs flag-FBP1 + HA-NICD1
To assess the impact of FBP1 and NICD1 on the CSCs frequency, an in vivo limiting dilution analysis was conducted. The results revealed a noteworthy decline (P = 1.80 × 10⁻⁵) in tumor formation when H1299 cells overexpressed FBP1 (WT) in comparison to the control group. However, the co-overexpression of HA-NICD1 significantly augmented (P = 1.84 × 10⁻³) tumorigenicity when compared to the sole overexpression of flag-FBP1 (WT) (Fig. 5I and Supplemental Fig. 2C). In contrast to mice that were subcutaneously injected with 104 cells individually, the overexpression of FBP1 led to a reduction in tumor weight and growth rate, whereas the overexpression of NICD1 promoted tumor weight and growth rate (P < 0.05, Fig. 5J, K).
In contrast, we conducted knockdown experiments on FBP1 or both FBP1 and Notch1 in PC9 cells (Fig. 5E). The knockdown of FBP1 resulted in a significant enhancement of Notch signaling pathway transcriptional activation (Fig. 5F) and an increase in the expression of stemness transcription factors at the mRNA level (Fig. 5G). Conversely, the simultaneous knockdown of Notch1 counteracted the activation of the Notch signaling pathway (Fig. 5F) and reduced the expression of stemness factors (Fig. 5G) at the mRNA level. This trend was also observed at the protein level (Supplemental Fig. 2D, E). The knockdown of FBP1 led to a significant increase in the formation of tumor spheres in PC9 cells, while the simultaneous knockdown of Notch1 reversed this trend (Fig. 5H).
FBP1 facilitates the degradation of NICD1 through the ubiquitin–proteasome pathway, independent of its enzymatic activityAs FBP1 does not exert control over Notch1 expression at the transcriptional level, we investigated whether FBP1 influences post-translational modifications of NICD1. A549 and H1299 cells were transfected with 1 μg of HA-NICD1 plasmid and co-transfected with either 1 μg of flag-FBP1(WT) plasmid or flag-FBP1(G260R) plasmid. Surprisingly, both the wild-type FBP1 and the G260R mutant FBP1 resulted in a reduction of NICD1 expression at the protein level (Fig. 6A). Additionally, A549 and H1299 cells were subjected to transfection with 1 μg HA-NICD1 plasmid and concomitantly transfected with either 0.5 μg or 1 μg flag-FBP1(WT) plasmid. It was observed that the overexpression of flag-FBP1(WT) at higher concentrations led to a further reduction in the protein level of HA-tagged NICD1 (Fig. 6B). Moreover, an investigation was conducted to determine the impact of FBP1 on the degradation of endogenous NICD1. H1299 cells were transfected with either 1 μg Vector or flag-FBP1(WT) plasmid and subsequently treated with 100 mg/ml cyclohexane (CHX) for varying durations. The findings demonstrated that the overexpression of FBP1 significantly shortened the half-life of endogenous NICD1 in H1299 cells (P < 0.05, Fig. 6C). To investigate whether the enhancement of NICD1 degradation induced by FBP1 is mediated through the proteasome pathway, H1299 cells were transfected with 1 μg Vector or flag-FBP1(WT) plasmid and subsequently treated with 100 mg/ml CHX for 8 h or 20 mg/ml proteasome inhibitor MG-132 for 8 h. Notably, the degradation of endogenous NICD1 was significantly accelerated following CHX treatment, whereas the protein level of endogenous NICD1 was significantly higher compared to the control group after MG-132 treatment (Fig. 6D). To confirm the protein–protein interaction between FBP1 and NICD1, a coimmunoprecipitation (CO-IP) assay was performed.
Fig. 6
FBP1 promotes NICD1 degradation via the ubiquitin–proteasome pathway. A A549 and H1299 cells were transfected with 1 μg HA-NICD1 plasmid and co-transfected with either 1 μg flag-FBP1 (wild type, WT) plasmid or flag-FBP1(G260R mutation, G260R) plasmid for a duration of 48 h. The expression level of HA-NICD1 was then assessed using Western blot analysis. B A549 and H1299 cells were transfected with 1 μg HA-NICD1 plasmid and co-transfected with either 0.5 μg or 1 μg flag-FBP1 (WT) plasmid for 48 h, and the expression level of HA-NICD1 was evaluated using Western blot analysis. C H1299 cells were transfected with 1 μg of either Vector or flag-FBP1(WT) plasmid for a duration of 48 h, followed by treatment with 100 mg/ml cyclohexane (CHX) for varying time intervals. The degradation half-life of endogenous NICD1 was assessed using Western blot analysis. *P < 0.05. **P < 0.01. ***P < 0.001. D H1299 cells were transfected with 1 μg of either Vector or flag-FBP1(WT) plasmid for a duration of 48 h, followed by treatment with 100 mg/ml cyclohexane (CHX) for 8 h or 20 mg/ml MG-132 for 8 h. The expression level of endogenous NICD1 was determined using Western blot analysis. E–F Co-immunoprecipitation (Co-IP) assay was conducted to demonstrate the interaction between endogenous FBP1 and NICD in PC9 cells. (G) H1299 cells were transfected with 1 μg of flag-FBP1 and 1 μg of HA-NICD1 plasmids for a duration of 48 h. The Co-IP assay revealed the interaction between exogenous FBP1 and NICD in H1299 cells. H H1299 cells were transfected with 1 μg of HA-NICD1 plasmids and either 1 μg of flag-FBP1(WT) plasmid or flag-FBP1(G260R) plasmid for a duration of 48 h. Subsequently, the Co-IP assay demonstrated the interaction between exogenous FBP1 and NICD1 in H1299 cells. I A549 cells were subjected to staining with fluorescent antibodies targeting FBP1 and NICD1, respectively. The colocalization of FBP1 and NICD1 in cells was observed using a confocal microscope. J, K H1299 (J) and PC9 (K) cells were subjected to transfection with the specified plasmids for a duration of 48 h, followed by treatment with MG-132 for a period of 8 h. The quantification of NICD1's ubiquitination level was conducted through Co-IP assay
The study observed the interaction between endogenous and exogenous FBP1 and NICD1 (Fig. 6E–H). To ascertain where FBP1 and NICD1 interact in the cell, cytosolic and nuclear proteins were isolated and the expression levels of FBP1 and NICD1 were assessed in the cytoplasm and nucleus, respectively. The findings revealed that FBP1 predominantly localized in the cytoplasm, whereas NICD1 exhibited comparable expression levels in both the cytoplasm and nucleus (Supplemental Fig. 2F). Additionally, the localization of FBP1 and NICD1 in PC9 cells was determined using an immunofluorescence assay, confirming their colocalization in both cytoplasm and nucleus (Fig. 6I). H1299 cells were transfected with HA-NICD1, His-Ub, flag-FBP1, or Vector plasmids and treated with MG132. Immunoprecipitation (IP) analysis revealed a significant increase in NICD1 ubiquitination levels when FBP1 was overexpressed compared to the control group (Fig. 6J). Conversely, knockdown of FBP1 resulted in a significant reduction in NICD1 ubiquitination levels compared to the control group (Fig. 6K).
FBXW7 is the prominent E3 ubiquitin ligase recruited by FBP1 to facilitate the degradation of NICD1FBXW7 plays a crucial role as a tumor suppressor and is among the most frequently observed ubiquitin–proteasome system proteins in human cancer [41]. Multiple studies have confirmed its involvement in the degradation of NICD, prompting our investigation into whether FBXW7 is necessary for FBP1-mediated NICD1 degradation [23, 25, 26]. To explore this, H1299 cells were transfected with HA-tagged NICD1, flag-tagged FBP1 (WT) plasmids, or Vector plasmids, and subsequently treated with MG-132. Through CO-IP assay, it was determined that overexpression of flag-FBP1 led to increased binding between NICD1 and FBXW7 (Fig. 7A).
Fig. 7
Identification of the E3 ligase recruited by FBP1 in relation to NICD1. A H1299 cells were transfected with the designated plasmids for 48 h and subsequently treated with MG-132 for 8 h to determine the E3 ligase that interacts with FBP1 and NICD1 via CO-IP assay. B In H1299 cells, transfection with specific plasmids was conducted for a duration of 48 h. Western blot analysis was employed to ascertain alterations in the ubiquitination levels of NICD1 subsequent to the knockdown of FBXW7 using siRNAs. C Changes in the expression levels of NICD1 were determined through Western blot analysis following the knockdown of FBXW7 using siRNAs in H1299 cells transfected with the indicated plasmids for 48 h
Subsequently, FBXW7 was silenced in H1299 cells, and a CO-IP assay confirmed that FBXW7 knockdown led to a decrease in NICD1 ubiquitination when flag was overexpressed (Fig. 7B). Ultimately, it was discovered that the overexpression of flag-tagged FBP1 notably down-regulated the protein level of NICD1, while the simultaneous knockdown of FBXW7 reversed this trend (Fig. 7C). Furthermore, it was observed that the deubiquitinating enzyme USP12 played a role in the regulation of NICD1 ubiquitination. The overexpression of USP12 in H1299 cells significantly mitigated the heightened NICD1 ubiquitination level caused by FBP1 overexpression (Supplemental Fig. 3).
留言 (0)