Animal model and phenotypic characterization
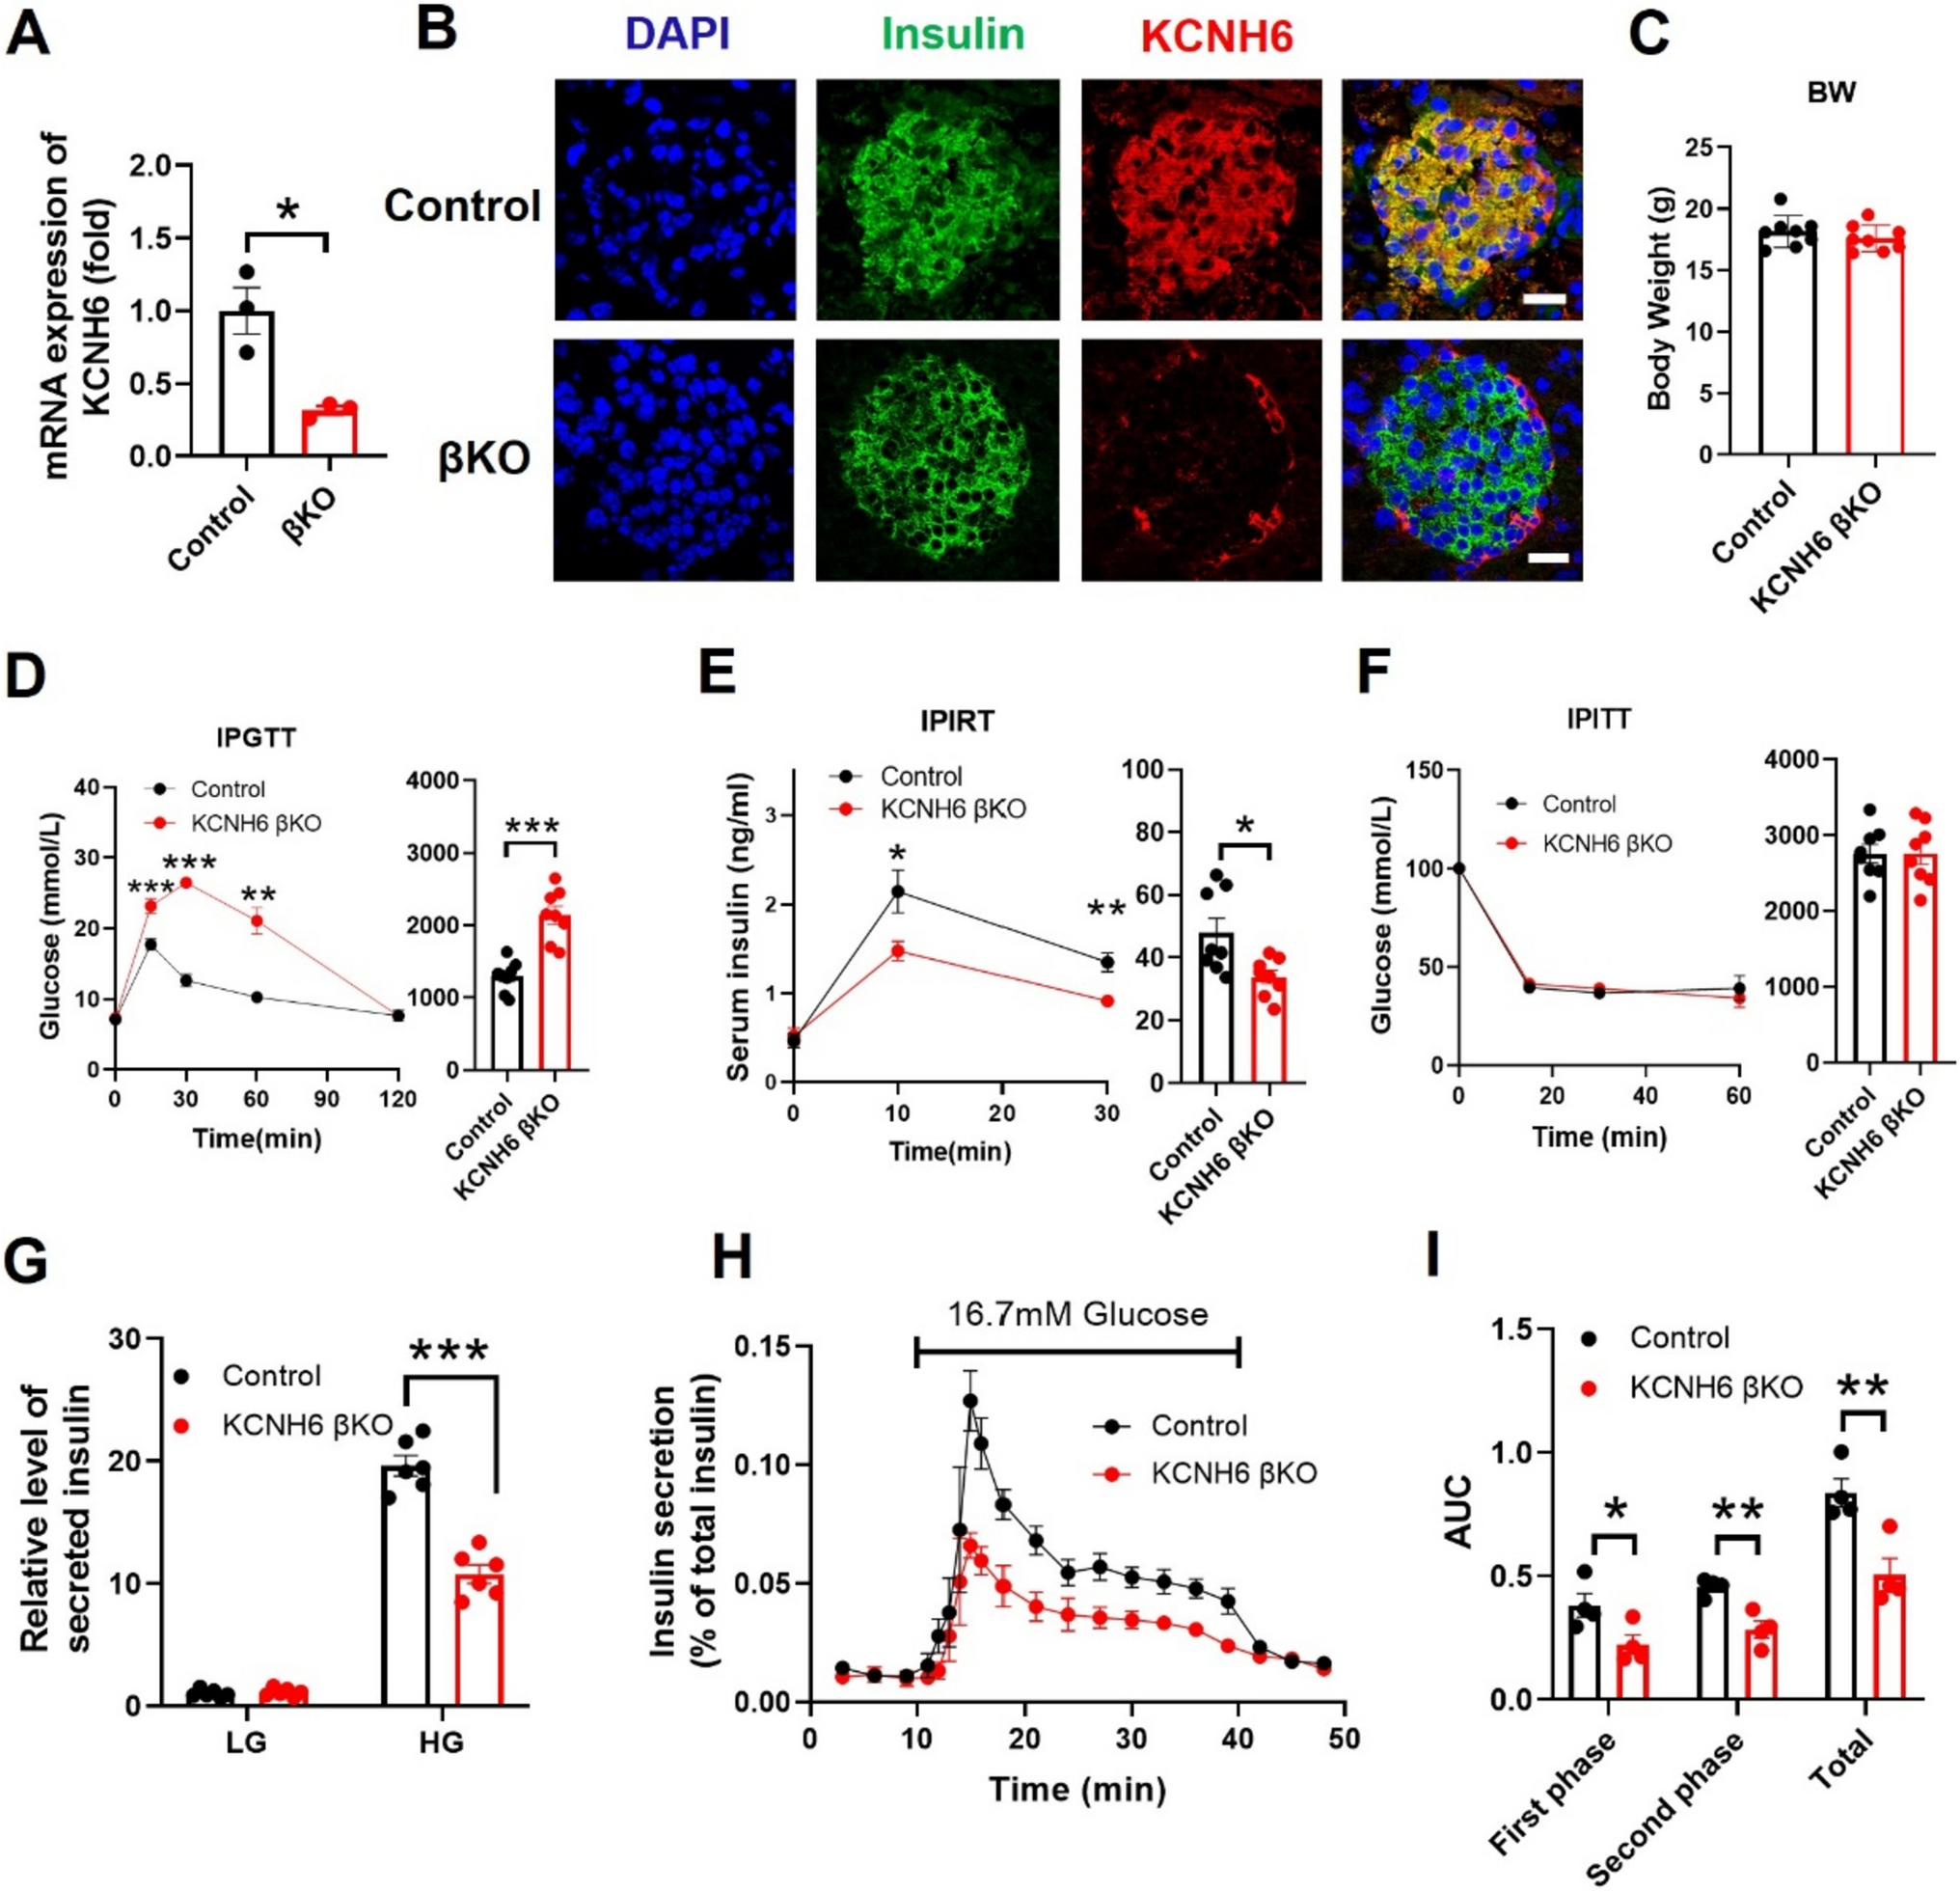
C57BL/6J mice were purchased from Vital River Laboratories (Beijing, China). The KCNH6 β-cell-specific knockout (KCNH6-βKO) mice were generated as described previously [6]. The mice were housed at constant temperature and humidity, with a 12 h light and dark cycle, and fed a regular unrestricted diet. Only male mice and their tissues and cells were phenotypically characterized in this study. Phenotypic analyses of mice were performed as described previously [21]. Animal experiments followed the national ethical guidelines implemented by our Institutional Animal Care and Use Committee and were approved by the Ethical Review Committee of the Institute of Zoology, Capital Medical University, China.
Cell culture and glucose-stimulated insulin secretion assay
MIN6 cells [22] were cultured in high glucose Dulbecco's modified Eagle's medium (DMEM) containing 15% fetal bovine serum, 50 µM 2-mercaptoethanol and 1% penicillin–streptomycin. Human embryonic kidney (HEK) 293A cells (Cell Resource Center, Chinese Academy of Medical Sciences, Beijing, China) were cultured in high glucose DMEM containing 10% FBS and 1% penicillin–streptomycin. Pancreatic islets were isolated from mice through injection of 500 units/mL collagenase solution (type XI; Sigma) into the pancreatic duct, followed by mild shaking digestion at 37 °C for 20 min, and isolated islets were manually selected under a dissecting microscope, as described elsewhere [23]. Isolated islets were cultured overnight in RPMI 1640 medium containing 10% FBS and 1% penicillin–streptomycin. After overnight recovery, islets were treated with 0.05% trypsin in PBS at 37 °C for 4 min, fully dispersed to primary β-cells. All cells were cultured in a humidified incubator with 95% air and 5% CO2 at 37 °C. Glucose-stimulated insulin secretion assay in MIN6 cells and perifused islets was performed as described previously [21]. For experiments with pharmacologic treatments, 5 μM Berberine (Sigma-Aldrich, St. Louis, MO, USA) was used as described previously [6].
Subfractionation
Subcellular fractions of MIN6 cells were performed on ice. Plasma membrane (PM) proteins were isolated using the MinuteTM Plasma Membrane Protein Isolation Kit (SM-005, Invent Biotechnologies, Plymouth, MN, USA). To get granules fraction, cells were scraped in 1 ml homogenization buffer (20 mM HEPES, pH 7.4; 0.5 mM EDTA; 0.5 mM EGTA; 250 mM sucrose and 1 mM dithiothreitol) containing protease inhibitors (Roche). The cells were then disrupted by 10 strokes through a 26 G needle. The cell homogenates were centrifuged 900 ×g for 10 min to remove the nuclei and unbroken cells. Post-nuclear supernatant was centrifugated at 5500 ×g for 15 min and then at 25 000 ×g for 20 min to pellet the granule fraction. The supernatant was further centrifugated at 100,000 ×g for 1 h to obtain the cytosolic fraction (supernatant).
Antibodies and immunoprocedures
In these studies, our novel (noncommercial) polyclonal antibodies against amino acids 20–38 (RKFEGQSRKFLIANAQMEN) of the mouse KCNH6 protein (mKCNH6-Ab) were conjugated with carrier protein KLH for immunization of rabbits. This antibody was customized at PTM Biolabs (Hangzhou, China) and validated by enzyme-linked immunosorbent assay and western blotting. The sources of antibodies and their concentrations used are listed in Supplementary Table 1. All Immunoprocedure experiments were performed as previously described [24]. Islets or cells were lysed in lysis buffer containing 20 mM Tris–HCl pH 7.5, 150 mM NaCl, 1 mM MgCl2, 10 mM EGTA, 1% Triton X-100, 1 mM PMSF and a complete protease inhibitor cocktail (Roche). Protein samples from lysates were separated by SDS-PAGE and then transferred to a polyvinylidene difluoride membrane (Millipore). The membrane was blocked with TBST (TBS plus 0.1% Tween-20) containing 0.5% nonfat dried milk powder and then incubated overnight at 4 °C with the primary antibody followed with incubation of horseradish peroxidase-conjugated secondary antibody (1:2000, Beyotime, China) for 1 h at room temperature, and was washed five times. The immunoreactive bands were detected using enhanced chemiluminescence (Amersham Biosciences, USA) and an LAS-500 chemiluminescence detection system (GE Healthcare Bioscience, USA). Optical density values of immunoreactive bands were obtained using Image J software. For immunoprecipitation, cell lysates were performed at 4 °C by incubation with primary antibody overnight, followed by the addition of Protein G-Sepharose 4F (GE Healthcare Bioscience) for 1 h or by direct incubation with anti-hemagglutinin (HA) affinity matrix beads (Roche Diagnostics) or anti-FLAG affinity gel (Sigma-Aldrich) for 1 h. After being washed five times with wash buffer containing 20 mM Tris–HCl pH 7.5, 150 mM NaCl, 10% Glycerol, 0.1% TritonX-100, the immunoprecipitates were subjected to SDS-PAGE. For immunofluorescence, primary β-cells cultured on poly-L-lysine-coated 35-mm glass base dishes (150680, Thermo, USA) were fixed by 4% paraformaldehyde for 30 min at room temperature and were permeabilized with 0.1% Triton X-100 in PBS for 30 min, then blocked with PBS containing 1% bovine serum albumin (BSA) for 30 min. The coverslips were incubated with primary antibodies overnight at 4 °C, followed by incubation of Alexa Fluor 488- or 568-conjugated secondary antibodies (Invitrogen, USA) for 1 h at room temperature. After being washed five times with PBS, samples were mounted using a mounting solution containing DAPI (for nuclear staining) reagent (Beyotime, Shanghai, China). Confocal imaging was performed using an FV-3000 (Olympus) confocal laser scanning microscope equipped with a 100 × oil immersion objective lens (1.45 NA) and FV31S-SW. The images were adjusted using FV31S-SW and Image J software. Each image is representative of at least three independent experiments.
DNA and RNA manipulation
Mouse KCNH6 and Munc-18-1 cDNAs were derived from MIN6 cells. Point and deletion mutants were generated using a standard PCR-based mutagenesis strategy and were verified by DNA sequencing. The sequences of the primers used are listed in Supplementary Table 2. These cDNAs were subcloned into pcDNA3-HA, pcDNA3-FLAG vector (Invitrogen) or mCherry-C1 vector (Clontech) as described previously [24]. Insulin-EGFP was generated as described previously [25]. To generate recombinant adenoviruses, KCNH6 WT and KCNH6 R246A/T248A/L250A (3A) mutant were inserted into pENTR-3C (Invitrogen) and were transferred into pAd/CMV by LR Clonase recombination (Invitrogen), which co-produces red fluorescent protein (Cherry) to allow identification of transfected cells. To express an exogenous protein, HEK293A cells were transfected with the plasmids using Lipofectamine 3000 reagent (Invitrogen), whereas MIN6 cells were infected with adenoviruses.
RT-qPCR assay
Total RNA was extracted from islets using Trizol reagent (Thermo Fisher Scientific, USA) following the instructions of the manufacturer. Next, the first-strand cDNA was synthesized from an RNA template using SuperScriptIII Reverse Transcriptase (Thermo Fisher Scientific). Subsequently, quantitative PCR reactions were performed using TransStart Tip Green qPCR SuperMix (TransGen Biotech, Beijing, China), cDNA template, and specific PCR primers. Rplp0/36B4 acted as the housekeeping gene to normalize the expression of other genes. The quantitative PCR primer sequences were presented in Supplementary Table 3.
Intracellular calcium level measurement
Primary murine pancreatic β-cells were plated on glass coverslips and left in a humidified incubator for 24 h. Before the imaging experiment, cells were loaded with 2 μM Fluo-4 AM (Dojindo, Japan) in a Krebs–Ringer bicarbonate buffer (KRBB; 120 mM NaCl, 5 mM KCl, 24 mM NaHCO3, 1 mM MgCl2, 2 mM CaCl2, 15 mM HEPES pH 7.4, 0.1% BSA) with 2.8 mM glucose (low glucose) at 37 °C for 30 min, then washed twice using low-glucose KRBB without Fluo4-AM. Afterwards, cells were pre-incubated with low-glucose KRBB for another 30 min and then were stimulated with 16.7 mM high-glucose KRBB. Experiments were performed using a DeltaVision Ultra High Resolution Microscope (GE, USA) with a 60 × objective. Fluo 4-AM was excited at 488 nm and emission was collected at 525 nm. Sequential images of cells were recorded starting from 60 s before stimulation at 5 s internals and analyzed using an Image J software. The ratio of fluorescence change F/F0 was used to reflect changes in intracellular Ca2+ levels, where F is the observed fluorescence density, and F0 is the average value of baseline fluorescence density of the first 30 s before stimulation.
Total internal reflection fluorescence microscopy
Isolated islets were dissociated into single cells by incubation with trypsin–EDTA solution as described previously [24]. The dispersed cells were cultured on poly-L-lysine-coated 35-mm glass base dishes (150680, Thermo, USA) for 2 days. A monolayer of the cells was infected with adenovirus encoding enhanced green fluorescent protein (EGFP)-tagged human preproinsulin and further cultured for 2 days. TIRF microscopy was performed using an inverted microscope Eclipse with a 1.49-numerical aperture objective lens ApoTIRF100 × (Nikon). Images were acquired at 101 ms intervals with an electron multiplying charge-coupled device camera iXon DU-897 (Andor Technology). The cells were preincubated for 30 min in low-glucose KRBB at 37 °C, and after image recording for 30 s, they were exposed to glucose stimulation for 20 min. The stimulation was achieved by the addition of the same volume of twofold concentrated solution, resulting in a final concentration of 25 mM glucose. Fusion events with a flash were manually selected and assigned to one of three types: residents, which are visible at least for 10 s before fusion; visitors, which have become visible during stimulation and remained visible for more than one consecutive frame before fusion; and passengers, which are visible for less than one frame (101 ms) before fusion [24]. The average fluorescence intensity of individual vesicles was calculated as described previously [24].
Transmission electron microscopy
Islets were fixed with 2.5% (vol/vol) glutaraldehyde with Phosphate Buffer (PB) (0.1 M, pH 7.4), washed four times in PB at 4 °C. Then islets were postfixed with 1% (wt/vol) OsO4 and 1.5% (wt/vol) potassium ferricyanide aqueous solution at 4 °C for 2 h, dehydrated through a graded ethanol series (30, 50, 70, 80, 90, 100%, 100%, 5 min) into pure acetone (2 × 5 min). Samples were infiltrated in a graded mixture (3:1, 1:1, 1:3) of acetone and SPI-PON812 resin (21 ml SPI-PON812, 13 ml DDSA and 11 ml NMA), then changed to pure resin. Finally, samples were embedded in pure resin with 1.5% BDMA and polymerized for 12 h at 45 °C, 48 h at 60 °C. The ultrathin Sections (70 nm thick) were sectioned with a microtome (Leica EM UC6), double-stained by uranyl acetate and lead citrate, and examined by a transmission electron microscope (FEI Tecnai Spirit120kV). The number of mature and immature secretory granules, cell size and the distance from the plasma membrane to secretory granules were manually counted and quantified using FIJI (ImageJ) software [26]. A distance < 200 nm from the center of the granule to the plasma membrane was considered to be a docked granule.
Patch-clamp experiments
Whole-cell patch-clamp experiments were performed as previously described [5]. Data were collected using PatchMaster v2 × 80 software. For recording KCNH6 channel currents, transfected HEK293 cells were elicited by 3 s depolarizing pulses ranging from − 60 to + 60 mV and the tail currents by 2 s repolarizing pulses to − 40 mV. The bath solution solution contains (in mM) NaCl 137, KCl 4, CaCl2 2, MgCl2 1, Glucose 10, HEPES 10 and was adjusted to pH 7.3 with NaOH. The pipettes solution contains (in mM) KCl 130, MgATP 5, MgCl2 1, EGTA 5, HEPES 10 and was adjusted to pH 7.3 with KOH.
Molecular docking
We used the HDOCK server (http://hdock.phys.hust.edu.cn/) to carry out protein–protein molecular docking. HDOCK is a powerful pipeline for integrated protein–protein docking, which is based on a hybrid docking algorithm of template-based modeling and ab initio-free docking to optimize the adjustment of ligand [27, 28]. HDOCK performed rigid-body docking using an FFTW-based hierarchical approach by mapping the receptor and ligand molecules onto grids and incorporated experimental information on protein–protein binding sites and small-angle X-ray scattering during the docking and post-docking processes and simplicity of use. In this study, the 3D structures of KCNH6 (B1AR82_MOUSE) and Munc18-1 (STXB1_MOUSE) were downloaded from the AlphaFold Protein Structure Database (https://alphafold.com/) [29]. We used KCNH6 as a receptor and Munc18-1 as a ligand, and submitted to the HODCK server with default parameters. The output model with the highest score was selected and visualized using the program PyMol (https://pymol.org/2/).
Statistical analysis
All statistical analyses were conducted with the software GraphPad Prism version 8.0 Data are presented as means ± SEM. Statistical significance was determined using the Student t test and one-way ANOVA with a Tukey’s test. A p value of < 0.05 was considered significant.

留言 (0)