
記住我
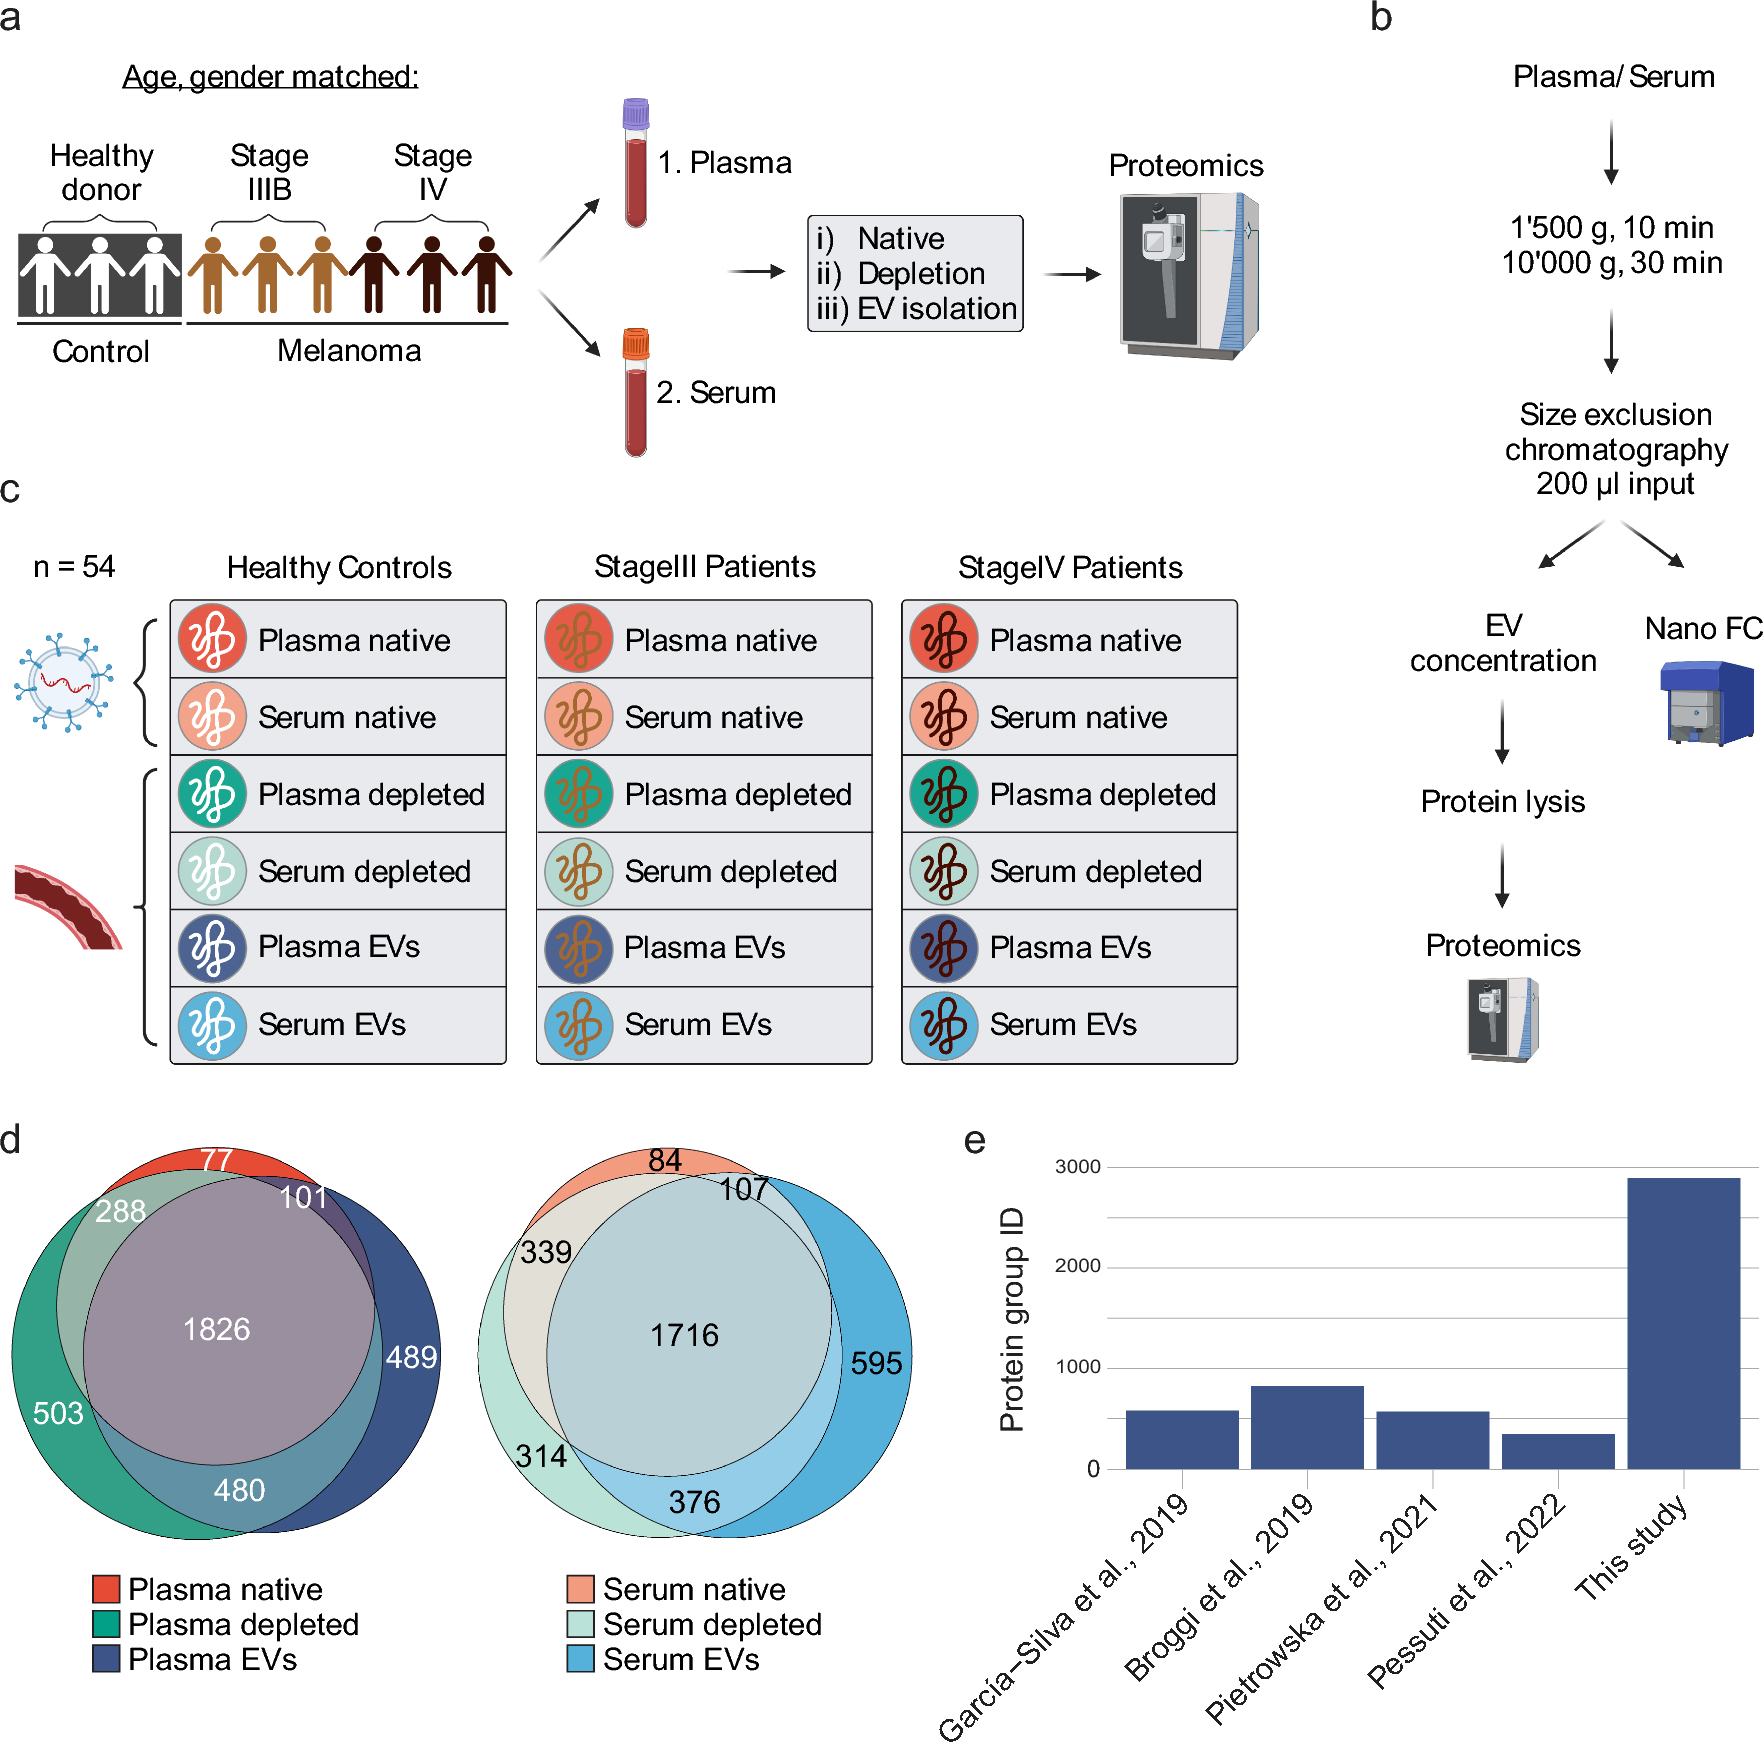
Liquid blood biopsies provide non-invasive means to discover biomarkers for melanoma diagnosis, treatment decisions, monitoring, and prediction of overall survival by providing insights into the disease state of patients. Nevertheless, the high dynamic range of protein abundance in blood and blood-derived EV preparations impede biomarker discovery. To overcome this challenge, we developed SEC–DIA-MS, an integrated workflow combining size-exclusion chromatography, EV concentration, and DIA-mass spectrometry that enables deep profiling of the proteome content of enriched EVs. To assess whether our method has the potential to leverage melanoma biomarker discovery, we analyzed matching plasma and serum samples from a cohort of gender- and age-matched healthy donor (n = 3), stage III (n = 3), and stage IV (n = 3) melanoma patients (Fig. 1a). Briefly, we profiled the proteome of nine plasma and nine corresponding serum samples: (i) without processing (native), ii) with high-abundance blood protein depletion, and iii) with EV enrichment. EVs were isolated by size-exclusion chromatography (SEC) from 200 µL of plasma or serum input, respectively. EV-containing fractions were concentrated on affinity beads before protein lysis and mass spectrometry acquisition (Fig. 1b). Our integrative approach yielded a comprehensive protein atlas of native, depleted, and EV blood (plasma and serum) compartments of healthy control, stage III, and stage IV melanoma patients (Fig. 1c). Overall, more proteins were shared than unique and protein overlap was similar across the three preparations for both plasma and serum (Fig. 1d). For example, 1826 (48.5%) and 1716 (48.6%) of identified proteins were shared across all compartments in plasma and serum samples, respectively. Percentages of unique proteins in a compartment ranged from 2.0 ± 0.4% in native to 13.0 ± 2.8% in EV samples up to 13.4 ± 4.5% in depleted blood. In total, we detected 2896 protein groups in plasma-derived EVs. This is 3.5–8.4 × higher than protein groups identified in the previous studies that performed proteomic profiling of plasma-derived EVs in melanoma patients (Fig. 1e) [36,37,38,39]. Taken together, our approach allowed for significantly improved protein detection and thus paves the way for biomarker discovery from (EV-enriched) blood biopsies. Moreover, the minimal amount of required input allows for the preservation of precious patient material.
Fig. 1
Study workflow and overall protein identification. a Study outline. Plasma and serum samples were collected from a cohort composed of age- and gender-matched healthy donors (n = 3), stage III (n = 3), and stage IV (n = 3) melanoma patients yielding 18 samples in total. For all 18 samples, three different blood compartments (native, depleted, and EVs) of plasma and serum were analyzed by mass spectrometry yielding 54 samples in total. b EV isolation workflow from 200 µL of plasma or serum by size exclusion chromatography and subsequent quality control by nano-flow cytometry (Nano FC). c Generation of a protein atlas for different blood compartments. Protein groups were determined in three different blood compartments (native, depleted, and EVs) of plasma and serum, respectively. For each plasma and serum compartment proteins from healthy donor, stage III and stage IV melanoma patients were quantified. d Venn diagram of total protein group identifications of blood compartments across all analyzed patients. Note that the protein group identifications of native, depleted, and EV compartment show similar overlaps in plasma and serum samples. e Number of protein groups identified in plasma-derived EVs in previous melanoma studies and our study
Plasma- and serum-derived EVs isolated by SEC are consistent with size, morphology, and protein composition of exosomesTo characterize EV populations, we measured the particle concentration and size of all 18 EV preparations by nano-flow cytometry (Fig. 2a, b, Supplementary Fig. S2). The particle size distributions ranged from approximately 50 nm to 260 nm in plasma and from 50 to 270 nm in serum samples, consistent with the presence of exosomes (Fig. 2a, Supplementary Fig. S2a). The mean size of plasma- and serum-derived particles was on average 86.8 nm and 85.9 nm, respectively, revealing no significant particle-size difference between these sample types (Fig. 2b, top, Supplementary Fig. S2a). Similarly, particle concentrations of plasma- and serum-derived EVs were comparable, yielding an average of 9.53E + 08 or 1.18E + 09 particles from 200 µL of plasma or serum input, respectively (Fig. 2b, bottom). The particle number correlated well with the number of protein identifications in plasma samples (Supplementary Fig. S2b). To assess contamination with free proteins in the EV preparations, we measured absorption at 280 nm across different fractions of the SEC. Absorptions of fractions (1–6), which correspond to the void volume, and the subsequent EV-containing fractions (7–10) showed efficient exclusion of free proteins in plasma and serum samples (Supplementary Fig. S2c). Transmission electron microscopy showed intact vesicles within the expected size range (Fig. 2c). To confirm the presence of exosomes at the protein level, we performed a combined GO term analysis of all blood EV samples, which showed a significant enrichment of GO terms associated with vesicles (p-adjusted = 1.54E − 57) and extracellular exosomes (p-adjusted = 3.41E − 55) (Fig. 2d). In addition, comparison to the top 100 proteins of the Exocarta database [49] showed a 92% overlap. Next, we determined the abundance of classical exosome markers in plasma- and serum-derived EVs in comparison to native and depleted plasma and serum samples. Assessed proteins, including tetraspanins CD151, CD63, CD81, CD9, ESCRT protein TSG101, ESCRT-associated protein Alix (encoded by the PDCD6IP gene), Flotillin (FLOT1), and exosome marker syntenin-1 (SDCBP), were enriched in EVs compared to native and depleted samples (Fig. 2e, f, Supplementary Fig. 3a). It is noteworthy that CD81 was exclusively detected in plasma samples and not in any other sample type. This observation suggests that CD81 may either be less abundant than other EV markers in these sample types or more difficult to detect by mass spectrometry (Fig. 2f, Supplementary Fig. 3b, c). In contrast, nuclear markers (e.g., ASH2L, PAF49, CENPA, and CHOP), apoptotic protein BCL2, ER marker ATP2A2, and Golgi markers COG2, GOLGA2 were absent in all EV populations (Supplementary Fig. S4a) and other organelle markers were mostly reduced or unchanged compared to depleted plasma and serum (Supplementary Fig. S4b). In summary, plasma and serum EVs isolated with SEC were consistent with size, morphology, and protein composition of exosomes.
Fig. 2
Characterization of EVs isolated from plasma and serum of healthy donors and melanoma patients. a Size profile of a representative plasma- and serum-derived EV sample isolated by size-exclusion chromatography and acquired by nano-flow cytometry. b Mean particle size (top) and particle number (bottom) of EVs isolated from 200 µL of plasma and serum, respectively. Statistical significance was determined with a two-tailed t test for independent samples, ns stands for not significant using a p-value significance cutoff of 0.05. c High-resolution transmission electron microscopy of plasma and serum EVs. White arrows depict EVs and red arrowheads potential lipoproteins/protein aggregates. The scale bar is 20 µm. d GO terms in the enrichment analysis of proteins identified in plasma and serum EVs against all identified proteins. e Average protein intensity plotted vs protein rank of eight exosome markers (red dots). f Quantification of exosomal markers including tetraspanins CD151, CD63, CD81, CD9, scaffolding protein flotillin FLOT1, luminal vesicle proteins Alix (PDCD6IP) and TSG101, and putative universal exosome marker Syntenin-1 (SDCBP) in plasma- and serum-derived EVs. Black lines represent the median and the upper and lower limit of the box depicts the 25 and the 75 percentile, respectively
Quality control of SEC–DIA-MS and high-abundant blood protein depletionReproducibility of the SEC–DIA-MS workflow was done on three technical replicates of a pooled sample comprising all biological replicates of the respective compartment (native, depleted, and EVs). Particle concentration, size, and protein contamination of the EV-containing fractions (fractions 7–10) were consistent among the replicates (Supplementary Fig. S5a–d), showing reproducible EV separation. As observed for individual samples, particle size and number did not differ significantly between plasma- and serum-derived EVs (Supplementary Fig. S5b–d). Overall, the same proteins were identified (Supplementary Fig. S5f) and the coefficient of variation across the entire workflow was low and comparable between plasma and serum samples with median values of 14.4.%/23.8% in native plasma/serum, to 18.9%/19.5% in depleted plasma/serum, and to 37.7%/38.9% in plasma/serum EVs (Supplementary Fig. S5e, g). Expectedly, native samples showed the least depth in protein, peptide, and precursor identifications, indicating that proteomic profiling of depleted blood and SEC–DIA-MS are superior (Supplementary Fig. S5g). Thus, combined with the good reproducibility, those approaches are preferred over profiling native blood. Next, we assessed the efficiency of the high-abundance blood protein depletion. In our workflow, plasma and serum depletion was achieved using antibodies against high-abundance proteins A2M, ALB, APOA1, APOA2, C3, FGA, HP, IGHA1, IGHM, ORM1, SERPINA1, TF, and TTR. The depletion score [46] of depleted samples was on average approximately 1.5 and three times higher compared to EVs and native samples, and except for A2M, APOA2, IGHM, and FGA, all targeted proteins were largely diminished in depleted blood. Specifically, the abundance of albumin (log2fc = 8.1 for native vs. depleted) and ORM1 were strongly reduced (log2FC = 8.7 native vs. depleted) confirming that high abundant proteins are efficiently removed from plasma and serum (Supplementary Fig. S6a,b). Notably, blood-derived EVs showed a higher depletion score than native blood samples and a pronounced reduction of several high abundant proteins with APOA2, FGA, and IGHM as exceptions (Supplementary Fig. S6a, b). Platelet protein, erythrocyte-associated proteins and coagulation proteins were diminished in EVs compared to depleted blood, although not down to the level of native samples (Supplementary Fig. S6c–h). In addition, melanosome proteins were abundant in EV samples (Supplementary Fig. S6i). Notably, the melanosome protein Rab38 was exclusively present in melanoma EVs while absent in healthy donor EVs (Supplementary Fig. S8b). Overall, the workflow resulted in high-quality proteomic profiling of either the free circulating or EV-embedded plasma/serum proteome.
Plasma and serum EV proteomes diverge from the corresponding unenriched sources and display larger changes between healthy donors and melanoma patientsIn line with the reproducibility analysis, we observed a 1.4-fold reduction in protein group identifications in native compared to depleted blood biopsies in all individual samples (Fig. 3a). In addition, there was a trend towards fewer protein identifications in EVs derived from healthy donor plasma and serum biopsies in comparison to melanoma patient biopsies (Fig. 3a). In all three blood compartments, there was a high overlap of protein identifications across samples, whereas EV-derived samples showed larger differences across samples compared to native and depleted blood samples (Fig. 3b, Supplementary Fig. S7a, b), likely due to biological variability among human subjects. The diversity of protein quantities across different blood compartments was evaluated with principal component analysis (PCA). The first principal component (PC1) and the second (PC2) separated EV-derived, depleted, and native blood compartments in three discrete clusters for both sample types: plasma, and serum (Fig. 3c, d). PC1 accounted for 34.1% and 40.4% and PC2 for 24.5% and 25.3% of the variability in plasma and serum samples, respectively. This implied the enrichment of distinct protein populations in EV-derived, depleted, and native blood compartments. Consistently, hierarchical clustering of plasma (Fig. 3e) recapitulated the dissimilar nature of EV-derived, depleted, and native plasma proteomes, whereas gender and age had no confounding effect. Similarly, native samples formed a distinct cluster in the heatmap of serum samples, but general differences between EV and depleted serum were less pronounced (Fig. 3f). Despite the modest patient number (n = 9), healthy controls separated from melanoma patients in the EV-derived plasma proteome (Fig. 3e) and formed a separate cluster. However, no clear distinctions were revealed between stage III and stage IV melanoma patients, likely due to the small cohort size. Based on the uniqueness of the EV proteome and the clear separation of plasma EVs from healthy donors and melanoma patients, we further evaluated the ability of EV protein profiles to identify potential melanoma biomarkers. For this purpose, we first compared protein identifications between healthy controls and melanoma patients in the six different compartments (Fig. 3g). In both native and depleted plasma and serum, only a few proteins were unique to the disease status (222 and 547 in native and 92 and 253 in depleted plasma and serum, respectively). In contrast, as we expect melanoma cells to secrete more diverse EVs than healthy individuals, EV samples showed the largest percentages of proteins specifically present in melanoma patients: 2107 proteins (73.0%) and 1213 proteins (43.6%) were exclusively detectable in melanoma plasma- and serum-derived EVs, respectively. Analogously, differential abundance analysis revealed up to 348 (plasma, serum: 257) proteins upregulated in melanoma EVs, whereas native and depleted blood showed fewer upregulated proteins in melanoma patients (38 in depleted plasma, 59 in depleted serum, 30 in native plasma, and 48 in native serum) (Supplementary Fig. S8a). The single upregulated protein in native serum overlapped with all the other native and depleted blood samples and is C-reactive protein (CRP), which is a well-established, yet unspecific, melanoma biomarker [50]. Moreover, the high number of upregulated proteins in plasma- and serum-derived EVs of melanoma patients highlighted the benefit of using EVs as complementary melanoma biomarkers. Among the upregulated candidates in plasma-derived EVs were melanoma markers [51], such as MCAM, TNC, and TGFBI, which were not regulated in depleted plasma samples (Supplementary Fig. S8b). To conclude, the proteome of plasma and serum-derived EVs were unique and revealed the potential to detect more differences between healthy controls and melanoma patients. Thus, upscaling SEC–DIA-MS to a larger melanoma cohort will facilitate biomarker discovery in melanoma.
Fig. 3
Protein depletion and EV isolation improve protein identifications compared to untreated (native) plasma or serum. a Protein groups identified in plasma and serum blood compartments across healthy control, stage III and stage IV patients. b UpSet plot showing the number of shared proteins among all analyzed EV-derived plasma and serum samples, respectively. The horizontal bars (blue) show the number of proteins identified in each individual sample, while the vertical bars (black) represent the number of overlapping proteins per subsets, which are visualized by the dotted lines. c, d Principal component analysis based on complete protein group identifications shared across all analyzed plasma (c) and serum (d) samples, respectively. The first two dimensions separate data points into native, depleted, and EV-derived clusters with PC1 explaining 34.1% and 40.4% of the variances for plasma and 24.5% and 25.3% for serum samples. 115 proteins were used for plasma samples and 299 proteins for serum samples. The corresponding ellipses represent sample concentration for native (red), depleted (green) and EV-derived (blue) samples around the mean. Note that among EV-derived samples, specimens from healthy control patients cluster apart. e, f Hierarchical clustering of Z-scored protein quantities for shared proteins of plasma (e, n = 115) and serum (f, n = 299) samples. Native blood samples are overlayed in red, depleted blood samples in green and EV-derived blood samples in blue. Above, samples from healthy controls are overlayed in white and samples from melanoma patients are overlayed in brown. On top, gender categorizations are overlayed, annotating samples derived from female patients in pink and samples derived from male patients in olive. g Venn diagram displaying the overlap of healthy control and melanoma protein identifications among native (left), depleted (middle), and EV-derived (right) plasma (top) and serum (bottom) biopsies
Plasma vs serum comparisons in native, depleted, and EV-derived blood compartments reveal specific enrichment of cellular components in depleted plasma and serumTo assess how differences in the blood collection method affect biomarker discovery, we compared the proteins in plasma vs serum for each of the blood compartments (native, depleted, and EVs). Generally, we observed a high overlap of proteins in all compartments ranging from 69.8% in native samples, to 68.4% and 71.2% in depleted and EV samples, respectively (Supplementary Fig. S9a). We also observe the expected reduction in concentration of clotting factors such as for example fibrinogen A (log2FC native: 8.43; depleted: 7.39; EVs: 6.86) or coagulation factor XIII A (log2FC native: 2.14, depleted: 2.51, EVs: N/A). To analyze the differences in more detail, we performed GO enrichment analysis. In both native and depleted plasma, as well as in plasma-derived EVs, the presence of proteins associated with Gene Ontology (GO) terms related to nuclear compartments was enriched. This observation implied that variations stemming from blood collection procedures can manifest similarly across various sample types (Supplementary Fig. S9b, c). Conversely, there was no significant enrichment observed in native and depleted serum samples, arguing against large global changes between the two blood collections in these sample types. In the case of serum-derived EVs, the enriched Gene Ontology (GO) terms were linked to endosomal and endoplasmic reticulum (ER) membranes (Supplementary Fig. S9d). We conclude that dissimilarities between plasma and serum were most pronounced in depleted blood.
Membrane proteins are differentially enriched in plasma and serum EVsTo study the different protein pools in native, depleted, and EV blood compartments in more detail, we examined which types of proteins are uniquely detected in these three compartments (Fig. 1d). In native blood samples, enrichment analysis yielded no significant enrichment (padj < 0.05) for the GO category “cellular component”. In depleted blood samples, mainly proteins related to nuclear compartments were enriched in the protein pool unique for this compartment (Fig. 4a). Proteins unique in EVs were significantly enriched for GO terms of cellular components associated with vesicles and membrane proteins (Fig. 4b), potentially pointing to an advantage of using EVs to isolate membrane associated biomarkers, especially those coming from the diseased tissue. Taking advantage of the peptide resolution that mass spectrometry provides, we took a closer look at the topological origin of the peptides that we quantified in depleted plasma and plasma-derived EVs (Fig. 4c). While, in depleted plasma, we primarily detected peptides mapping to the extracellular region of the membrane proteins (75.1% of membrane proteins), the EV samples contained a significant portion of peptides mapping to the intracellular domain or both intracellular and extracellular domain (mixed) domains of membrane proteins (51.1%). The reduction of intracellular peptides detected in depleted plasma was attributed to two factors: the identification of fewer proteins with exclusively intracellular peptides and the detection of a reduced number of intracellular peptides within proteins possessing both cytoplasmic and intracellular (mixed) domains (Fig. 4c). Taken together, identification of a large portion of peptides from intra- and extracellular domains (24.9%) in EV membrane proteins demonstrates that we were able to capture intact membrane proteins bound to EVs (Table 1). For example, Basigin (CD147/BSG) peptides detected in the depleted blood compartment mapped exclusively to the extracellular domain (Fig. 4d, Table 1), suggesting that cleaved Basigin is present in the blood. In contrast, comparable percentages of Basigin-specific peptides mapped to cytoplasmic (21.4%) and extracellular (78.6%) domains in plasma-derived EVs. Similarly, detected peptides of integrin beta1 (ITB1), the transferrin receptor (TFR1) and ADAM10 mapped to both, cytoplasmic and extracellular domains in plasma-derived EVs suggesting the presence of intact transmembrane proteins (Supplementary Fig. S10a–c, Table 1). Thus, parallel deep proteomic profiling of depleted plasma and plasma-derived EVs allowed us to address differences in soluble vs membrane bound proteins. Together with the observation that different protein types were enriched in depleted blood compared to EVs, this suggests that profiling both compartments will likely be complementary for melanoma biomarker discovery.
Fig. 4
Membrane proteins are enriched in plasma and serum EVs. a, b GO terms of enrichment analysis of proteins identified in depleted (a) and EV-derived (b) blood biopsies. c Quantitation of membrane protein coverage in plasma and EV-derived plasma samples. Membrane proteins were identified peptides mapped exclusively to the intracellular or exclusively to the extracellular domains of the proteins are labelled in blue and green, respectively. Membrane proteins were both intracellular as well as extracellular peptides were identified are indicated in orange. d Protein structures of membrane protein Basigin (CD147/BSG) in depleted (top) and EV-derived (bottom) plasma biopsies are shown. The left panel shows the alpha-fold2 protein structure with associated model confidence. Very high confidence is indicated in dark blue (per-residue confidence score, pLDDT > 90), high confidence in light blue (90 > pLDDT > 70), low confidence in yellow (70 > pLDDT > 50), and very low confidence in red (pLDDT < 50). The middle panel shows the peptides that were identified by mass spectrometry as red lines on the size scale and as colouring on the 3D map. The right panel shows the corresponding UniProt topological domains of the protein. The yellow box highlights the cytosolic peptides seen exclusively in the EV samples
Table 1 Peptides detected by mass spectrometry in EV and depleted plasma compartmentsPlasma and serum-derived EV proteins are functionally distinct compared to non-vesicular plasma and serum proteinsGiven the observed difference in protein type and structure between EVs and plasma, we next assessed whether EV proteins whether EV-associated proteins exhibited distinct functional characteristics compared to non-vesicular proteins. EVs play a crucial role in cell communication in part mediated by transfer of RNAs including mRNAs, miRNAs, and long non-coding RNAs (lncRNAs) to recipient cells [15, 52, 53]. To transport of these RNAs to EVs, the RNAs form complexes with RNA binding proteins (RBPs). We therefore investigated whether the proteins exclusively found in EVs belong to the category of potential RBPs. Remarkably, a substantial portion of these unique EV proteins, specifically 209 out of 489, have been characterized as potential RBPs (source: https://r-deep.dkfz.de/). Furthermore, we quantified the abundance of RBPs that have been reported to be associated with EVs in the literature [54]. In our analysis, we identified 14 of the 23 reported EV-associated RNA-binding proteins in plasma-derived EVs and 13 in serum-derived EVs (Fig. 5a, b). Among these identified RBPs ANXA2, Alix (PDCD6IP) and YBX1 were specifically enriched in EV samples compared to unenriched plasma or serum (Fig. 5a, Supplementary Fig. S11a, b), consistent with their role in miRNA loading [55,56,57]. Given the involvement of YBX1 in (oncogenic) translation and its reported role in tRNA sorting into EVs [58,59,60,61], we further explored the presence of amino-acyl tRNA synthetases, which are the enzymes responsible for loading amino acids onto tRNAs [62, 63]. We observed a slight enrichment of aminoacyl-tRNA synthetases (ARS) in EVs when compared to native samples, although no such enrichment was observed in comparison to depleted samples [62, 63] (Supplementary Fig. S12a). While mitochondrial ARS were missing, we detected most of the exclusively cytosolic ARS in EVs (Supplementary Fig. S12b). Significantly, 13 of the 18 ARS identified in EVs were exclusive to melanoma patients, while the remaining 5 ARS showed increased abundance in melanoma patient-derived EVs compared to healthy controls. This contrasted with depleted plasma, where 83.3% of ARS were common to both healthy controls and melanoma patients. This observation hinted at a potential role of EV-mediated ARS sequestration in melanoma.
Fig. 5
Plasma- and serum-derived EV proteins are functionally distinct compared to non-vesicular plasma and serum proteins. a Average protein intensity plotted vs ranked protein abundance with proteins highlighted belonging to RNA-binding proteins previously identified in EVs. b Quantification of detected proteins in A across native plasma (dark red), native serum (light red), depleted plasma (dark green), depleted serum (light green), plasma-derived EVs (dark blue), and serum-derived EVs (light blue). Black lines represent the median and the upper and lower limit of the box depict the 25 and the 75 percentile, respectively. c KEGG pathway enrichment analysis of proteins uniquely presents in EVs against all identified proteins. Note that several pathways related to T-cell biology are significantly enriched in EVs compared to depleted and native blood. d PPI network created using the string database (https://string-db.org/) and the enriched proteins found exclusively in EVs. Colored segments label proteins enriched for the indicated KEGG/Reactome terms: dark yellow segments correspond to the term “PDL1 expression and PD-1 checkpoint pathway in cancer”, light yellow segments to the terms “Th1 and Th2 cell differentiation”, and beige segments to the term “Th17 cell differentiation”
To further explore functional aspects of EV proteins, we conducted a pathway enrichment analysis focused on proteins exclusively identified in EVs. Our analysis revealed several enriched pathways including vesicle-related pathways such as “SNARE interactions in vesicular transport” and “Synaptic vesicle cycle”. Moreover, we found enrichment of pathways closely tied to T-cell biology within this unique EV proteome, notably including "PDL1 expression and PD-1 checkpoint pathway in cancer," "Th17 cell differentiation," and "Th1 and Th2 cell differentiation" (Fig. 5c). Visualisation of these enriched KEGG terms in a protein interaction network revealed EV-specific proteins associated with the T-cell receptor (e.g., CD3D, CD3G, and CD247), and proteins linked to the immunological synapse (e.g., LCK and LAT), as EV-specific. Taken together, analysis of the plasma and serum EV proteome revealed structurally, and functionally distinct proteins compared to unenriched plasma/serum proteomes and an enrichment of proteins related to T-cell signalling, again showing potential for the combined profiling of both compartments.
留言 (0)