
Remember me


The medication part of Prescription Cost Analysis (PCA) showed in 2022 a total of 1.12 billion prescriptions at net ingredient costs of £8.83 billion were issued within Primary Care in England and these have increased 5.0% in number and 7.5% in costs in the 5 years since 2017. These three psychotropic sections had 112 million prescriptions issued (10.1% of total medication).
Table 1 shows the top 25 BNF classes by number of prescriptions and anti-depressants have increased by 26% to become the most prescribed class in 2022.
Table 1 Top 25 BNF sections by number of ItemsFigure 1 shows the rolling monthly trend for major physical health and mental health classes the number reflects the BNF class and the 100% = figure represents the monthly average prescription over the initial 12-month period, i.e., approximates to the number of patients being treated. The coloured sections reflect the periods when social restrictions were enforced during the COVID-19 pandemic—this included access to Primary Care for face-to-face appointments.
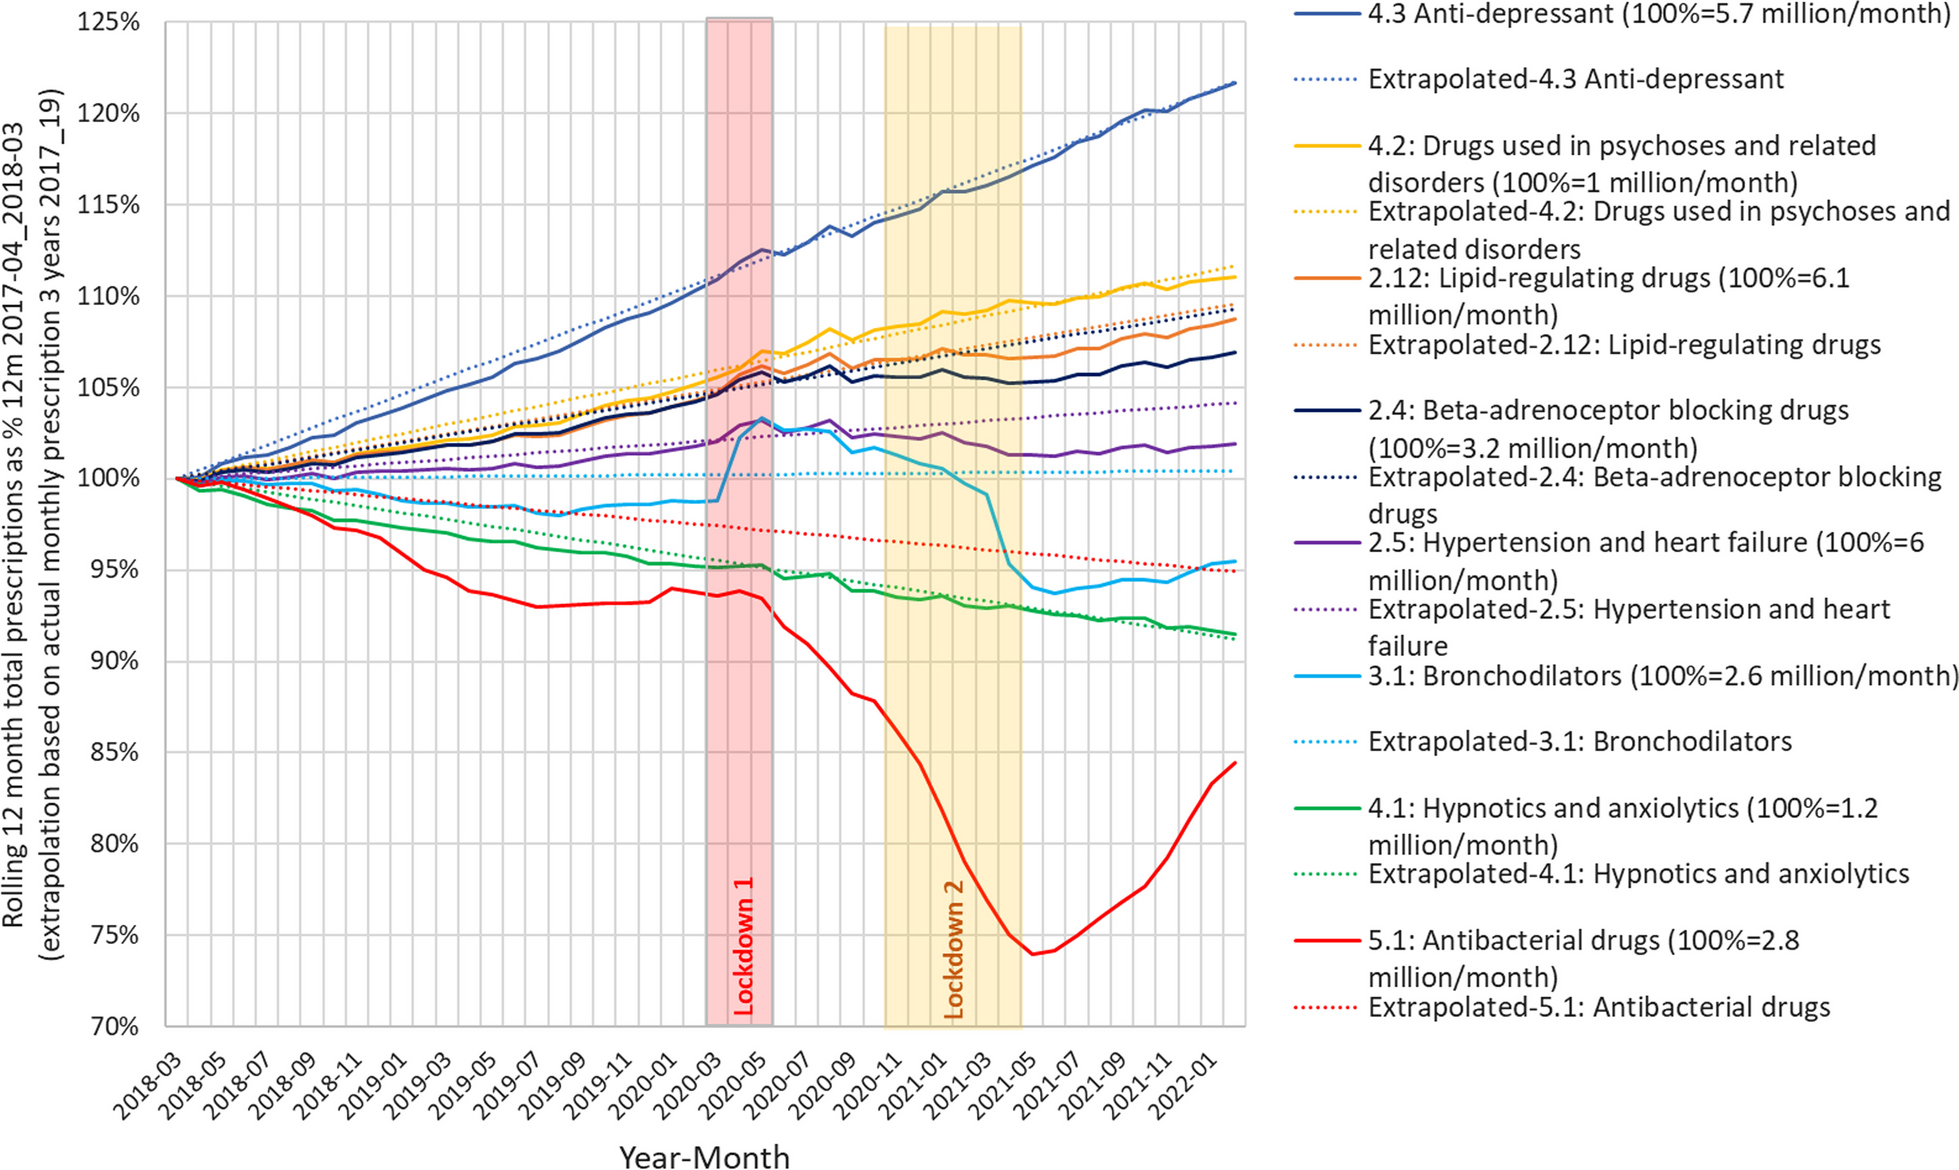
Fig. 1
Relative development in Primary Care prescribing mental and physical health medication before and over the pandemic. Shows a rolling previous 12 month total prescriptions by medication class for each month, against the linear extrapolation based on the previous 3 years 2017 to 2019. Results are standardised to the values for the year April 2017_March 18. The time intervals of the main England lockdowns are shown
The following prescribing trends for BNF classes are based on the assumption that for long-term conditions patients are receiving one prescription per month;
Antidepressants started with around 5.7 million people on therapy and decreased slightly over the main pandemic period. Drugs for psychoses started with 1 million people on therapy, increased slightly during the social restrictions but have fallen back onto the trend. Hypnotics and Anxiolytics started with 1.2 million on therapy (decreasing EAG), grew slightly during lockdowns and have now returned to the trend. Lipid-regulating drugs started with 6.1 million on therapy, increased slightly over lockdown but have fallen back. Beta blockers started with 3.2 million on therapy increased during the first lockdown and have since then stopped growing. ACEI and ARBs (Hypertension and Heart Failure) with 6 million on therapy increased over the lockdowns and have since then declined. Bronchodilators started with 2.6 million on therapy, increased sharply over the 1st lockdown and then fell sharply in the 2nd lockdown. Antibiotics started with 2.8 million on therapy (falling EAG) due to the ongoing national antibiotic stewardship program to reduce unnecessary prescribing, fell sharply during the pandemic but are now recovering.
Table 2 compares the actual mental and physical health prescribing to the extrapolation of historical trends to show what might have been expected if there had been no pandemic and the difference to the actual average over the 24-month pandemic main period as a % of the expected prescribing.
Table 2 Actual average prescriptions/month over the pandemic 2020 and 2021 were compared to the expected based on extrapolation of 2017 to 2019 giving an expected annual growth (EAG) for each classCompared to declines in physical health prescribing, mental health prescribing of hypnotics/anxiolytics increased by 0.2% above the trend in 2020 and 2021. There was a slight fall in antidepressant prescribing (− 0.2%) in the same period. Antipsychotic prescribing overall kept on-trend.
Physical health medications had lower monthly prescriptions during the pandemic most markedly for antibiotics − 12.5% (EAG − 1.3%). Bronchodilator prescribing showed a marked increase in the early pandemic period from March 2020 of 5% (EAG 0.1%).
The 6 main antidepressant medications which together take up 88% of total anti-depressant prescriptions were investigated and results are shown in Fig. 2.
Fig. 2
Relative development of prescription for the top six antidepressant agents over the pandemic period. Results are standardised to the values for the year June 2017_May 18. The time intervals of the main England lockdowns are shown
The following trends for individual antidepressants are based on the assumption that patients are receiving one prescription per month;
SSRI-Sertraline was used by 1.1 million individuals and was the fastest-growing pre-pandemic. The growth rate reduced during the lockdown and has not recovered to expected levels. Mirtazapine was used by 700,000 people and growth fell during the lockdown but has now recovered back to expected levels. Venlafaxine was used by 350,000 people and the growth rate was reduced during the lockdown and has not recovered to expected levels. Tricyclic Amitriptyline was used by 1.1 million individuals and growth was reduced in lockdown but has now recovered higher than could be expected. SSRI Fluoxetine was used by 550,000 million people and growth was reduced slightly in lockdown but has now recovered higher than could be expected. SSRI Citalopram was used by 1.2 million individuals and was declining before the pandemic fell slightly during lockdown but has now recovered back to higher than could be expected.
Thus for all the main antidepressants prescribed in England (Sertraline, Mirtazapine, Venlafaxine, Fluoxetine and Citalopram), prescribing actually decreased in the main pandemic period vs historical trend.
Net absolute changes for the three main antidepressants over the period analysed were: Sertraline grew by 21% so its share of total anti-depressants increased from 22.7% to 24.6% (+ 8%); Mirtazapine grew by 16% so share increased from 13.0% to 13.6% (+ 5%); Venlafaxine grew by 11% so share stayed at 6.3% (0%).
Comments (0)