
記住我


We estimated the cost effectiveness of DBT + s2D compared with DM alone in women aged 40–69 years with scattered areas of fibroglandular breast density and heterogeneous dense breasts (BI-RADS B and C) in Brazil. Although a health economic analysis plan was not previously published, the main aspects of the analysis were summarized according to the Consolidated Health Economic Evaluation Reporting Standards (CHEERS) statement to increase the transparency of the proposed study [7].
2.2 Study PopulationThe target population were females aged 40–69 years eligible for breast cancer screening according to Brazilian supplementary health system guideline [27] who met the following criteria: having scattered areas of fibroglandular breast density and heterogeneous dense breasts (BI-RADS B and C), undergoing biennial breast screening, and receiving DBT + s2D in the intervention arm versus DM in the control arm.
2.3 Study PerspectiveFrom the Brazilian supplementary health system perspective, the economic model estimated the relative cost effectiveness of the DBT + s2D compared with DM alone, adhering to the Brazilian Ministry of Health’s guidelines [28]. Therefore, only healthcare costs (direct medical costs) incurred by the provider were included.
2.4 Intervention and ComparatorDBT is an advanced form of mammography that produces 3D images of the breast taken from different angles using a low-dose x-ray system. A reconstruction algorithm then processes the series of projections to estimate the 3D appearance of the breast, which can be viewed in successive slices [29]. DBT has the potential to partly overcome tissue superposition, thus improving the detection of breast lesions and minimizing the masking effects of DM [30]. The s2D images are created from raw DBT data, which reduces the concern related to increased radiation dose from combined DBT and DM screening [31].
DM is a technique that produces a 2D image and has been used to detect breast cancer in an early stage. However, some lesions can be obscured by the superposition of dense tissue and lead to either false positive or false negative results [30].
Patients were assigned to either the intervention group (DBT + s2D) or the comparator group (DM alone). In both groups, asymptomatic women aged 40–69 years were screened biennially for breast cancer adhering to Brazilian supplementary health system guidelines [27, 32, 33]. Cost effectiveness was expressed as the incremental cost-effectiveness ratio (ICER). We used the Monte Carlo simulation to calculate 95% confidence intervals (CIs) for our estimate of the difference in mean cost and quality-adjusted life years (QALYs) between intervention groups. The life years gained (LYG) were adjusted for utility values according to data identified through a manual search in the literature. The utility values were selected according to the description of the population evaluated and the respective health status of the model, i.e., women who underwent screening for breast cancer and women diagnosed with breast cancer undergoing treatment. All the data used for utility values were based on instruments to assess health-related quality of life based on social preferences (EQ-5D). When specific data of the Brazilian population were not available, data available from other countries were used. For the utility values regarding screening metrics comparing DBT + s2D versus DM, data trials from Germany, Norway, Italy, and USA were used [31, 34,35,36,37,38,39]. For the utility values regarding annual probabilities of death for interval cancer and ductal cancer in situ (DCIS), data from The Norwegian Cancer Registry were used [34]. For the probabilities of progression to data from Canadian simulation were used [40]. For the first cycle of the model, it was considered that the disutility would be lower for patients who received false positive imaging (DM/DBT + s2D) results. False negative imaging screening is defined as cancer discovered between the routine screening intervals. For the other cycles, utility values were considered for interval cancer and for detected cancer [41, 42].
2.5 Time HorizonThe economic evaluation estimated the cost and LYG over a lifetime horizon (30 years), encompassing years of screening eligibility and mortality from breast cancer and other causes.
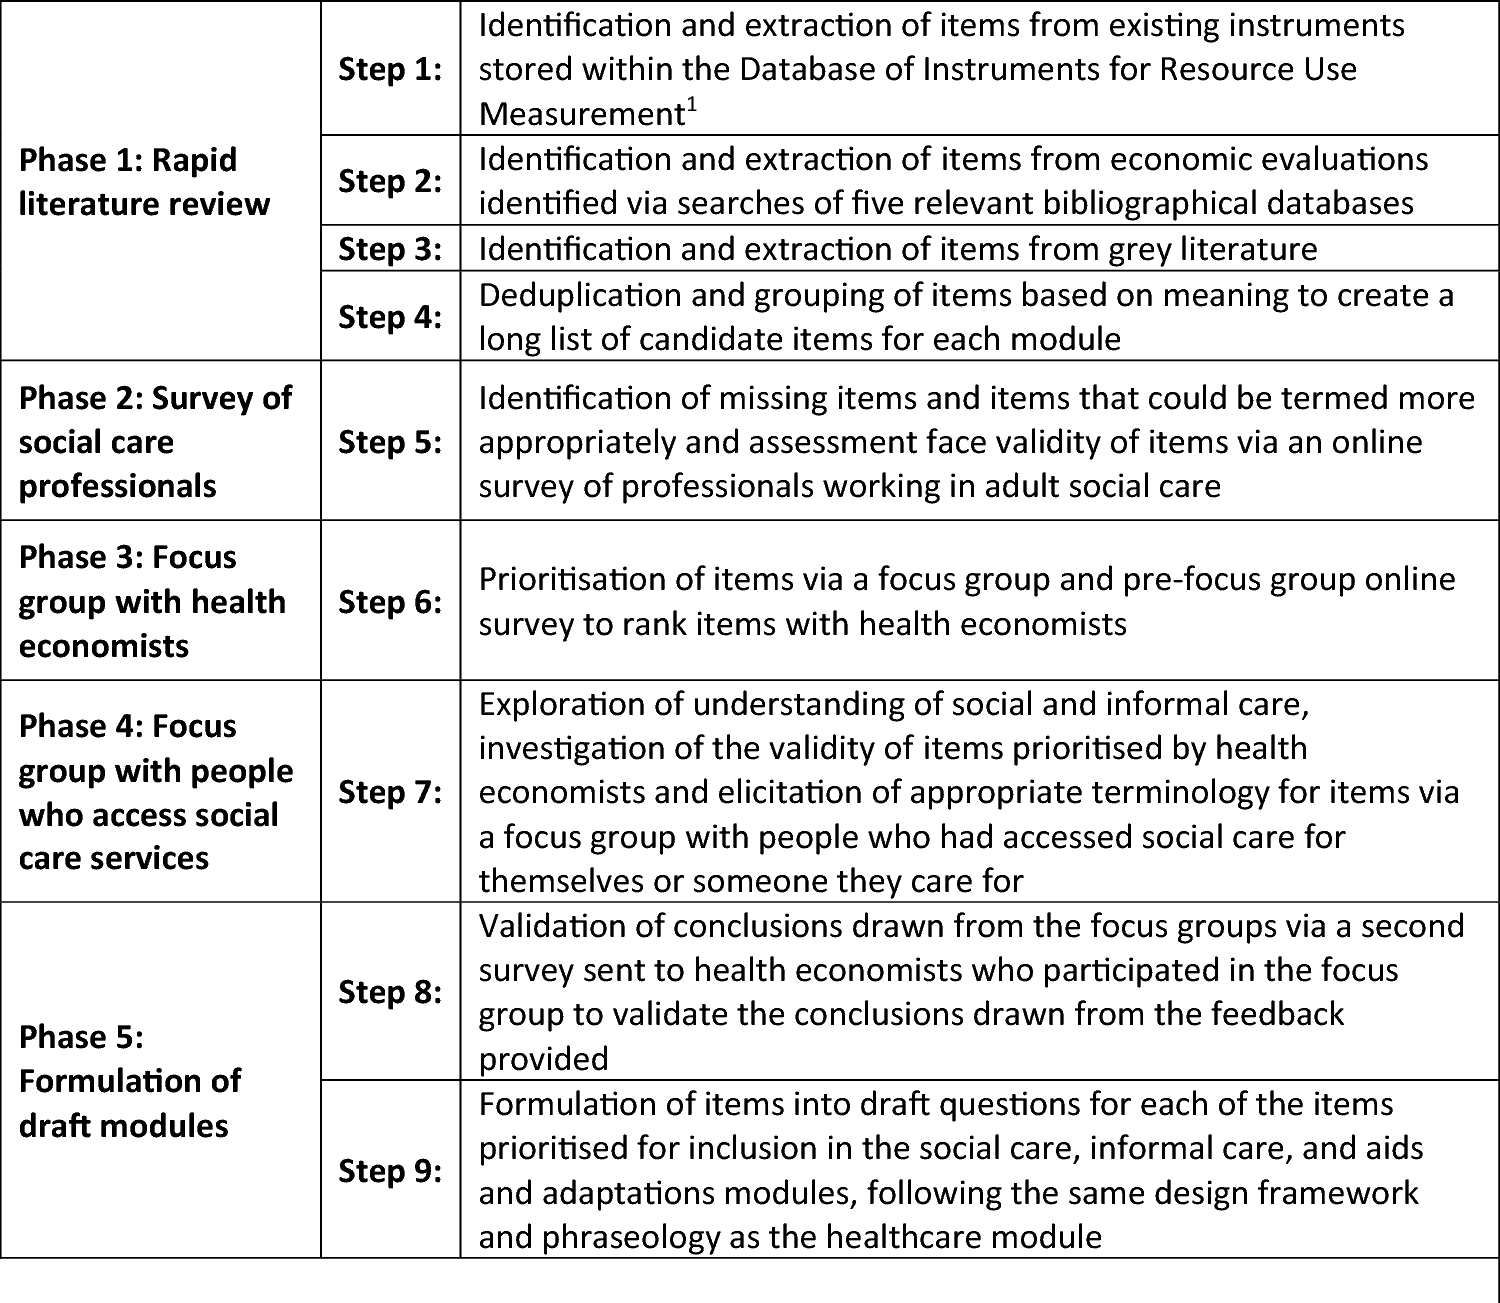
2.6 Decision ModelTo estimate the short- and long-term effects of both assessed screening strategies (DBT + s2D versus DM alone), a hybrid economic model Microsoft Office Excel® (Microsoft Corporation, Redmond, WA, EUA; decision tree plus Markov model, supplemental material) was built and is in line with the current clinical pathway for screening breast cancer following the Brazilian Ministry of Health guidelines (Fig. 1) [27, 28, 32, 33].
Fig. 1
Structure of lifetime economic model (decision tree and Markov model)
In summary, eligible patients can be screened either with DBT + s2D or DM. Patients assigned to the DBT + s2D intervention may follow three different branches according to what is observed in the screening result [positive (BI-RADS 4 and 5), suspect (BI-RADS 0), or negative/benign (BI-RADS 1, 2, and 3)]. In the first branch (BI-RADS 4 and 5), patients might be referred for biopsy and histopathological analysis for diagnostic confirmation when the screening test identifies a result that is suspicious or highly suspicious of malignancy. Biopsy results will either confirm the cancer diagnosis or classify the screening findings as a false positive (assuming no cancer or benign). We assume the biopsy is the gold standard for diagnosing breast cancer, with 100% sensitivity and specificity. Furthermore, we assumed that false negative results would be identified before the next screening test, characterizing them as interval cancers, and we considered the probabilities of invasive cancer or ductal cancer in situ (DCIS) for patients with biopsy-confirmed cancer. From this point, patients enter the Markov model with localized/regional cancer (TNM staging 0 to 3) or cancer with distant metastasis (TNM 4). Over the annual cycles, patients with localized/regional cancer can remain in this state of health, progress to the advanced stage by developing distant metastatic disease, or even progress to death. Patients diagnosed with metastatic cancer will remain in this health state until they progress to death.
Patients in the second branch (BI-RADS 0) are indicated for recall when additional evaluation is needed. We assumed that all recalled patients would undergo breast ultrasound scans, following the Brazilian Ministry of Health guidelines [27, 32, 33, 43]. Based on the breast ultrasound scan result, patients might or might not be referred to perform a biopsy for diagnostic confirmation. From this point, patients follow the same pathway as those in the previous branch.
Furthermore, patients assigned to the DBT + s2D group may have a negative screening result or benign result (BI-RADS 1, 2, or 3). In this case, there are two possibilities: (1) a patient does not have cancer (true negative result) or has a benign result, in either case patients must continue to be routinely screened, or (2) the screening result is false negative. Patients assigned to the DM group will follow the same structure described in the DBT + s2D branch, using different transition probabilities and costs over the model.
2.7 Model Input ParametersThere are well-established parameters in relation to recall and biopsy rate in the mammographic screening program for breast cancer in Brazil [43]. Nevertheless, these parameters are for all women and there are no parameters for each BI-RADS breast density pattern. So, probabilities of patients in both groups (DBT + s2D and DM alone) having undergone a biopsy or recalled were taken from the To-Be Trial study, whose outcomes were described by breast densities, according to the Volpara Density Grade (VDG) [34]. VDG outcomes are equivalent to the BI-RADS classification, which categorizes breast density into four levels, from A to D [44]. We calculated the probability of detecting cancer on the basis of the number of biopsies performed as described in the To-Be Trial study [34]. We also performed a meta-analysis to estimate the proportion of invasive cancer using data from six studies performed alongside randomized clinical trials (RCTs) and population-based screening programs. [28, 31, 35,36,37,38,39].
Patients diagnosed with invasive cancer were entered into the Markov model and started in one of the health states according to their stage of cancer, defined by the tumor, lymph node and metastasis (TNM) algorithm—TNM 1, TNM 2, TNM 3 or TNM 4, and their data were extracted from the To-Be Trial (Table 1) [34]. Every annual cycle, patients can stay in the same health state, progress to the next health state (distal metastasis), or die. The 5-year survival rates among Brazilian women with breast cancer were 98.7%, 93.3%, 86.2%, and 40.8% for TNM 1, 2, 3, and 4, respectively [45]. Probabilities of patients progressing from localized cancer (TNM 1–3) to metastatic cancer (TNM 4) were extracted from a Canadian study, assuming the probability of progression from local recurrence to distant recurrence [40].
Table 1 Point estimates, probability distributions, and source of parameter estimates used in the lifetime economic modelDue to a lack of data on the Brazilian population, we assumed that the 10-year survival probability for patients with DCIS and interval cancer were 94.2% and 82.5%, respectively, according to the Norwegian Cancer Registry [24]. For those women who attended the screening program and did not have cancer, we assumed that they would progress to death using the general mortality probabilities for women according to the Brazilian Institute of Geography and Statistics life-expectancy table [46]. Transition probabilities for the economic model (decision tree and Markov model) were sourced from the literature, and Table 1 presents a list of parameters used in the lifetime model.
2.8 Resource Use and CostsDM costs € 101.30 and DBT costs € 334.86 based on Brazilian Hierarchical Classification of Medical Procedures 2022. It is published by the Brazilian Medical Association (AMB) and is updated every 2 years [47]. The price difference between DM and DBT regards device acquisition, data storage costs and what radiologists receive for interpretation of the images that takes much more time. All the costs were based on Brazilian supplementary health service (BSHS) price list [48]. Unit costs were obtained from the literature [48,49,50] and applied to the record of resource use associated with the screening program and treating breast cancer according to the disease stage, including biopsy, histopathological test, breast ultrasound, drugs, radiotherapy, surgery, exams, and follow-up appointments. Treatment costs were calculated according to the Brazilian guideline for the diagnosis and treatment of breast cancer recommendations [51,52,53,54], assuming that from all breast cancers 15–20% are triple negative (basal like), 10–20% are HER2 overexpressed, 20–30% are luminal B, and 40–60% are luminal A [55]. We estimated the proportion of patients for the different treatments used on the basis of the Brazilian Society of Clinical Oncology Guideline [51,52,53,54]. We assumed a patient with a surface body area of 1.8 m2 (160 cm and 70 kg) [56] to calculate the chemotherapy dosage and costs. All estimated costs were converted from Brazilian real (BRL or R$) to euros (€) using the average exchange rate in 2023 [57]. Costs and health benefits (QALYs and life years gained) were discounted at 5% in line with national guidelines [28]. Costs were expressed in euros (2023 prices). An overview of values and cost measures is shown in Table 1. Further details on the micro-costing of each stage of the disease are presented in the Supplementary Material (Table S1).
2.9 Health Outcomes—Clinical EffectivenessWe performed a systematic review with meta-analysis following the Preferred Reporting Items for Systematic Reviews and Meta-Analyses (PRISMA) recommendations [59] to identify and compare the analytical validity and clinical utility of using DBT + 2Ds compared with DM alone in cancer screening in women aged 40–69 years with scattered areas of fibroglandular breast density and heterogeneous dense breasts.
A broad literature search was undertaken using multiple electronic databases: Medline (Ovid), Embase, and Cochrane Library. The search strategy combined terms related to digital tomosynthesis technology, synthesized mammography, digital mammography, and breast cancer. All searches were performed from inception to June 2022. Further details on the search strategies used in the electronic databases are presented in Supplemental Materials (Table S2). Search results from the different databases were imported and merged into Rayyan and duplicates were removed automatically or deleted manually [60]. The screening process and the critical appraisal were done by one reviewer and checked by another to minimize selection bias [61]. The eligibility criteria considered systematic reviews with or without meta-analysis, randomized clinical trials (RCTs), and comparative, prospective, or retrospective observational studies. Analytical validity was observed in studies through the accuracy, sensitivity, specificity, and safety analysis of DBT + s2D, while the clinical utility was observed through the cancer detection rates, recall, biopsy, cancer interval, and mortality in women with scattered areas of fibroglandular breast density and heterogeneous dense breasts (BI-RADS B and C). We excluded studies conducted on patients in the postdiagnosis context, patients recalled due to breast injury, or previously identified as high risk. Tables containing a summary of the main characteristics of the included studies and participants and a narrative description of the main results found with descriptive statistics (absolute and relative frequency) were elaborated. Clinical utility outcomes (e.g., cancer detection rate and recall rate) from included studies stratified according to the BI-RADS classification were meta-analyzed using the random effects model.
We use the QUADAS-2 tool to assess the risk of bias and the methodological quality of individual studies [62]. The overall quality of evidence was assessed following the Grading of Recommendations Assessment, Development and Evaluation (GRADE) recommendations [63].
2.10 AssumptionsIn formulating the key assumptions, we made conservative estimates to avoid favoring any intervention. We assumed that all recall patients before a biopsy had been submitted undergoing breast ultrasound scans, following the Brazilian Ministry of Health guidelines [43]. Furthermore, we assumed that patients with a false negative result would be identified before the next screening cycle, characterizing them with interval cancer. Comparing the difference between DBT + s2D versus DM alone was pooled as risk ratio using the Mantel–Haenszel method and based on random effects. Forest plots were used to display study-specific data in terms of improvement of detection cancer rates and detection of invasive cancer and reducing the recall rates and biopsy rates. As studies assessed different populations, we used random-effects models to allow for both within-study sampling variability and heterogeneity between studies when calculating pooled estimates. We use the Higgins I2 statistic, to assess the study heterogeneity, with I2 > 50% indicating the presence of heterogeneity [64]. When substantial heterogeneity in diagnostic accuracy was observed between studies, we investigated a threshold effect by visual assessment of coupled forest plots of sensitivity and specificity, and a Spearman correlation coefficient between sensitivity and false positive rate (correlation coefficient > 0.6 indicated a threshold effect) [65]. We also visually assessed the differences between the 95% confidence region and the 95% prediction region in the HSROC curve for examining the presence of heterogeneity between studies [66]. Analyses were carried out using the STATA version 14.2 (StataCorp.) [67].
2.11 Sensitivity AnalysisUncertainty around the parameter estimates used in our model was fully characterized and propagated through to the model results by conducting probabilistic and deterministic sensitivity analyses (PSA/DSA). PSA was done by defining parameter values using distributions rather than point estimates. The model was then run 1000 times with a value randomly drawn from the assigned probability distribution. This produced a distribution of model outputs that was represented visually on the cost-effectiveness plane. Cost-effectiveness acceptability curves (CEACs) were used to represent the probability that an intervention would be cost effective compared with the control group at a range of willingness-to-pay (WTP) thresholds. DSA was carried out considering minimum and maximum values of the parameters using the 95% CI when the data were available or varying by ± 25%.
The WTP threshold for the public health system in Brazil is a gross domestic product (GDP) (€ 7200.00) per QALY [68]. Currently the supplementary (private) health system is discussing the implementation of a specific threshold, but there is no agreement yet. So, we used the public health system WTP threshold above as a conservative assumption.
留言 (0)