
記住我


This economic evaluation was undertaken from the perspective of the United Kingdom (UK) health care system, as this is a key reference country for the use of cost-effectiveness analyses. The analysis covers direct health and social care costs and uses data from the RADIANCE-HTN TRIO trial [9], which had Ethics Committee and Institutional Review Board approvals from each site participating in the study. The evaluation is reported in accordance with the Consolidated Health Economic Evaluation Reporting Standards (CHEERS) statement and the UK National Institute for Health and Care Excellence (NICE) reference methods [16, 17]. A state-transition (Markov) model was used to project the impact of treatment with the Paradise uRDN system (ReCor Medical Inc., Palo Alto, CA, USA) plus SoC compared with SoC alone. A lifetime time horizon was used to capture all potential cost and outcome effects of the intervention, and both were discounted at 3.5% per annum [17].
2.2 Patient PopulationIn the base-case analysis, the rHTN population considered in the model was based on RADIANCE-HTN TRIO trial inclusion and exclusion criteria [9]. The trial was conducted across 28 tertiary centres in the United States and Europe, and included patients aged 18–75 years with office BP ≥ 140/90 mmHg despite three or more antihypertensive medications, including a diuretic. Eligible patients were switched to a once-daily, fixed-dose, single-pill combination of a calcium channel blocker, an angiotensin receptor blocker, and a thiazide diuretic. After 4 weeks of standardised therapy, 136 patients with daytime ambulatory BP of at least 135/85 mmHg were randomly assigned (1:1) to uRDN (n = 69) or a sham procedure (n = 67).
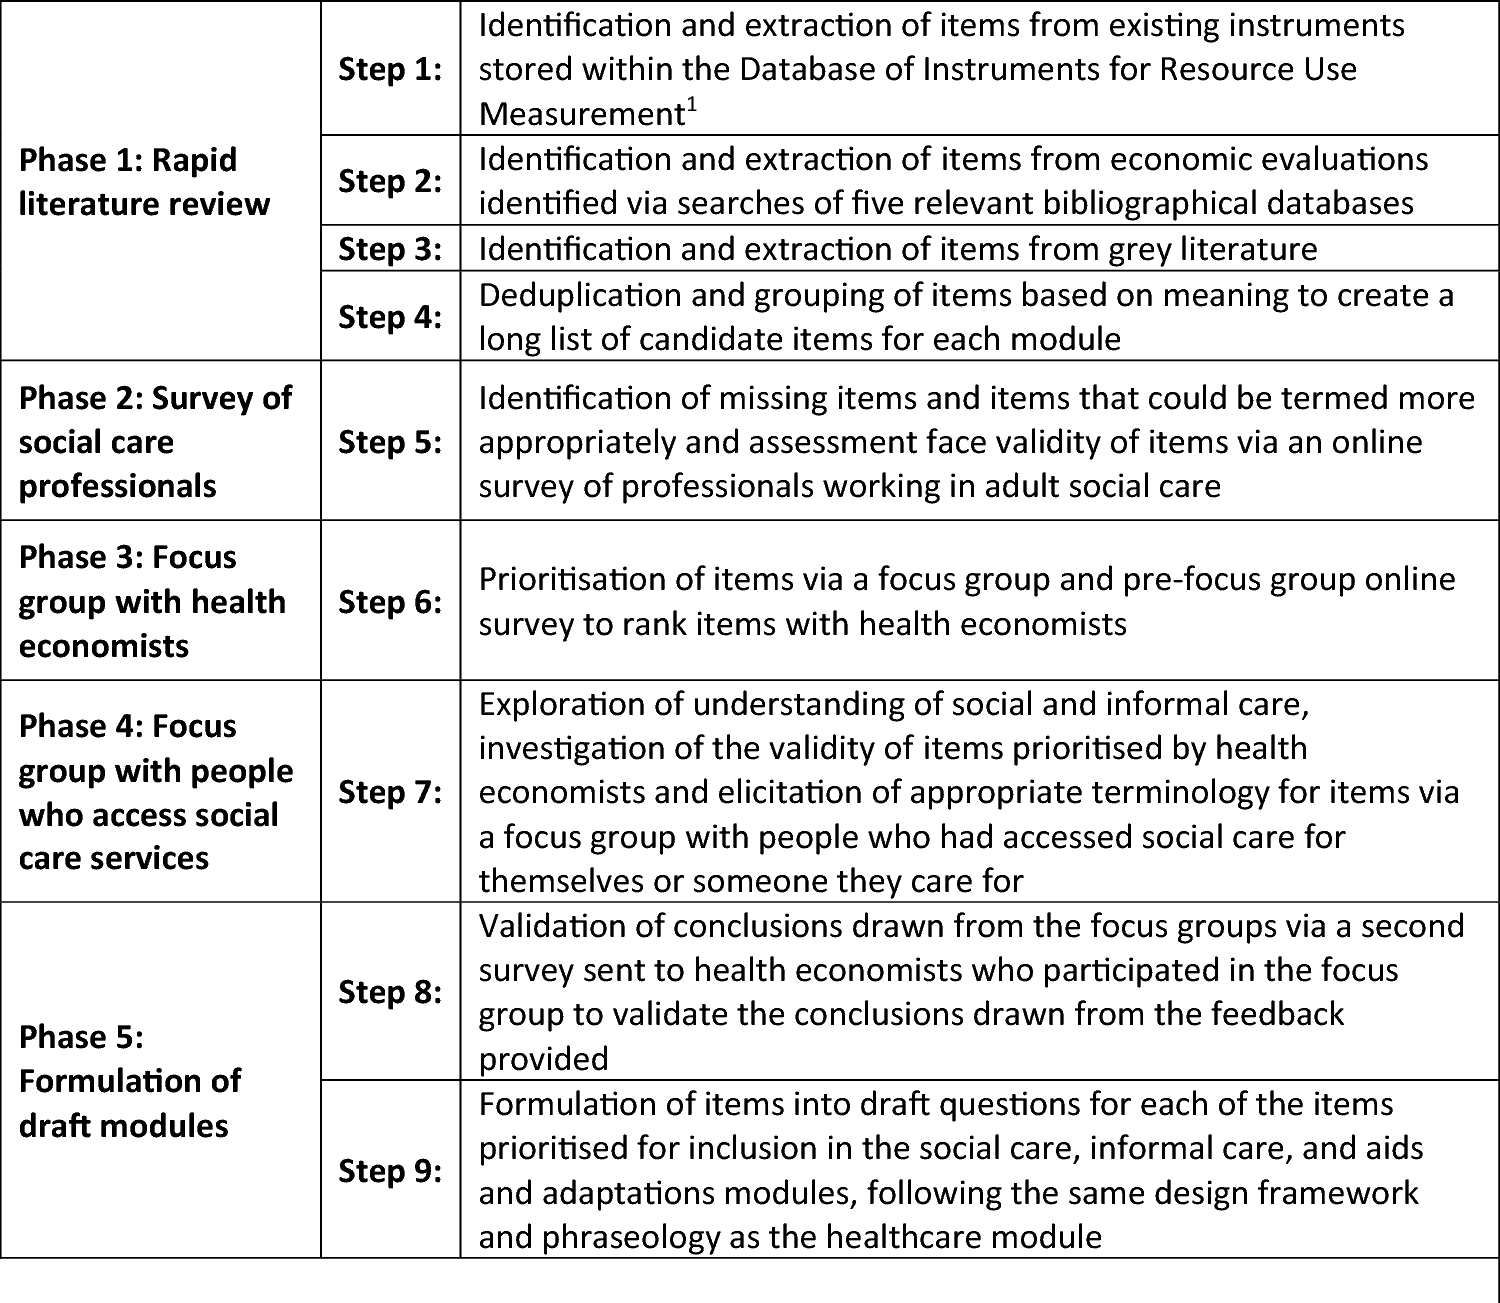
2.3 Model StructureThe model had a 1-month cycle length with half-cycle correction incorporated. The model included 11 mutually exclusive health states to represent disease progression. This structure was based on previous economic evaluations and uses SBP as a surrogate endpoint to predict cardiovascular and renal disease risks (Fig. 1) [10, 12]. The model projected six clinical events: angina pectoris/coronary heart disease (AP/CHD), end-stage renal disease (ESRD), myocardial infarction (MI), heart failure (HF), stroke, and all-cause mortality. All patients start in the hypertension health state and move to a different health state (with different health-related quality of life [HRQoL] and costs) when an event occurs. Death is an absorbing health state and can occur at any time. Consistent with previous cost-effectiveness models, we used risk equations based on Framingham and the Prospective Cardiovascular Münster (PROCAM) study to model how patients transition through the different health states [18].
Fig. 1
Structure of the cost-effectiveness model. *Death is an absorbing health state that can be entered at any given time. #Memory has been incorporated to track ESRD status throughout the model time horizon. ^ Memory has been incorporated to track heart failure status in stroke patients. AP angina pectoris, CHD coronary heart disease, ESRD end-stage renal disease, MI myocardial infarction
Compared with previous modelling, three major modifications were made to more effectively capture the true clinical impact of SBP changes following renal denervation. First, and most importantly, we changed the approach to modelling the effect of SBP reduction. Risk equations used in previous models to predict the downstream effect of a change in SBP on long-term cardiovascular risk were based on epidemiological observational data (e.g., Framingham and PROCAM) and therefore do not accurately reflect the change in risk of clinical events resulting from a change in SBP due to an intervention to actively reduce blood pressure. To address this, we translated the SBP reduction associated with uRDN to a reduction of clinical events based on the relative risks reported by the meta-analysis of Thomopoulos et al. in 2014 (55 randomised controlled trials [RCTs] of antihypertensive medication in 195,267 individuals) [19]. In contrast to the meta-analyses of Rahimi et al. [20] and Ettehad et al. [21], Thomopoulos et al. included only RCTs with antihypertensive treatment intent. Second, we added a recurrent stroke health state to capture the significantly elevated long-term risks of a stroke and the reduced HRQoL for patients with recurrent stroke [22, 23]. Third, we incorporated ‘memory’ functionality for ESRD. The model structure already incorporated a memory to track HF status in stroke patients, as this significantly impacts HRQoL. Supplementing with a ‘memory’ for ESRD captures the HRQoL-lowering effects and continued high costs of ESRD in subsequent events, e.g., an MI or stroke.
2.4 Clinical and Health-Related Quality-of-Life InputsTable 1 summarises the key parameters used in the model. A full description is provided in the e-Appendix (see the electronic supplementary material). The model used office-based SBP from the RADIANCE-HTN TRIO trial since current cardiovascular risk equations [18, 24] and published meta-analyses of the clinical effect of changes in SBP [19,20,21] are calibrated using office SBP measurements. The baseline office SBP across both arms of the trial was 155.3 mmHg, with a mean reduction of 8.5 ± 19.1 mmHg in the uRDN arm at 2 months. No sham intervention would be performed in real-world clinical practice and any placebo effect would be part of the overall treatment effect observed for the intervention. Therefore, the base-case analysis assumes that no SBP reduction was associated with SoC alone (continued medical management for rHTN). Similar assumptions have been used and were accepted previously for health technology assessments in the UK [25, 26]. Other model clinical parameters were derived from literature searches and previously published models. Utilities for specific health states were drawn from a variety of sources, including previous clinical trials and economic evaluations of cardiovascular interventions and HRQoL studies (see Table 1). Further details of the sources of utilities are provided in eAppendix 1.3 Tables 3 and 4.
Table 1 Key clinical, HRQoL, and cost input parameters2.5 Cost InputsCosts used in the model are also outlined in Table 1 and e-Appendix 1. Costs were taken from published sources, including the Personal Social Services Research Unit (PSSRU) Pay and Prices Index and UK Department of Health and Social Care drugs and pharmaceutical electronic Market Information Tool (eMIT) [27, 28]. The cost of the uRDN procedure is estimated to be £6500 (€7545) [costs provided by the manufacturer], including both the costs for the catheter and the hospital treatment costs. When required, costs were inflated to 2021/2022 GBP/£ levels using NHS cost inflation indices [27], and results were converted to Euros using the conversion rate by the European Central Bank as of 8 August 2023 (£1.0000 = €1.1607).
2.6 Data AnalysisResults were reported as incremental cost-effectiveness ratios (ICERs). This was done by calculating the ratio of the difference in mean costs and mean change in quality-adjusted life-years (QALYs) and life-years (LYs) between Paradise uRDN plus SoC and SoC alone. To provide full insight into the robustness of the results, a 95% confidence interval (CI) around the ICER has been calculated. The box method was applied as a simplified method to calculate this interval to avoid additional complexity [29].
One-way sensitivity analysis (OWSA) and probabilistic sensitivity analysis (PSA) were conducted to assess the uncertainty surrounding the model inputs and sensitivity of the model results to changes in parameter inputs. OWSA was performed using realistic minimum and maximum individual model inputs (one at a time); for all model parameters, the minimum and maximum plausible values for univariate analysis were defined as the lower and upper 95% confidence limits (95% CIs). For the PSA, all parameters were varied simultaneously and results were recorded for 1000 iterations, which was enough to provide stable results. Most variables were assumed to have a normal distribution, except for proportions, probabilities, and utility estimates, which were all varied using a beta distribution. Hazard ratios were varied using a gamma distribution. An overview of which parameters were included in each analysis is provided in the e-Appendix.
Several scenario analyses were used to explore the impact of the model’s structural assumptions. For insight into the real-world cost effectiveness of uRDN, we used the 12-month results of the ACHIEVE study, which included patients treated with the uRDN system (n = 96) [15]. The ACHIEVE study observed the effectiveness of the uRDN system in reducing BP, demonstrating a 15.0 mmHg reduction in mean office SBP. The mean baseline office SBP in ACHIEVE was 176 versus 155.3 mmHg in the RADIANCE-HTN TRIO trial [9, 15]. A scenario was also included that uses the estimate of 5 mmHg SBP reduction to test the cost-effectiveness, in case data from placebo-subtracted sham-controlled trials were used.
A patient-level simulation component explored the impact of modelling a heterogeneous patient population, which can cause biased results when there is a non-linear relationship between risk factors and cardiovascular event risks (Jensen’s inequality) [30]. The simulation model uses random sampling to create a virtual patient cohort based on defined patient characteristics and the correlation between them, as found in the RADIANCE-HTN TRIO trial (e-Appendix 2). Each patient from the cohort is then run through the model’s existing Markov structure. The results are averaged to achieve an overall cohort result to compare with the base-case deterministic results. Patient-level simulation represents a novel approach in hypertension modelling that was not featured in previously published models [9, 10].
For external validation, modelled relative risks and hazard ratios were compared with those presented in meta-analyses conducted by Rahimi et al. [20] and Ettehad et al. [21]. Absolute risks were compared with clinical examples of the QRISK3 algorithm, presented by Hippisley-Cox et al. [31].
留言 (0)