
記住我


Our prospective, single-centre study was approved by the Medical Ethics Committee of the Xiangya Hospital of Central South University. The written informed consent for the dual-energy CTE scan was obtained from all participants.
Study participantsThe inclusion criteria were as follows: (a) patients with a confirmed diagnosis by endoscopy, histopathology, clinical features, diagnostic imaging, and laboratory findings [25] and (b) patients without contraindications or previous adverse reactions to iodine contrast media and who could successfully finish dual-energy CTE examination. The exclusion criteria were described below: (a) patients with the preparation of intestinal tract for dual-energy CTE scanning but who were scanned in dual-energy CT angiography and CT venography of superior mesenteric artery and vein (to exclude mesenteric thrombotic diseases); (b) patients with too poor image quality of dual-energy CTE and serious artefacts affecting the measurement of creeping fat; (c) patients whose dual-energy CTE examination was not standardised (e.g. the portal phase was scanned, instead of the enteric phase).
Totally, 292 dual-energy CTE scans were performed from March 1, 2019, to March 31, 2021, in our hospital, including the scans for 161 patients with a confirmed diagnosis of CD. In these 161 CD patients, 3 cases were excluded according to the exclusion criteria, 109 cases were treated with medical drugs, and 49 cases underwent subsequent surgery for CD complications (intestinal obstruction, abdominal abscess, and fistula formation) and medical treatment failure [26]. According to the intraoperative exploration findings and the postoperative pathologic results, 40 cases of CD with creeping fat were selected as the creeping fat group and 9 cases of CD whose MAT covered < 50% of the affected bowel circumference [5] were excluded because such coverage did not meet the standard of creeping fat. Meanwhile, 40 cases of non-CD patients with normal MAT were selected as the control group. The detailed inclusion criteria of the control group were as follows: (a) patients with various symptoms such as abdominal distention, abdominal discomfort, diarrhoea, and abdominal pain, and received dual-energy CTE to screen bowel disease; (b) no obvious abnormalities were found in the abdomen except for small hepatic cysts, renal cysts, ovarian cysts, noncomplicated gallstone, small renal calculus, and small myoma of the uterus (these abnormal findings were considered as not clinically significant); (c) without obvious gastrointestinal tract diseases, such as inflammatory bowel disease, intestinal tuberculosis, gastrointestinal cancer, and intestinal Behcet’s disease, which were carefully confirmed by a comprehensive diagnosis of clinical features, endoscopy, radiological imaging, and laboratory findings (Fig. 1).
Fig. 1
Flowchart of study enrollment
Dual-energy CTE scanning protocolAll patients underwent dual-energy CTE scanning on a 256-detector row CT scanner (Revolution CT, GE Healthcare, USA) using a uniform protocol. The patients were asked to have a low-residue diet during the day before the examination and keep fasting for over 10 h before the dual-energy CTE examination. One hour before scanning, the patients were required to drink a 2.5% mannitol solution (a total volume of 1200 to 1500 mL solution or more) at 20-min intervals (60, 40, and 20 min before scanning). Iopamidol injection (1.5 mL/kg body weight) was injected at a flow rate of 3 mL/s via the elbow vein using a power injector system. Contrast-enhanced CT scans were performed under the gemstone spectral imaging (GSI) scanning mode (with tube voltage fast switching between 80 and 140 kVp) at the enteric phase [27]. By utilising the bolus tracking technique, an individualised delay time for the enteric phase was determined as 30 s after the aorta reached the threshold of 100 HU. The scanning range was the full abdomen–pelvis from the diaphragmatic apex to the perineal bottom. The scanning parameters were as follows: tube current, 405 mA; scan type, helical; thickness, 1.25 mm; ASiR-V (adaptive statistical iterative reconstruction V) at 30% blending ratio; rotation time, 0.5 s; helical pitch, 0.984. Owing to the new-generation model-based iterative reconstruction ASIR-V, images acquired via this scanning protocol achieved an acceptable noise level and maintained diagnostic confidence at a low-radiation dose.
Energy spectral reconstructionsAll data of the dual-energy CT scans of the enteric phase were transferred to and analysed on the AW 4.7 workstation (GE Healthcare, USA) with GSI software.
On the workstation, the fat–water material basis images, fat-iodine material basis images, and virtual monochromatic (VMC) images with energies ranging from 40 to 100 keV were obtained (these spectral reconstructions were automatically done in 3–5 min per scan). Multi-material decomposition (MMD) algorithm [28, 29] was also applied in this study. Fat volume fraction (FVF) maps were generated using GSI Liver Fat software (AW 4.7 workstation; GE Healthcare, USA).
Clinical characteristics of CDThe relevant clinical data of all patients were obtained from our institutional electronic medical record system. These records were collected when the patient was hospitalised. The Crohn’s disease activity index (CDAI) and Montreal classification of each CD patient were recorded. Inactive and active CD was defined as CDAI < 150 and CDAI ≥ 150, respectively [30].
Image analysis and measurementsCreeping fat was defined as MAT covering more than half of the affected bowel circumference. In the prospective cohort, the imaging and surgical correlated evaluation of each patient was conducted by a radiologist with 20 years of experience in abdominal imaging and a surgeon with 15 years of experience in the surgical treatment of CD. The location and extent of the bowel lesion and the creeping fat on the preoperative CTE images were carefully assessed and matched with the surgical findings and pathological results of the resection specimens [16].
Two radiologists independently drew the ROIs and performed the measurements on the axial images. For CD patients, the ROIs of creeping fat were placed on the diseased mesentery with radiologic-surgical-pathological correlations. Moreover, the measurements on subcutaneous fat and normal mesentery were also conducted for each patient. The ROIs of creeping fat should be close to the affected bowel and avoid blood vessels and lymph nodes. Depending on the extent of creeping fat, the area of ROIs ranged from 7 to 30 mm2. The ROIs of subcutaneous fat were placed on the subcutaneous adipose tissue, avoiding subcutaneous muscles or possible subcutaneous lesions. The ROIs of normal mesentery were placed on the normal mesentery close to normal ileal bowels, avoiding blood vessels and lymph nodes. The shapes of ROIs were circular or elliptical. Once the ROIs were drawn, quantitative spectral parameters were automatedly shown. For the measurements of each tissue, three ROIs at different sites were selected and their means were calculated and recorded for each patient.
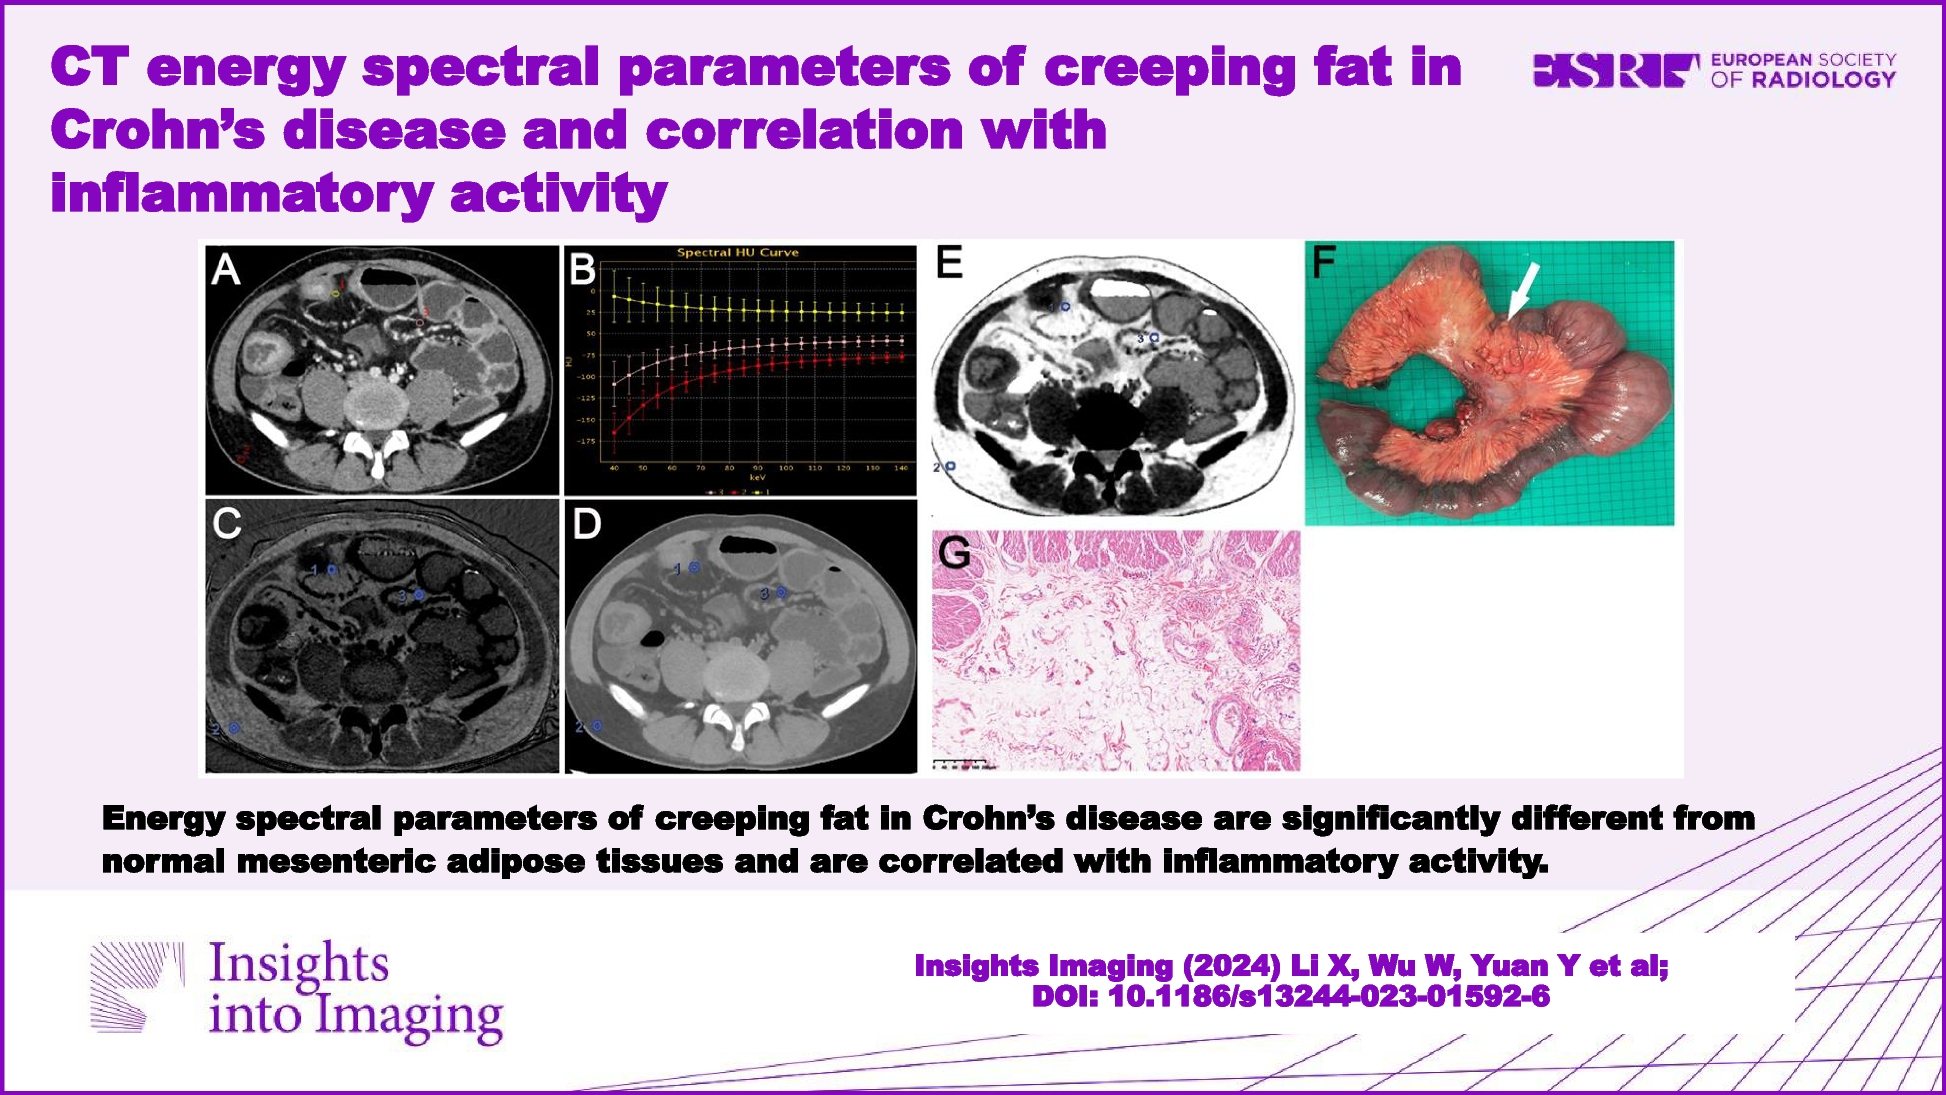
The normalised fat–water concentration (NFWC) was defined as the value of the fat–water concentration of the tissue divided by the subcutaneous fat–water concentration on fat–water material basis images. Similarly, the normalised fat-iodine concentration (NFIC) was defined as the value of the fat-iodine concentration of the tissue divided by the subcutaneous fat-iodine concentration on fat-iodine material basis images. The normalised FVF (NFVF) was defined as the value of the fat volume fraction of the tissue divided by the subcutaneous fat volume fraction on fat volume fraction images. The purpose of normalisation was to minimise individual differences. Approximately, the time for acquiring quantitative spectral parameters was 5–8 min per patient for a radiologist with preliminary experience. The slope of Hounsfield unit curves between 40 and 100 keV (λHU) was calculated as the following equation: λHU = (CT attenuation of ROI on 40 keV VMC images − CT attenuation of ROI on 100 keV VMC images)/60. An example of the selected ROIs for measurements and calculations of λHU, NFIC, NFWC, and NFVF of a CD patient with creeping fat is shown in Fig. 2.
Fig. 2
A 30-year-old male patient with inactive Crohn’s disease and non-stricturing and non-penetrating behaviours (a–g). The enteric phase CT enterography axial 70 keV virtual monochromatic (VMC) image (a) demonstrated the thickening of the ileal bowel wall as well as creeping fat, and the ROIs were selected in the creeping fat (ROI 1), the normal subcutaneous fat (ROI 2), and the “normal” mesenteric adipose tissue (ROI 3). b showed that compared with the subcutaneous fat (ROI 2) and “normal” mesenteric adipose tissue (ROI 3), the λHU curve of creeping fat (ROI 1) was inverted. c, d, and e showed fat–water material basis images, fat-iodine material basis images, and fat volume fraction maps at the enteric phase, respectively. The resected specimen (f) showed creeping fat wrapping around the affected ileal bowel loop. Pathological image (g) (HE, × 100) showed hyperplasia with increased small round adipocytes, vascular proliferation, and stromal cell infiltration in creeping fat
Statistical analysisSPSS version 22.0 statistical software (IBM, Armonk, NY, USA) was used for statistical analysis. The Kolmogorov–Smirnov test was applied to evaluate whether the continuous variables had a normal distribution. The continuous variables were expressed as mean ± standard deviation (SD) or interquartile range (IQR), while the categorical variables were presented as number (n) and percentage (%). The continuous variables (λHU, NFIC, NFWC, and NFVF at the enteric phase) had skewed distribution or heterogeneity of variance. Mann–Whitney U test was applied to compare the quantitative parameters of creeping fat with inflammatory activity at the enteric phase. Kruskal–Wallis H test was used for comparisons among MAT in the controls, “normal” MAT, and creeping fat in CD groups. Receiver operating characteristic (ROC) curve analysis was performed to evaluate the performance of quantitative parameters in assessing inflammatory activity of creeping fat. Then, the area under the curve (AUC), sensitivity, and specificity were separately calculated. A two-sided p value < 0.05 indicated a statistically significant difference.
留言 (0)