
記住我


This retrospective multicenter study was conducted under institutional review board with a waiver of informed consent.
We searched the institutional pathological databases from January 2009 to January 2022 to select patients diagnosed with CS from surgically resected or biopsy specimens. The inclusion criteria were as follows: (1) CS patients confirmed by surgical or biopsy pathology and (2) CS patients who underwent non-contrast-enhanced CT examinations within 2 weeks prior to obtaining surgical or biopsy pathology. Exclusion criteria included patients with other malignancies, insufficient image quality (images with metallic or motion artifacts), and incomplete follow-up data. Finally, a total of 214 patients from the Affiliated Hospital of Qingdao University (training cohort, n = 113) and Shandong Provincial Hospital Affiliated to Shandong First Medical University (test cohort, n = 101) were enrolled in this study (Fig. 1).
Fig. 1
Flow diagram depicting the patient selection process. *The Affiliated Hospital of Qingdao University. **Shandong Provincial Hospital Affiliated to Shandong First Medical University
Clinical and pathological data including age, sex, height, weight, tumor size, tumor site, pathologic grade, and treatment strategy were collected from the electronic medical records.
Follow-upPatients were followed up at least every 6–12 months for the first 2 years and then annually. The last follow-up date was December 28, 2022. The follow-up data was obtained through medical records, imaging findings (X-ray, CT, MRI), or telephone. The endpoint of this study was progression-free survival (PFS), defined as the time from the date of diagnosis until local recurrence, distant metastasis, death from any cause, or last follow-up.
CT data acquisitionNon-contrast-enhanced CT was performed in all patients. Six CT scanners at two centers were used for axial scanning. Detailed CT scanning protocols are shown in Table S1.
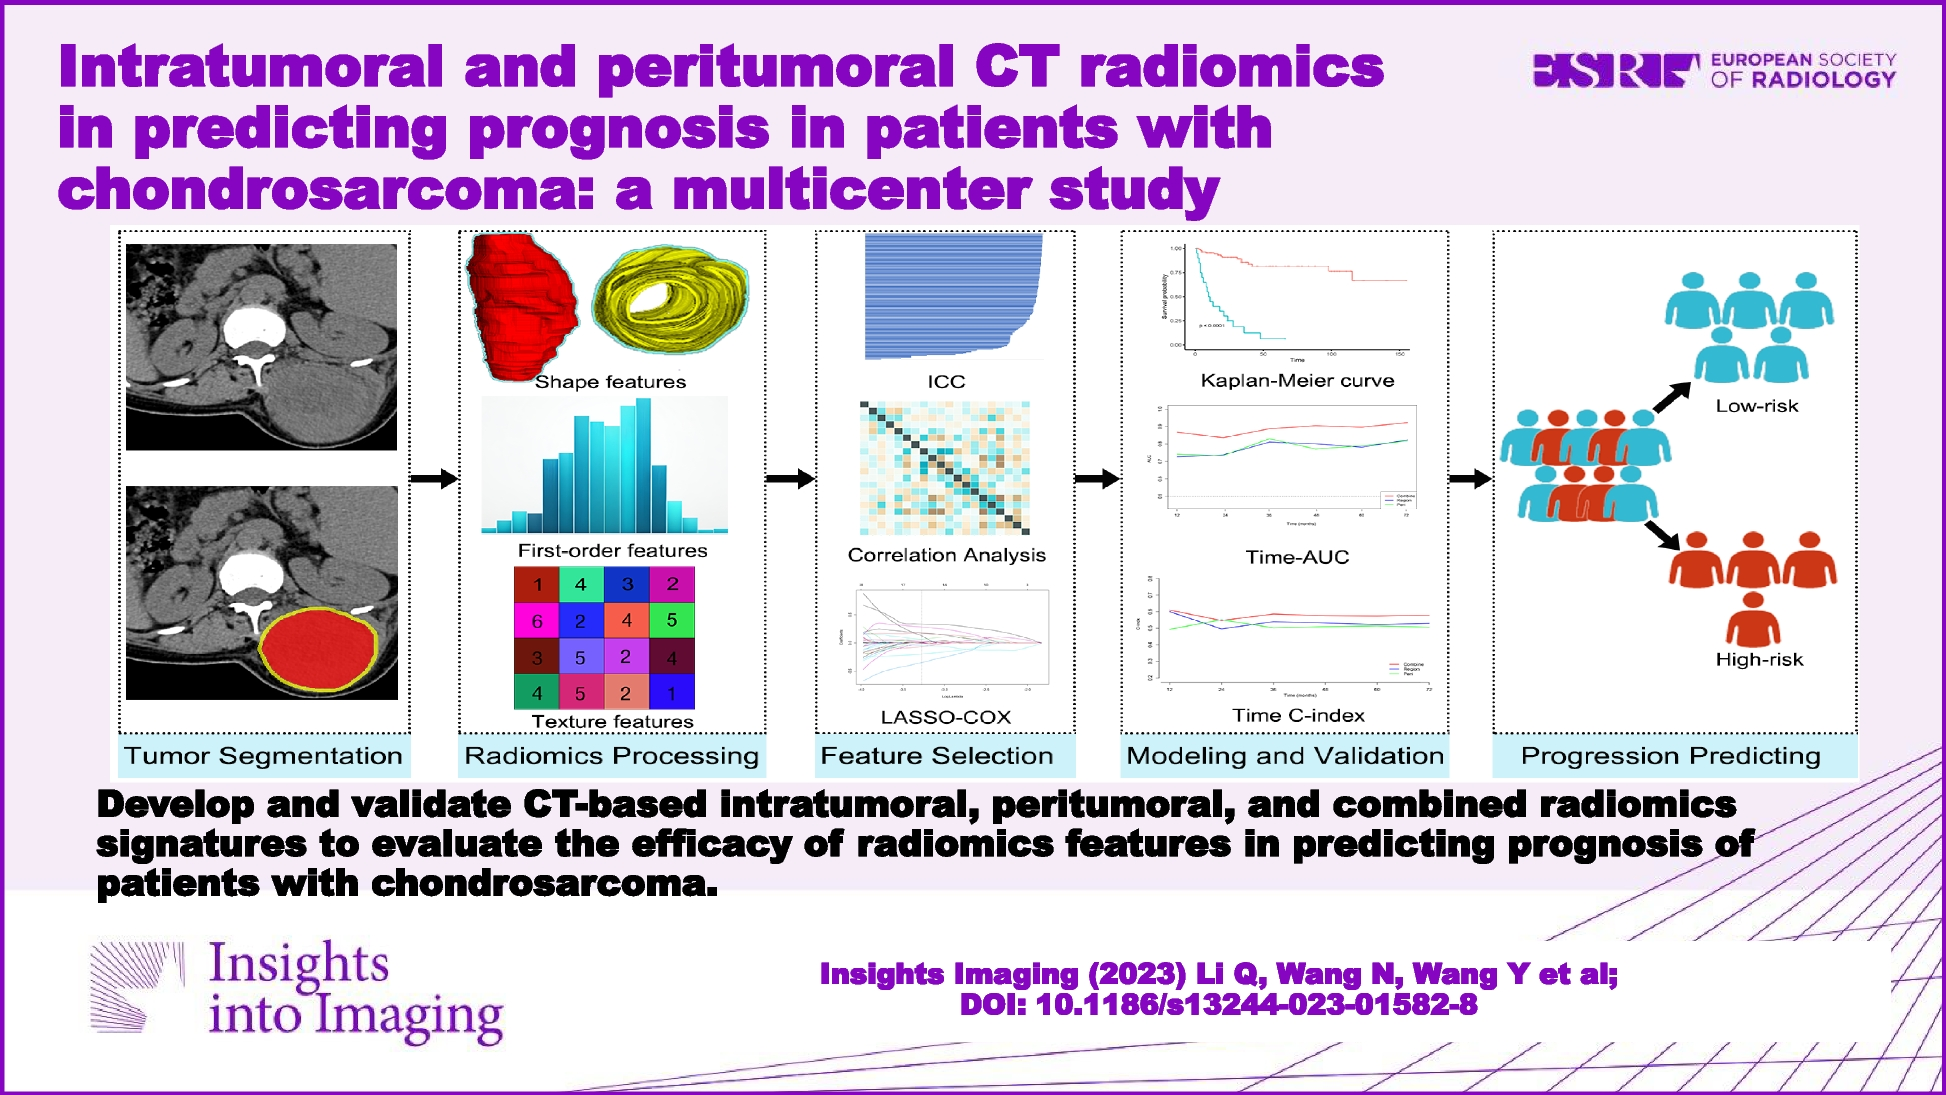
Image segmentation and radiomics features extractionThe workflow of radiomics is shown in Fig. 2. The three-dimensional (3-D) region of interest of the tumor (ROI region) was segmented on axial CT images by two radiologists (Reader 1 and Reader 2, with 6 and 8 years of experience in interpretation of musculoskeletal imaging, respectively) using ITK-SNAP software (version 3.8.0, www.itksnap.org). The peritumoral region of interest (ROI peri) was generated by the “ROI operation” module of the RIAS software [24], which automatically expanded 3 mm outwards the tumor and removed the tumor area.
Fig. 2
The workflow of the multicenter study. The tumor was segmented to determine the intratumoral ROI (red) and peritumoral ROI (yellow) from non-contrast-enhanced CT images. More related images of this case can be found in the supplementary material. ICC, intra-/inter-class correlation coefficient; LASSO, least absolute shrinkage and selection operator; AUC, area under the curve
As the patients were from different centers, the CT images were resampled and grayscale discretized and normalized before feature extraction. The extraction of radiomics features was conducted through the RadCloud platform (Huiying Medical Technology Co., Ltd). A total of 2818 (1409 + 1409) radiomics features were extracted from the intratumoral and peritumoral ROIs, including first-order statistics, shape- and size-based features, texture features, and higher-order statistical features. The details of the radiomics features are shown in supplementary methods.
Intra-observer and inter-observer reproducibilityIntra- and inter-class correlation coefficients (ICCs) were used to evaluate intra- and inter-observer reproducibility. Forty CT images were randomly selected, and ROI segmentation was performed independently by Reader 1 and Reader 2 to assess the inter-observer reproducibility. Reader 1 repeated the segmentation 2 weeks later to assess the intra-observer reproducibility. Intra- and inter-observer ICC > 0.75 indicated good reproducibility and radiomics features with ICC < 0.75 have been excluded [25]. The remaining image segmentations were performed by Reader 1.
Development of intratumoral, peritumoral, and combined radiomics signaturesThe selection of radiomics features was divided into three steps; both intratumoral and peritumoral radiomics features underwent the same process respectively. First, Pearson correlation analysis was used to reduce the redundancy of radiation signatures. Then, univariate Cox proportional regression analysis was used to select the radiomics features with p < 0.05. Finally, the least absolute shrinkage and selection operator (LASSO) Cox regression model was used to select the optimal features. λ was the regularization parameter of LASSO regression and was selected when the cross-validation error is minimum. Radiomics score (Rad-score) was calculated for each patient using a Cox proportional hazard regression model.
Evaluation of intratumoral, peritumoral, and combined radiomics signaturesHarrell’s concordance index (C-index) and hazard ratio (HR) were used to assess the accuracy of the three radiomics signatures in predicting PFS in the training cohort and verified in the test cohort. X-tile software was used to determine the optimal threshold for Rad-score, and Kaplan-Meier survival analysis was used to analyze PFS in both groups to evaluate the prognostic significance of the three radiomics signatures. In order to compare the signature-predicted survival with the actual survival, calibration curves were generated. To investigate the prognostic performance of different radiomics signatures, time-dependent area under the receiver operating characteristics curve (time-AUC) and time-dependent C-index (time C-index) were used. The net reclassification improvement (NRI) was calculated to evaluate the incremental value of the combined signature over the single signature.
StatisticsSPSS 26.0 software (IBM, Chicago, IL, USA) was used for independent sample Student t-test or Mann-Whitney U-test, chi-square (χ2) test, or Fisher exact test, where appropriate. ICC, Pearson correlation analysis, univariate Cox proportional regression analysis, LASSO Cox regression analysis, calibration plots, Kaplan-Meier survival analysis, C-index, time C-index, time-AUC analysis, and NRI analysis were performed with R statistical software (Version 4.2.1, https://www.r-project.org). A two-sided p < 0.05 was considered statistically significant.
留言 (0)