
Remember me


Participants' baseline characteristics are presented in Table 1. The study enrolled 361 patients on hemodialysis, of whom 223 (61.8%) were male. The median age was 61 (53,70) years old, and the dialysis vintage was 35.5 (17.8, 76.2) months. The prevalence of hypertension, diabetes, history of CAD and cerebral vascular accident (CVA) was 93.4%, 23.8%, 10.2%, and 11.4%, respectively. The median Lp-PLA2 activity observed within the study cohort was 481.2 U/L.
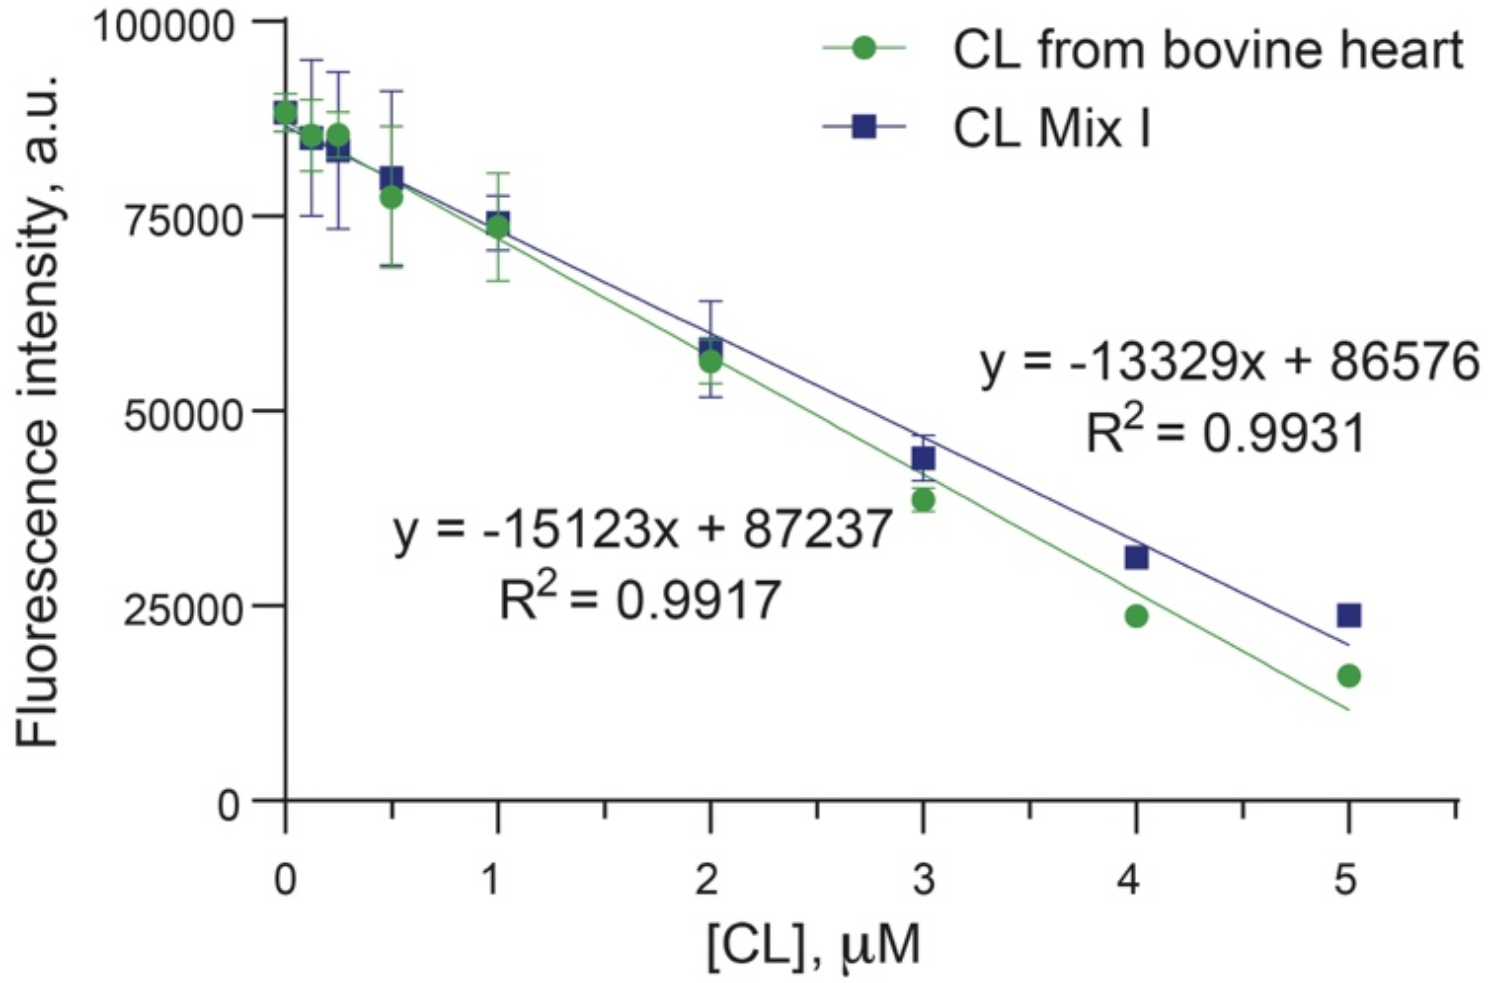
Table 1 Baseline demographic, clinical, and biochemical characteristics of the study populationThe median serum Lp-PLA2 activity was used to classify the patients into two groups: the low Lp-PLA2 group and the high Lp-PLA2 group. Subjects in the high Lp-PLA2 group had significantly higher apo-B (0.95 vs. 0.75 g/L; P < 0.001), TC (4.89 vs. 3.98 mmol/L; P < 0.001), LDL-C (3.06 vs. 2.23 mmol/L; P < 0.001), and prealbumin (0.29 g/L vs. 0.27 g/L; P = 0.005). Additionally, a lower proportion of individuals within the high Lp-PLA2 group were observed to be recipients of statin therapy (13.3% vs. 23.2%; P = 0.015). However, no statistically significant disparities were identified between the high Lp-PLA2 group and the group with lower Lp-PLA2 activity concerning all other demographic, clinical, and biochemical parameters. The correlation analyses findings are detailed in Table 2.
Table 2 Correlation analyses of variables associated with Lp-PLA2 activityLipid profile and patient outcomesAll enrolled patients were followed until April 1st, 2022. The median follow-up was 78.1 (34.7, 104.5) months. During follow-up, 182 patients died, 14 patients received kidney transplantation, 1 patient was converted to peritoneal dialysis and 30 patients were transferred to other centers.
Mortality incidents were primarily attributed to CVDs (n = 77; 42.3%), followed by infection (n = 42; 23.1%), cancer (n = 17; 9.3%), gastrointestinal bleeding (n = 10; 5.5%), and other causes (n = 36; 19.8%). CV death comprised 18 cases of acute coronary syndrome, 16 cases of hemorrhagic stroke, 15 cases of heart failure, 13 cases of cardiac arrests/fatal arrhythmia, 13 cases of ischemic stroke, and 2 cases of PADs.
Eighty-eight patients within the cohort experienced major adverse cardiovascular events (MACEs). This set of MACEs encompassed 21 CV deaths, 16 cases of acute coronary syndrome, 9 cases of heart failure hospitalization, 21 cases of ischemic stroke, and 21 cases of hemorrhagic stroke.
When analyzed with the Kaplan‒Meier method, CV deaths and MACEs were significantly increased in the high Lp-PLA2 group compared with the low Lp-PLA2 group (CV death: P = 0.002; MACEs: P = 0.007). Whereas all-cause mortality was comparable between the two groups (P = 0.869), as depicted in Fig. 1. As illustrated in Fig. 2, when patients were stratified according to their LDL levels, no significant differences were observed in terms of all-cause mortality (P = 0.076), CV mortality (P = 0.264), or occurrence of MACEs (P = 0.324).
Fig. 1
Kaplan‒Meier curves of (A) all-cause mortality, (B) CV mortality and (C) MACEs stratified by low and high Lp-PLA2 groups
Fig. 2
Kaplan‒Meier curves of (A) all-cause mortality, (B) CV mortality and (C) MACEs stratified by low and high LDL-C groups
As illustrated in Fig. 3, subjects were classified into four groups based on the median values of both Lp-PLA2 and LDL-C. All-cause mortality was not significantly different across the four groups (P = 0.112). CV death and MACE occurrence were significantly different among the four groups (CV mortality, P < 0.001; MACE occurrence, P = 0.005). Specifically, the highest incidence of CV mortality was observed within the subset characterized by high Lp-PLA2 activity with low LDL-C levels (vs. Low Lp-PLA2 + Low LDL-C, P = 0.002; vs. Low Lp-PLA2 + High LDL-C, P = 0.002; vs. High Lp-PLA2 + High LDL-C, P = 0.04).
Fig. 3
Kaplan‒Meier curves of (A) all-cause mortality, (B) CV mortality and (C) MACEs stratified by medians of both Lp-PLA2 and LDL-C
With respect to the occurrence of MACEs, the subgroup featuring high Lp-PLA2 activity and low LDL-C levels demonstrated a significantly elevated incidence in comparison to both the subgroup with low Lp-PLA2 activity and low LDL-C levels (P = 0.021), as well as the subgroup with low Lp-PLA2 activity and high LDL-C levels (P = 0.010). In contrast, pairwise comparisons showed no significant between-group differences in terms of all-cause mortality.
The analysis further extends by stratifying subjects according to statin use. Among those not receiving statins, high Lp-PLA2 activity was associated with higher CV mortality (P = 0.006) and an increased MACE occurrence (P = 0.017). Intriguingly, this correlation was observed to be attenuated among those individuals under statin therapy (CV death: P = 0.101; MACE: P = 0.149), as illustrated in Figs. 4 and 5. When Lp-PLA2 and LDL-c were used in combination, the all-cause mortality, CV mortality and MACE occurrence were comparable across four strata among statin users. Pairwise comparisons showed no significant between-group differences in terms of all-cause mortality, CV mortality and MACE occurrences. In non-statin users, CV mortality and MACE occurrence were significantly different among the four strata (CV mortality, P = 0.002; MACE occurrence, P = 0.018), while all-cause mortality was comparable (P = 0.154). (Figures S1 & S2).
Fig. 4
Kaplan‒Meier curves of CV mortality stratified by low and high Lp-PLA2 groups in the setting of receiving statin therapy (A) or not (B)
Fig. 5
Kaplan‒Meier curves of MACEs stratified by low and high Lp-PLA2 groups in the setting of receiving statin therapy (A) or not (B)
Optimal Lp-PLA2 cut-off values for predicting outcomes were determined by maximally selected rank statistics. The cut-off for all-cause mortality, CV mortality and MACE were 358RU/mL, 444RU/mL and 450 RU/mL respectively.
Univariate Cox proportional hazard analyses were conducted to assess the individual associations between various variables and the outcomes, and hazard ratios (HRs) were calculated. As shown in Table 3, age(HR = 1.05, P < 0.001), AVF as vascular access(HR 0.48, P = 0.002), Lp-PLA2 > 481.2 U/L (HR 2.15, P = 0.002), Lp-PLA2 activity (HR 1.18, P = 0.004), N-terminal pro b-type natriuretic peptide (NT-proBNP) (HR 2.08, P = 0.001), high sensitivity cardiac troponin T (hs-cTnT) (HR 7.30, P < 0.001), albumin (HR 0.94, P = 0.043), Serum creatinine (HR 0.99, P < 0.001), Uric acid (HR 0.99, P = 0.009), history of diabetes (HR 2.23, P = 0.001), history of CAD (HR 2.81, P < 0.001) were significantly associated with CV death.
Table 3 Univariate Cox proportional hazard model of variables associated with CV death and MACE in the study populationAge (HR 1.06, P < 0.001), AVF as vascular access(HR = 0.41, P < 0.001), Lp-PLA2 > 481.2 U/L (HR 1.81, P = 0.007), Lp-PLA2 (HR = 1.41, P = 0.018), NT-proBNP (HR 1.87, P = 0.004), hs-cTnT (HR 6.52, P < 0.001), albumin (HR = 0.94, P = 0.046), Serum creatinine (HR 0.99, P = 0.001), Uric acid (HR 0.99, P = 0.01), history of diabetes (HR 2.02, P = 0.002), history of CAD (HR 2.57, P = 0.001) were significantly associated with MACEs (Table 3).
Seven multivariate Cox models were applied to examine the association of Lp-PLA2 with outcomes, each adjusting for baseline demographic data, primary comorbidities, key laboratory measures, lipid profiles, cardiac and inflammatory biomarkers, as well as medications. The final model included all the confounders with a p-value below 0.10 in the univariate Cox model, using both the 'enter' method and the 'stepwise' approach for adjustments. In all the analyzed models, whether Lp-PLA2 was treated as a categorical variable (stratified by median values) or as a continuous variable (measuring HR for every 100U/L increment), Lp-PLA2 consistently emerged as a significant risk factor for CV death and MACE occurrence. The results are detailed in Table 4. In summary, after comprehensive adjustment, Lp-PLA2 was significantly associated with CV death when assessed as a continuous variable (HR 1.25, 95%CI 1.10–1.41, P = 0.001) or dichotomous variable (HR 2.57, 95%CI 1.58–4.18, P < 0.001). Lp-PLA2 was also significantly associated with MACE either as a continuous variable (HR 1.20, 95%CI 1.07–1.36, P = 0.002) or dichotomous variable (HR 2.17 95%CI 1.39–3.40, P = 0.001). Restricted Cubic Splines (RCS) analyses suggested a non-linear relationship between Lp-PLA2 and both CV mortality and MACE occurrence. However, this association did not achieve statistical significance in all models. Upon visual examination, there was a discernible trend where HR consistently rose in tandem with increasing Lp-PLA2 until it reached a threshold of approximately 600–700 U/L. Beyond this threshold, the HR exhibited a trend for decline. This trend is graphically represented in the Figs. 6 and 7.
Table 4 Multivariate Cox models of CV death and MACE in MHD patientsFig.6
Association of Lp-PLA2 activity and cardiovascular mortality. Restricted cubic spline analyses to assess nonlinear association between Lp-PLA2 activity and cardiovascular mortality. Covariates for adjustment A. unadjusted B. age, dialysis vintage, sex, BMI, vascular access C. history of hypertension, diabetes, coronary artery disease and cerebrovascular event D. hemoglobin, creatine, uric acid, albumin E. HDL-c, LDL-c, triglyceride, apoB, apoA F. hs-cTnT, NT-proBNP, hs-CRP G. use of ACEI, ARB, statin, asprin, CCB, beta blocker H. age, dialysis vintage, vascular access, BMI, history of diabetes, coronary artery disease, albumin, hs-CRP, creatine, uric acid, hs-cTNT, NT-proBNP I. age, BMI, hs-cTnT, creatine, NT-proBNP
Fig.7
Association of Lp-PLA2 activity and MACEs. Restricted cubic spline analyses to assess nonlinear association between Lp-PLA2 activity and MACEs. Covariates for adjustment A. unadjusted B. age, dialysis vintage, sex, BMI, vascular access C. history of hypertension, diabetes, coronary artery disease and cerebrovascular event D. hemoglobin, creatine, uric acid, albumin E. HDL-c, LDL-c, triglyceride, apoB, apoA F. hs-cTnT, NT-proBNP, hs-CRP G. use of ACEI, ARB, statin, asprin, CCB, beta blocker H. age, dialysis vintage, vascular access, BMI, history of diabetes, coronary artery disease, albumin, hs-CRP, creatine, uric acid, hs-cTNT, NT-proBNP I. age, vascular access, history of diabetes, hs-cTnT
Results of subgroup and interaction analyses were detailed in Table 5 and Table 6. Notably, interaction tests across all covariates were consistently non-significant (P > 0.05), suggesting no evidence of modifying effects of the covariates on the association between Lp-PLA2 activity and both CV death and MACE occurrence.
Table 5 Interaction analyses of Lp-PLA2 activity with CV death and MACE occurrence across different subgroupsTable 6 Interaction analyses of Lp-PLA2 with Lipids measures in relation to CV death and MACE occurrenceIncremental prognostic value of Lp-PLA2 activityThe discriminative ability of models, both with and without Lp-PLA2 activity, was assessed using the C-index. Incorporating Lp-PLA2 activity into the comprehensively adjusted Cox model for CV mortality led to a marginal improvement in the C-index. Specifically, when Lp-PLA2 was treated as a categorical variable, the C-index rose from 0.752 (95% CI: 0.695–0.809) to 0.765 (95% CI: 0.704–0.826). Similarly, when Lp-PLA2 was considered as a continuous variable, the C-index was 0.766 (95% CI: 0.707–0.825). However, pairwise comparisons showed no significant differences between these models.
The results were similar in Cox model for MACE, including Lp-PLA2 raised the C-index from 0.745 (95% CI: 0.694–0.796), to 0.758 (95% CI: 0.705–0.811) as a categorical variable, and to 0.756 (95% CI: 0.703–0.809) as a continuous variable. Pairwise comparisons found no significant differences between the models.
NRI was assessed for Lp-PLA2 inclusion. As a continuous variable, the integration of Lp-PLA2 produced a significant NRI of 33.32% (95% CI: 7.47% to 56.21%) for CV mortality and 23.97% (95% CI: 0.28% to 46.24%) for MACE. As a categorical variable, it resulted in an NRI of 42.51% (95% CI: 5.0% to 61.33%) for CV mortality, but an inconclusive NRI of 33.0% (95% CI: -0.58% to 52.60%) for MACE.
Comments (0)