
記住我

We searched the compound dexamethasone by using the Pubchem database and entered it into PharmMapper (http://www.lilab-ecust.cn/pharmmapper/) and Super-PRED (https://prediction.charite.de/index.php?site=chemdoodle_search_target) platform to predict the corresponding targets, and the results showed that there were 457 corresponding targets for dexamethasone. With “Myasthenia gravis with thymoma” as the search term, relevant disease targets were searched using the Human Gene Database (GeneCards, https://genealacart.genecards.org/). The disease targets retrieved from the database were combined and deduplicated as the final source of disease targets. After deduplication, there were a total of 273 targets. The screened targets of dexamethasone and thymoma-associated myasthenia gravis were screened, and a total of 21 intersecting targets were finally obtained. (Fig. 2A).
Fig. 2
Mining of target genes. A Venn diagram showing the communicative targets of dexamethasone and thymoma-associated myasthenia gravis. B PPI protein interaction network diagram. C GO enrichment analysis results of disease and drug shared targets. D KEGG enrichment analysis results of disease and drug shared targets
PPI protein interaction network analysisAll the obtained intersection targets were entered into the STRING database (https://cn.string-db.org/), with Multiple proteins selected, the species limited to Homo Sapiens, and the PPI functional protein interaction network constructed. In order to screen core proteins, the generated TSV files were imported into Cytoscape 3.7.2 for topology analysis, and the top 5 degree values were selected as key targets. (Table 1) (Fig. 2B).
Table 1 Key target screening resultsGO-KEGG enrichment analysisThe shared targets of dexamethasone and thymoma-associated myasthenia gravis were imported into DAVID Bioinformatics Resources 6.8 (https://david.ncifcrf.gov/home.jsp) targets for GO enrichment analysis. The enrichment conditions were P value cutoff = 0.05 and Q value cutoff = 0.05. Our analysis found that a total of 231 GO entries were enriched. Among them, there were 18 cellular components (CC), which were mainly located in the plasma membrane, membrane rafts, receptors, endosomal membranes, exogenous components on the cytoplasmic side of the plasma membrane, glutamatergic synapses, extracellular space, and the external side of the plasma membrane, complex macromolecules, and lysosomes. There were 181 biological processes (BP), which mainly regulated and participated in the positive regulation of smooth muscle cell proliferation, positive regulation of nitric oxide biosynthesis, positive regulation of cell migration, protein autophosphorylation, positive regulation of MAP kinase activity, inflammation Response, positive regulation of transcription, DNA template, cellular response to reactive oxygen species, transmembrane receptor protein tyrosine kinase signaling pathway, peptidyl-tyrosine phosphorylation regulation, and other processes. There were 32 molecular functions (MF), which mainly were embodied in ATPase binding, the same protein binding, protein serine/threonine/tyrosine kinase activity, transmembrane receptor protein tyrosine kinase activity, RNA polymerization enzyme II transcription factor activity, ligand-activated sequence-specific DNA binding, nitric oxide synthase modulator activity, enzyme binding, phospholipase activation, and protein kinase binding regulation. Selecting the top 10 enriched items by P value, the results were visualized according to the P value, Q value, and the number of genes enriched on each item, as shown in Fig. 2C.
KEGG pathway enrichment analysis showed that a total of 73 signaling pathways were enriched. The top 20 enriched entries with P value were selected for visual analysis of the results. These pathways mainly involved endocrine resistance, cancer pathways, chemical oncogenic-receptor activation, HIF-1 signaling pathway, estrogen signaling pathway, PD-L1 expression in cancer and PD-1 checkpoint pathway, relaxin pubis signaling pathway, the prolactin signaling pathway, and PI3K-AKT and other signaling pathways, and the results are shown in Fig. 2D.
Co-expression gene verificationWe selected the dataset GSE57892 from the GEO database for WGCNA analysis, drew a heat map of the module-trait relationship to evaluate the relationship between modules according to the Spearman correlation coefficient (Fig. 3A), and verified the hub gene in thymoma. According to the variance results of thymoma gene expression, the top 15% genes with larger variance were selected for co-expression analysis. A co-expression network consisting of 3211 genes was constructed. A soft threshold of 10 was chosen, and a total of 15 co-expression modules were identified. We found that AKT1 was enriched in the MEpurple module and was highly associated with type B3 thymomas (Fig. 3B).
Fig. 3
Identification of modules linked to clinical features of thymoma. A Cluster dendrogram of co-expressed genes in thymoma. B Heat map of module–trait relationships in thymoma
Molecular docking model validationIn order to clarify the binding activity between the core target protein of the disease and the active ingredient of dexamethasone, with dexamethasone used as the ligand, and the core targets AKT1, MMP9, STAT3, SRC, and EGFR used as receptors, AutoDock Vina software was used to prepare the ligands and proteins required for molecular docking, and Vina inside the pyrx software was used for docking verification. The affinity value (kcal/mol) represented the binding capacity of the two. The lower the binding capacity, the more stable the ligand-receptor binding. The binding energy predictions of the obtained five key targets and dexamethasone are shown in Table 2.
Table 2 Ingredient and target binding energyThe results showed that the docking energy values of AKT1, MMP9, STAT3, SRC, and EGFR were all less than − 7.0 kcal/mol, indicating that they had strong binding activity, suggesting that it was predicted that dexamethasone could have the treatment of thymoma-associated myasthenia gravis via AKT1, MMP9, STAT3, SRC, EGFR, and other targets. The docking results showed that it had good binding activity, which preliminarily verified the results of network pharmacology mining. Pymol software was conducted to visualize the docking results (Fig. 4). Based on the binding mode of molecular docking of AKT1 and ligand, AKT1 formed salt bridge interaction and Pi-alkyl hydrophobic interaction with TYR272 of the target protein of ligand and formed hydrogen bond interaction with GLU17. The docking results showed that the docking binding energy of RR1 and ligand was − 9.8 kcal/mol. Based on the binding mode of molecular docking between EGFR and ligand, EGFR formed hydrogen bond interaction with GLU1004 of the target protein of ligand and formed alkyl hydrophobic interaction with PRO741, PRO794 and LEU792. The docking results showed that the docking binding energy of EGFR and ligand was − 7.8 kcal/mol. Based on the binding mode of molecular docking MMP9 and ligand, MMP9 formed salt bridge and hydrogen bond interaction with GLU427 of the target protein of ligand, formed Pi-alkyl hydrophobic interaction with PHE396, and formed alkyl hydrophobic interaction with PHE396 and LEU212. The docking results showed that the docking binding energy of MMP9 and ligand was -8.5 kcal/mol. Based on the binding mode of molecular docking SRC and ligand, SRC formed hydrogen bond interactions with ASP404, GLY406, and PHE405 of the target proteins of ligand and formed alkyl hydrophobic interactions with LEU393, ALA403, VAL281, and LYS295. The docking results show that the docking binding energy of SRC and ligand is − 8 kcal/mol. Based on the binding mode of molecular docking between STAT3 and ligand, STAT3 formed hydrogen bond interactions with GLY253 and ASP334 of ligand target proteins and formed alkyl hydrophobic interactions with ALA250, CYS251, and ILE258. The docking results showed that the docking binding energy of STAT3 and ligand was − 8.3 kcal/mol.
Fig. 4
Visual analysis of molecular docking between active components of dexamethasone and core targets of thymoma-associated myasthenia gravis
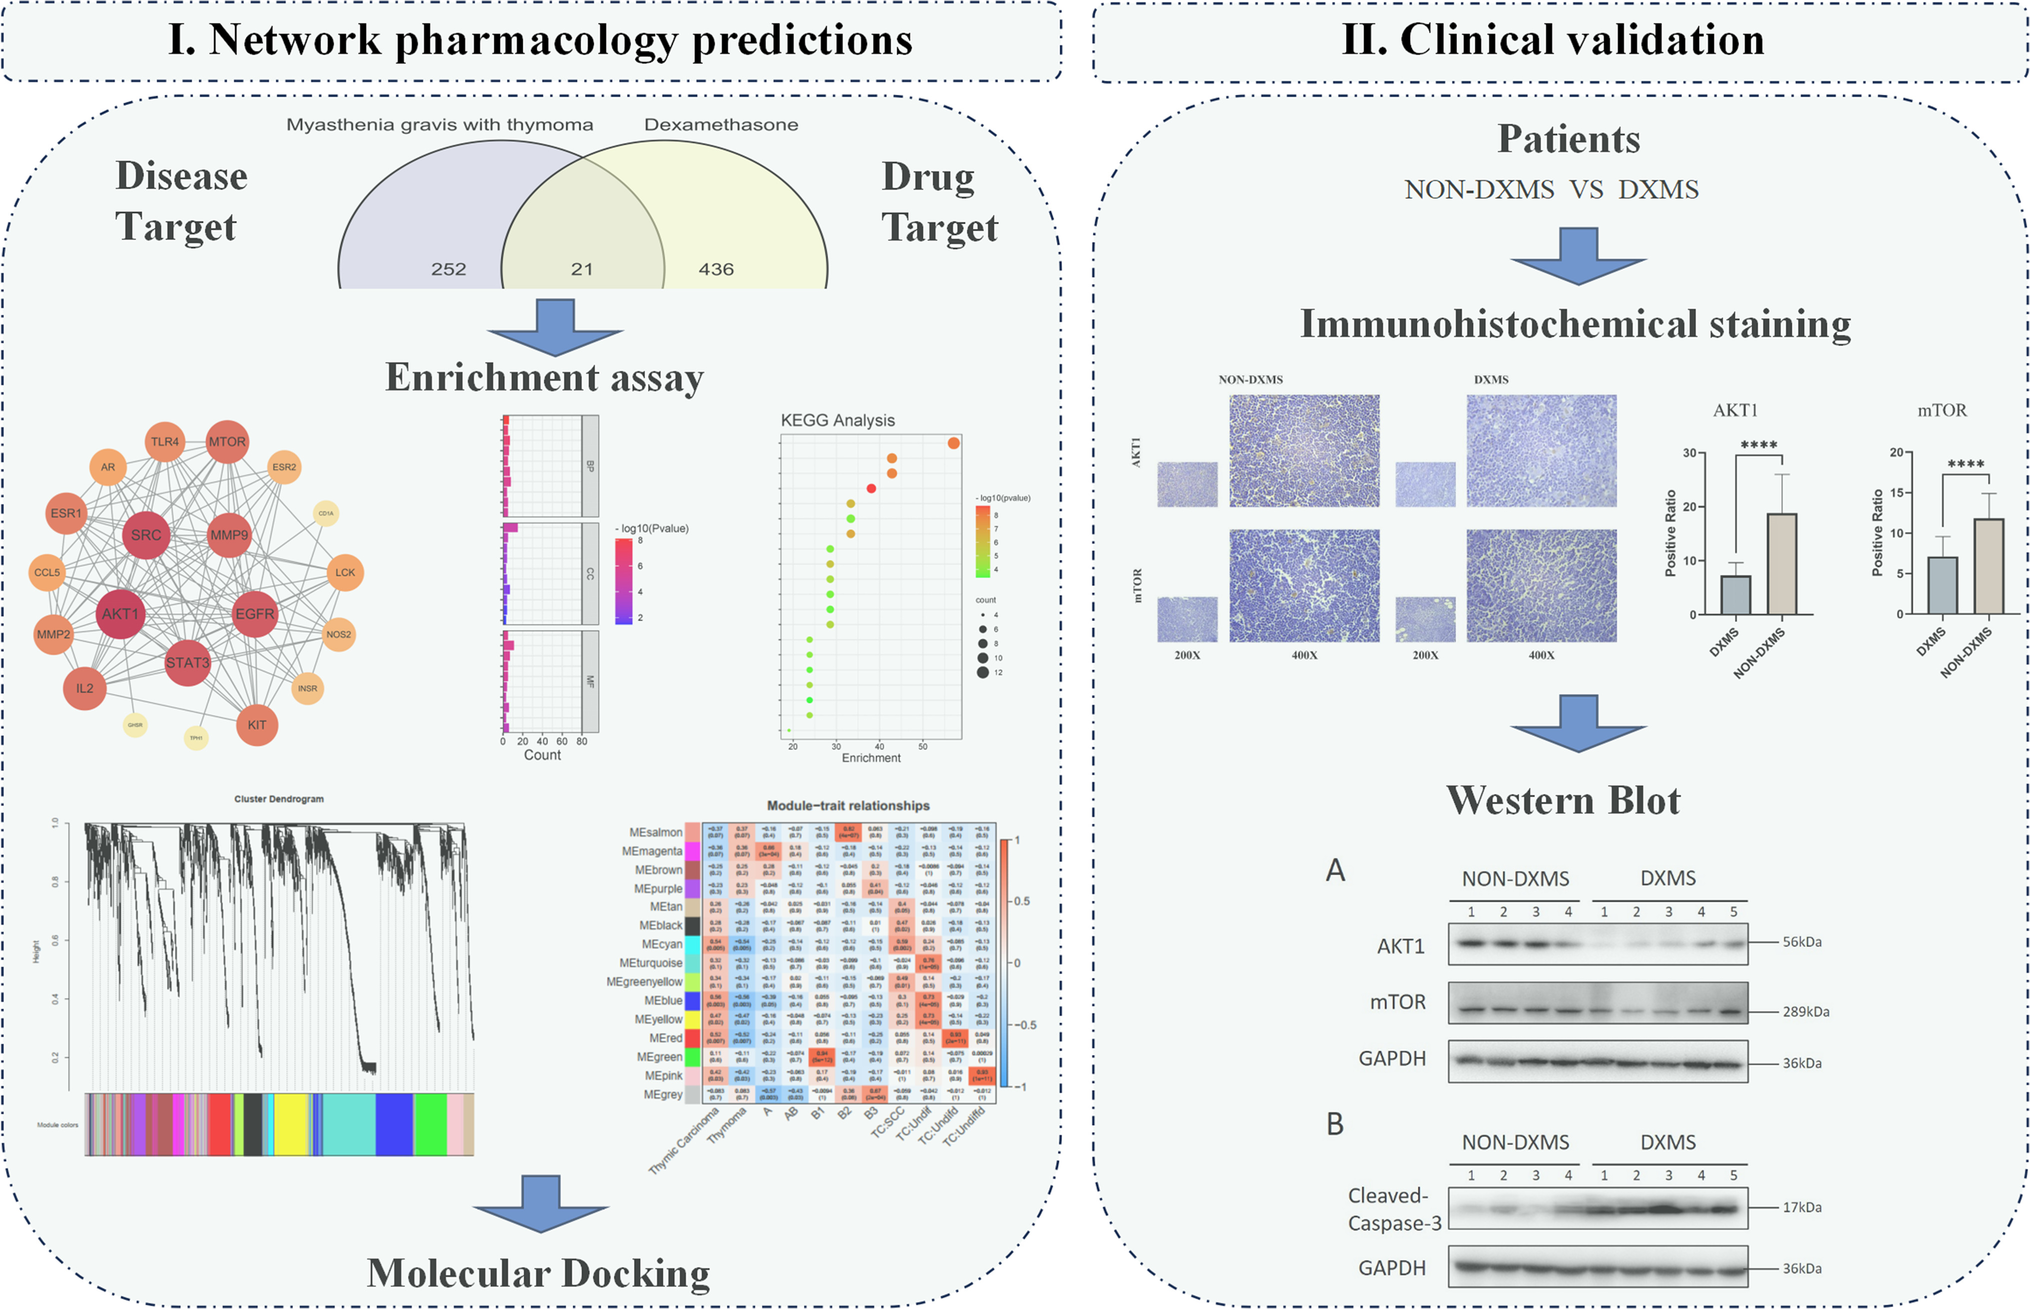
Preliminary research on the results of pathway verificationWe systematically and retrospectively analyzed 12 patients who were diagnosed with thymoma-associated MG in the Department of Cardiothoracic Surgery of Tianjin Medical University General Hospital and had undergone surgical resection of thymoma. They were divided into 2 groups according to whether dexamethasone was used before surgery. The clinical information of the enrolled patients is shown in Supplementary Table 1. The thymoma tissues of the enrolled patients were selected to verify the expression of AKT1 and mTOR.
Statistics showed that the expressions of AKT1 and mTOR in the thymoma TME of the dexamethasone-treated group were lower than those of the non-dexamethasone-treated group (Figs. 5 and 6).
Fig. 5
Expression of AKT and mTOR in the thymoma TME. NON-DXMS, non-dexamethasone treatment group. DXMS, dexamethasone treatment group
Fig. 6
Statistical results of AKT1 and mTOR expression in thymoma tissue. Each tissue section was randomly taken with 5 fields of view, and the positive ratio was analyzed using ImageJ. Data are presented as mean ± SD (5 fields per sample, nDXMS = 4, nNON-DXMS = 8) of the representative data from three independent experiments (****P < 0.001)
Then we detected the level of AKT1 apoptosis pathway-related proteins in tissues by Western Blot (Fig. 7). The results showed that the level of AKT1 and mTOR protein in all 5 thymoma patients who received DXMS treatment was lower than that in the non-DXMS group (Fig. 7A), while the level of apoptosis protein, cleaved caspase-3, showed the opposite trend (Fig. 7B).
Fig. 7
Western blot analysis results
Western blot analysis was used to evaluate the protein expression level of the AKT1, mTOR, and cleaved-caspase-3 in the DXMS group and the NON-DXMS group. The western blot results of all the enrolled patients are shown in the figure.
留言 (0)