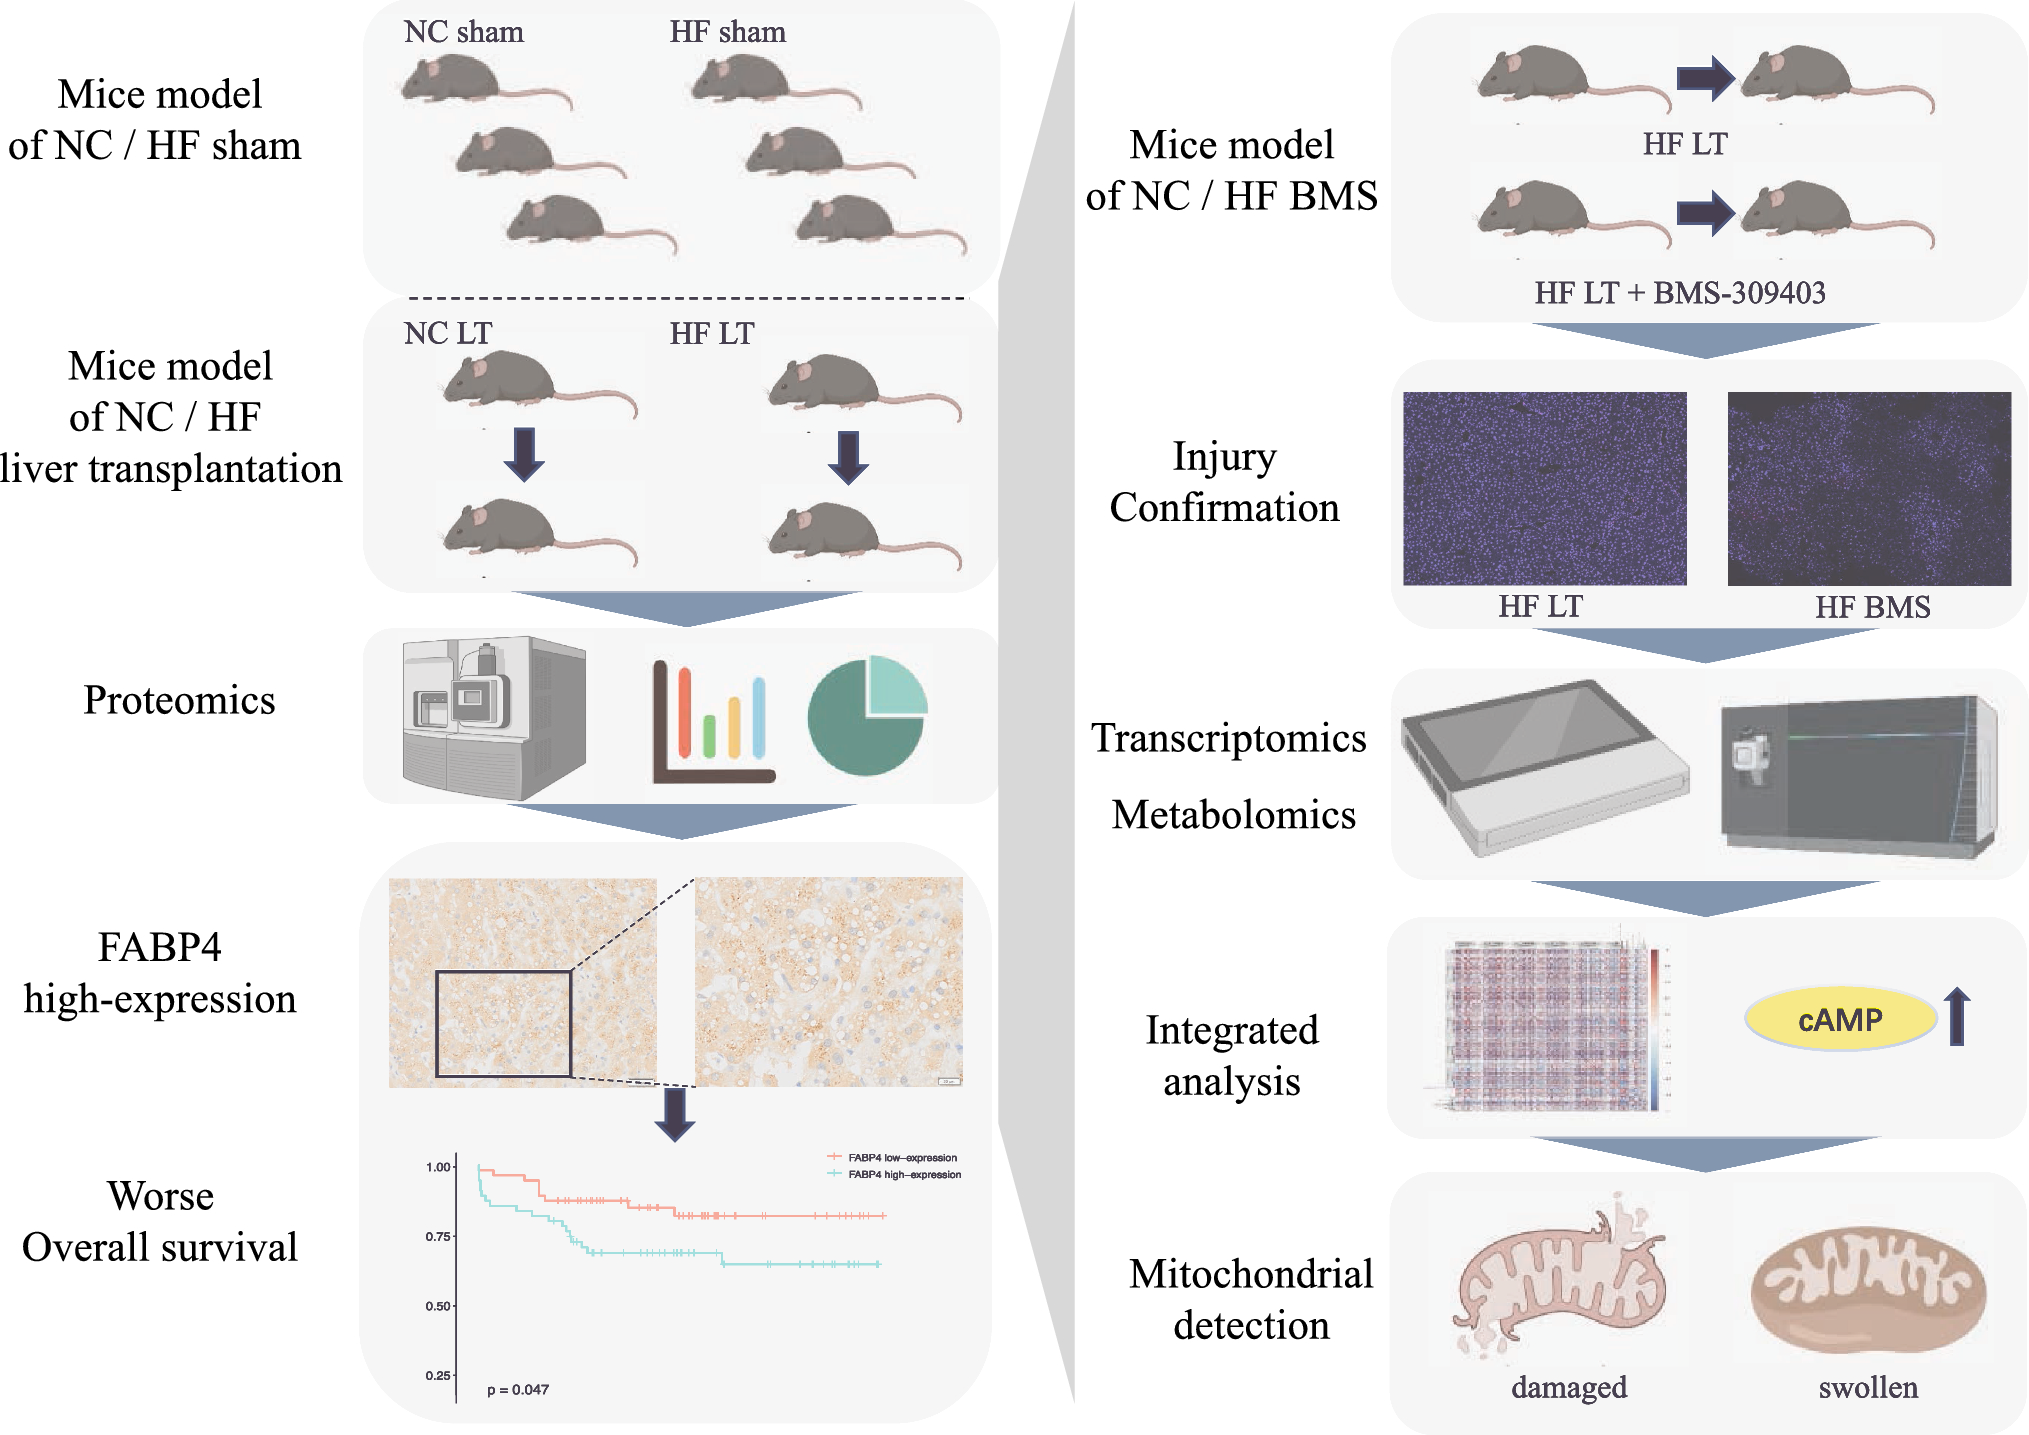
Cell culture
MeT-5A cells purchased from ATCC were maintained in Medium 199 media (HiMedia; AL014A) along with 10% fetal bovine serum (Gibco; 10,270), SKOV-3 cells were maintained in McCoy’s 5A media (HiMedia; AL057A) along with 10% fetal bovine serum (Gibco; 10,270), and OVCAR-3 cells were maintained in RPMI-1640 media (HiMedia; AL162A) along with 20% fetal bovine serum (Gibco; 10,270) in a 5% carbon dioxide, 37° C temperature humidified incubator.
Senescence induction
Non-senescent MeT-5A cells were seeded in 60 mm dishes from an early passage of healthy MeT-5A cells growing and allowed to adhere for 18 h. Then they were treated with 100 nM of doxorubicin (Cayman chemicals; 15,007) for 48 h [46, 47]. The control sample was added with a proportionate volume of DMSO to negate the effect of solvent on MeT-5A cells present in the treated samples. The control and treated samples were cultured in drug-free media for 24 h and then checked for senescence [47].
BALB/c female mice (4–6 weeks old) were sacrificed for ex-vivo adhesion experiments. Mice were euthanized by cervical dislocation and confirmed dead by cessation of respiration. The peritoneal membrane was surgically dissected and cut into two parts and cultured in Medium 199 media (HiMedia; AL014A) along with 10% fetal bovine serum (Gibco; 10,270) with and without 100 nM of doxorubicin to generate senescent and non-senescent murine peritonea, respectively. GFP-expressing SKOV-3 were suspended on top of the murine peritonea and were allowed to adhere for 30 min. The murine peritonea were washed with 1 × PBS and imaged by using an Olympus IX83 inverted epifluorescence microscope at 10X and 4X magnification. The images were analyzed and the number of cells adhered to the matrices was counted using the “analyze particles” feature in ImageJ. Murine cells were isolated from senescent and non-senescent peritonea by incubating them in 0.25% trypsin solution for 8 min, followed by streaking over the tissue with a tip to dislodge the cells from the tissue. Extracted cells were allowed to adhere for 48 h and used for morphological examination for senescence.
Cell staining
MeT-5A cells were directly seeded in an eight-well chambered cover glass for staining the DNA and F-actin. Monolayers of senescent and non-senescent MeT-5A cells were fixed using 4% formaldehyde (24,005; Thermo Fisher Scientific) at 4 °C for 20 min. After fixation, the cells were taken for further processing or stored in 1 × PBS at 4 °C. Permeabilization was achieved using 0.5% Triton X-100 (MB031; HiMedia) for 90 min at RT. Alexa Fluor 488 Phalloidin (Invitrogen; A12379) dissolved in 0.1% Triton X-100 was incubated overnight at 4 °C in dark. This was followed by washes using 0.1% Triton X-100 in PBS (5 min × 3). Samples were incubated with DAPI (D1306; Thermo Fisher Scientific) dissolved in 0.1% Triton X-100 for 10 min in dark at RT. Subsequent processing was carried out in the dark. These included washes using 0.1% Triton X-100 in PBS (5 min × 2). The images were captured at 10 × magnification using an Olympus IX83 inverted epifluorescence microscope and an Olympus IX83 inverted fluorescence microscope fitted with Aurox structured illumination spinning disk setup. Images were processed and analyzed using ImageJ.
Cytochemical detection of SA-β-Gal
MeT-5A cells were fixed with 0.2% glutaraldehyde in PBS for 15 min at room temperature (RT). The cells were washed twice with PBS and incubated overnight in fresh SA-β-gal staining solution containing 1 mg/ml X-Gal, 5 mM potassium ferrocyanide, 5 mM potassium ferricyanide, 150 mM NaCl, 2 mM MgCl2, and 0.1 m phosphate buffer, pH 6.0 in darkness at 37° C without CO2 [48]. Upon development of the bluish-green stain post-incubation period, images were visualized using a phase-contrast microscope and captured on a Magcam DC camera using MagVision software. Quantitative analysis was performed on the images using ImageJ.
Mesothelial clearance assay
Non-senescent and senescent RFP-expressing MeT-5A cells were trypsinized and seeded (40,000 in number) in eight well-chambered cover glasses. Sub-confluent monolayers were allowed to form for the next 24 h and GFP-expressing SKOV-3 cells were added to the non-senescent and senescent monolayers. The assay was performed with Medium 199 media (HiMedia, AL014A) along with 10% fetal bovine serum (Gibco, 10,270). Time-lapse imaging was subsequently performed for 72 h right after the addition of SKOV-3 cells at 30 min intervals using a Tokai Hit stage-top incubator with image acquisition through an Orca Flash LT plus camera (Hamamatsu) on an Olympus IX73 microscope. The videos were stitched using ImageJ and the same was used to calculate the change in the area of MeT-5A monolayers and SKOV-3 cells in the same fields (shown in figure S11).
Quantitative real-time PCR
Quantitative real-time PCR was performed for common matrisomal genes, where GAPDH was used as an internal control for the normalization of RT qPCR data. Total RNA was isolated using RNAiso Plus from MeT-5A monolayers, after which 1 μg of total RNA was reverse transcribed to cDNA using Verso cDNA Synthesis kit as per the manufacturer’s protocol (AB-1453; Thermo Fisher Scientific). Real-time qPCR was performed on QIAGEN Rotor-Gene Q System (QIAGEN) using a standard two-step amplification protocol followed by a melting curve analysis. The amplification reaction mixture (total volume of 10 μL) contained 10 ng of cDNA, 5 μL 2 × DyNAmo Flash SYBER Green master mix, and 0.25 μM of the appropriate forward and reverse primer. Primer sequences of GAPDH and matrisomal genes are mentioned in the Table S1. Relative gene expression was calculated using the comparative Ct method, and gene expression was normalized to non-senescent MeT-5A cells. Appropriate no template and no RT controls were included in each experiment. All the samples were analyzed in triplicates and repeated at least three times independently.
Immunostaining and image acquisition
MeT-5A cells were directly seeded in an eight-well chambered cover glass for immunostaining. Non-senescent and senescent MeT-5A cells were fixed using 4% formaldehyde (24,005; Thermo Fisher Scientific) at 4 °C for 20 min. After fixation, the cells were taken for further processing or stored in 1 × PBS at 4 °C. Permeabilization was achieved using 0.5% Triton X-100 (MB031; HiMedia) for 90 min at RT. Blocking was achieved using PBS with 0.1% Triton X-100 and BSA (MB083; HiMedia) for 45 min at RT. Primary antibody incubation was carried out overnight at 4 °C. This was followed by washes using 0.1% TritonX-100 in PBS (5 min × 3). Secondary antibodies and Alexa Fluor 488/568 phalloidin (Invitrogen; A12379; A12380) were incubated with the sample at RT for 2 h under dark conditions. DAPI (D1306; Thermo Fisher Scientific) was added to the samples and washed away after 15 min. Subsequent processing was carried out in the dark. These included washes using 0.1% Triton X-100 in PBS (5 min × 3). Images were captured at 10 × magnification using an Olympus IX83 inverted epifluorescence microscope. Images were processed and analyzed using ImageJ. The antibodies used in our studies are against pan-Laminin (ab11575) and fibronectin (E5H6X). Negative controls in each case were through the omission of the primary antibody.
Alcian blue staining
MeT-5A cells were directly seeded in an eight-well chambered cover glass for alcian blue staining. Non-senescent and senescent MeT-5A cells were fixed using 4% formaldehyde (24,005; Thermo Fisher Scientific) at 4 °C for 20 min. After fixation, the cells were washed three times with 1 × PBS and then taken for further processing or stored at 4 °C. While staining for Hyaluronic acid and acid mucins, the MeT-5A monolayers were incubated with 3% acetic acid solution for three minutes and then with the alcian blue solution (1% w/V alcian blue, 8GX (HiMedia, TC359-10G) in 3% acetic acid solution at 2.5 pH) for 30 min at 37 °C. Perform three 1 × PBS washes for 5 min each. Upon development of the bluish-green stain, images were visualized using a phase-contrast microscope and captured on a Magcam DC camera using MagVision software. Quantitative analysis was performed on the images using ImageJ.
Conditioned media treatment
The seeded non-senescent MeT-5A cells were made senescent by incubation with 100 nM of doxorubicin (Cayman chemicals; 15,007) for 48 h. The media along with the remaining doxorubicin was removed and the senescent monolayer was washed with 1 × PBS. Senescent monolayers were incubated with doxorubicin-depleted media for another 24 h and the conditioned media (CM) was collected. Non-senescent MeT-5A monolayers were also incubated with media for 24 h and the CM was collected. A 1:1 mixture of CM from senescent/non-senescent MeT-5A and Medium 199 media (HiMedia; AL014A) along with 10% fetal bovine serum (Gibco; 10,270) were used for conditioned media growth assay with SKOV-3 cancer cells.
Senescent and non-senescent matrix preparation
Senescent and non-senescent MeT-5A cells were seeded at high confluency on chamber wells with coverslip bottoms. The cells were allowed to adhere and lay down the extracellular matrix for the next 36 h. The confluent MeT-5A monolayers were then washed with 1 × PBS twice and decellularized using a 20 mM solution of NH4OH in Milli-Q water for 7–10 min [49]. The cellular debris was gently removed by giving 2–3 washes with Milli-Q water. The extracted extracellular matrices laid on the chamber wells were used for adhesion assays.
Adhesion assay with RGD peptide
The SKOV-3 cells (5000 in number) suspended in Mcoy’s 5A media (HiMedia; AL057A) along with 10% fetal bovine serum (Gibco; 10,270) were added to the decellularized senescent and non-senescent matrices and allowed to adhere on the matrix for 25 min. For adhesion assay with RGD peptide, the media also had cyclic RGD peptide (Sigma; G1269-1MG) at 10 and 20 μg/mL concentrations. After incubation, the wells were washed with 1 × PBS twice and immediately imaged by using an Olympus IX83 inverted epifluorescence microscope at 10 × magnification. The images were analyzed and the number of cells adhered to the matrices was counted using the “analyze particles” feature in ImageJ. The attached cells were also time-lapsed for 24 h using a Tokai Hit stage-top incubator with image acquisition through an Orca Flash LT plus camera (Hamamatsu) on an Olympus IX73 microscope. The data were analyzed using a manual tracking plugin in FIJI and Ibidi’s chemotaxis and migration tool to see differences in displacement and velocity of SKOV-3 cells on senescent and non-senescent matrices (can be seen in videos S8 and S9).
Compucell 3D model for the clearance of senescent mesothelia
Compucell3D (CC3D) is based on the Cellular Potts Model (CPM), also known as the Glazier-Graner-Hogeweg (GGH) model. It has been utilized extensively for computational models of the collective behavior of cellular structures. The CPM is a lattice-based discrete model in which spatiotemporal development is simulated via an energy minimizing procedure [34, 50]. Each cell consists of a collection of lattice sites (pixels). Each configuration is associated with an effective energy, or Hamiltonian (H), which is calculated based on properties such as volume, surface area, contact energies, or external properties. Time evolution is simulated via Monte Carlo Steps (MCS) that involve random changes of lattice site occupations and the changes that decrease the energy are more likely than those that increase it. The Hamiltonian of the system is formulated as:
$$H=\sum_J\left(\tau \left(_\right),\left(_\right)\right)\left(1 - \delta \left(_,_\right)\right)+\lambda \sum__}_\right) -V(_))}^$$
where \(i,j\) are lattice sites, \(_\) is the cell at site i, \(\tau \left(\sigma \right)\) is the cell type of cell \(\sigma\), J is the coefficient determining the adhesion between two cells of types \(\tau \left(\sigma \right)\), \(\tau \left(\sigma \right)\), \(\delta\) is the Kronecker delta, v(\(\sigma\)) is the volume of cell \(\sigma\), V(\(\sigma\)) is the target volume, and \(\lambda\) is a Lagrange multiplier determining the strength of the volume constraint. We utilized a simple two-dimensional model 140*140*1 using a square pixel lattice to find and understand the effect of factors sufficient to bring a considerable decline in the senescent mesothelia area as observed in the mesothelial clearance experiments that were recorded using time-lapse epifluorescence videography. The simulation time was set to 8000 MCS as per the corresponding normalized length of the experimental time-lapse videos. The lattice is composed of the medium, senescent cells (SEN), non-senescent cells (NON_SEN), ovarian cancer cells (CANCER), and a frozen wall that mimics a closed system such as enclosed peritoneal cavity (shown in figure S12). This simple model has four variations with the contact energies between cancer and senescent cells to be either 15 (greater adhesion) or 30 (same as other contact energy combinations) and activation or deactivation of the active extrusion rule (shown in figure S13). The other important parameters used in the model and their input values are available at Table S2. To compare the simulation time to the timescale of senescent mesothelial clearance by ovarian cancer cells, a calibration was performed. The division time of ovarian cancer cells in experiments (SKOV-3 cells) was 18 h and the division time of ovarian cancer cells in simulations was 750 MCS. This factor was used to calibrate the simulations time to real-time and the comparison between the computational model and senescent mesothelial clearance experiments was made.
Statistical analysis
The experiments were repeated at least three times and unpaired parametric t-test with Welch’s correction were used for statistical testing unless otherwise stated in the figure legends. The graphs were plotted using GraphPad Prism 8.0.2 and p-values < 0.05 was considered statistically significant.

留言 (0)