
記住我
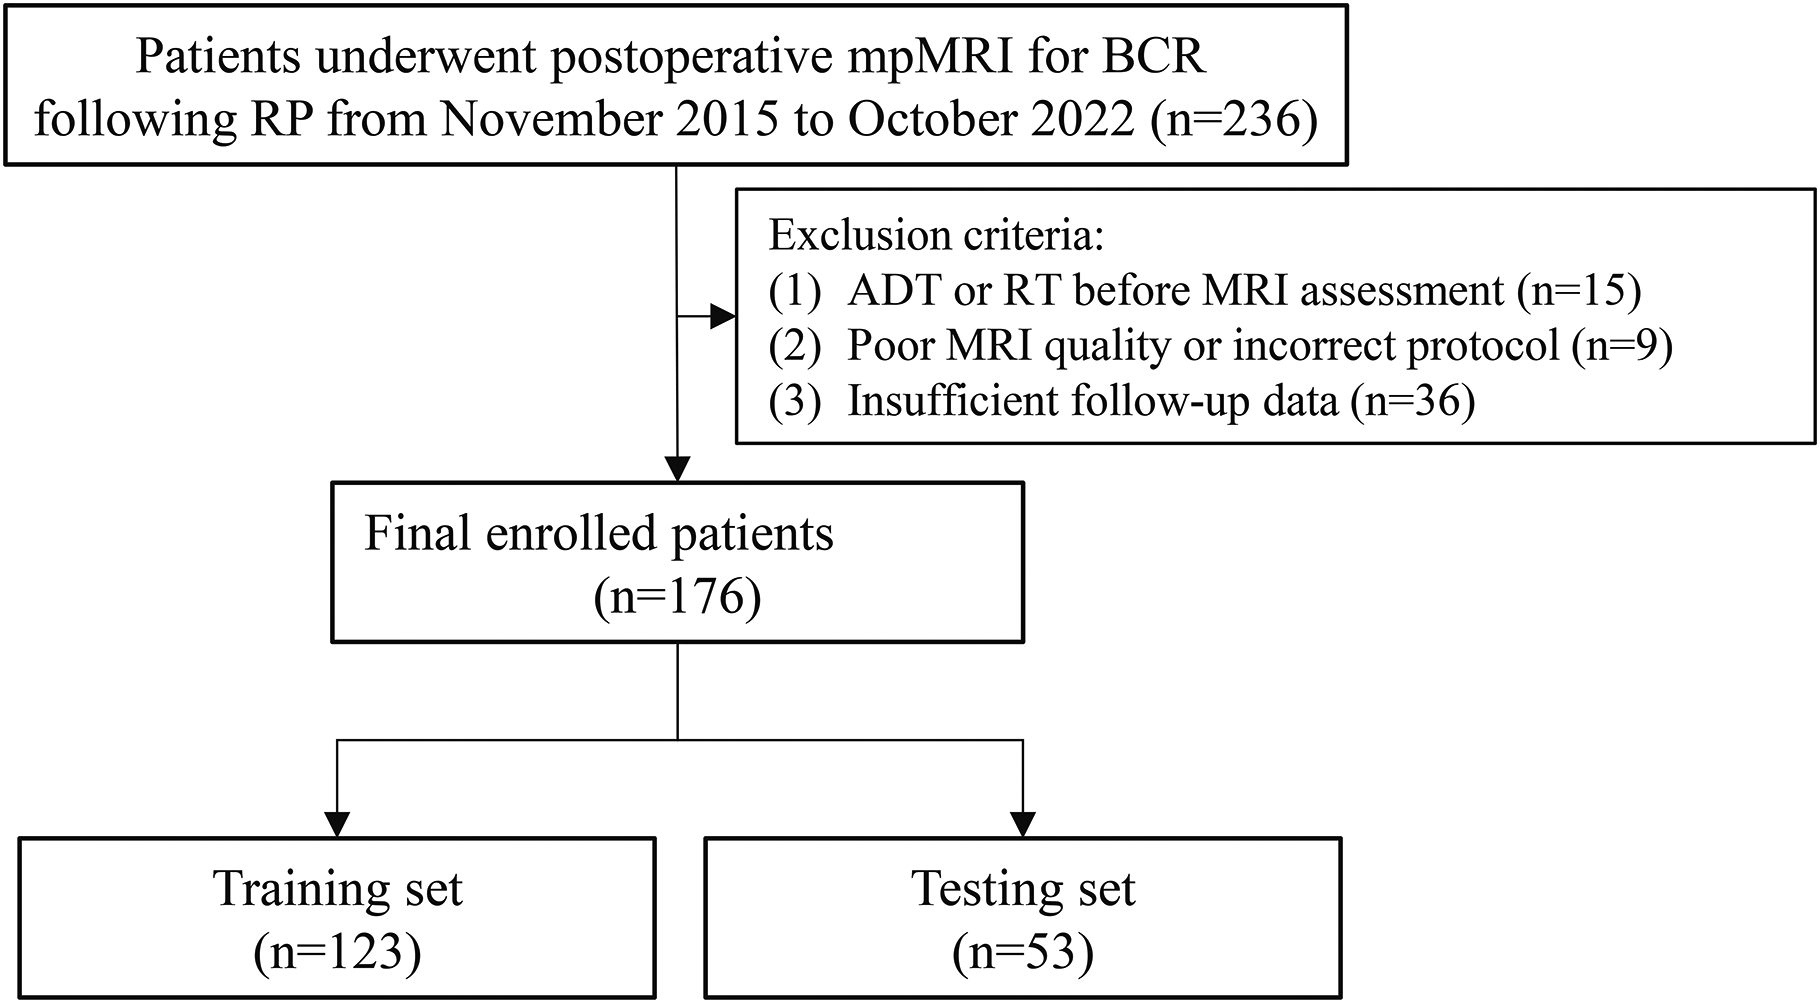


The present study was approved by the local institutional review boards. Written informed consent was obtained from all patients before participation. Sixty-seven consecutive patients with suspected meningiomas in our hospital from November 2017 to August 2018 were prospectively included according to the following inclusion criteria: (I) performed preoperative brain MRI including multiple-b-value DWI; (II) received surgical removal in our hospital; (III) surgical pathology confirmed meningioma based on the 2016 WHO classification [1]; (IV) assessed the tumour consistency by a unified standard. The exclusion criteria were as follows: (I) patients had undergone radiotherapy, chemotherapy, or surgery; and (II) insufficient quality of images. Finally, 52 patients pathologically confirmed as meningiomas were included in the studies. Of these, 2 patients were excluded due to a history of cranial radiotherapy, and 3 patients were excluded because of severe motion artefacts. The final cohort consisted of 47 patients. The patient flowchart is shown in Fig. 1.
Fig. 1
Patient enrolment flowchart
Intraoperative assessment of tumour consistencyThe assessment was conducted by two senior neurosurgeons (with 15 and 10 years of experience, respectively) who performed the surgical resection together. Tumour consistency was evaluated according to Zada’s consistency grading system [26]. Both neurosurgeons agreed on the final grade of each tumour. Soft meningiomas were defined as those amenable to be removed totally or mainly with suction, which corresponded to Grade 1 and Grade 2 of Zada’s consistency grading system. Hard meningiomas were defined as those that required sharp resection, ultrasonic aspiration or with calcification the within tumour, which corresponded to Grade 3, Grade 4 ad Grade 5 of Zada’s consistency grading system [27].
Image acquisitionMRI was performed using a 3 T MRI system (Discovery 750, GE Healthcare, Milwaukee, Wis, USA) equipped with an eight-channel receiver head coil. Conventional non-enhanced MRI sequences, multiple-b-value DWI, and contrast-enhanced T1-weigted imaging were performed in sequence. The total scan duration was 15 min 41 s.
Conventional non-enhanced MRI sequences included axial T1-weighted fluid attenuated inversion recovery (FLAIR) images (repetition time [TR] = 1,750 ms, echo time [TE] = 23 ms, section thickness = 5 mm, intersection gap = 1.5 mm, field of view [FOV] = 24 cm, matrix = 320 × 320); axial T2-weighted FSE images (TR = 6,488 ms, TE = 94 ms, section thickness = 5 mm, intersection gap = 1.5 mm, matrix = 512 × 512, FOV = 24 cm); axial T2-weighted FLAIR images (TR = 8,500 ms, TE = 143 ms, section thickness = 5 mm, intersection gap = 1.5 mm, matrix = 288 × 224, FOV = 24 cm).
DWI used a spin echo (SE)-echo planar imaging (EPI) diffusion sequence in the axial plane (TR = 5,000, TE = 84.6ms, section thickness = 5 mm, intersection gap = 0 mm, FOV = 24 cm, matrix = 192 × 192, number of sections = 30. Twelve b-values from 0 to 3,000 s/mm2 (0, 50, 100, 150, 200, 300, 500, 800, 1,000, 1,500, 2,000, and 3,000 s/mm2; with number of excitations [NEX] = 1 for b = 0-500 s/mm2, two NEX for b = 800-1,000 s/mm2, three NEX for b = 1,500 s/mm2, four NEX for b = 2000 s/mm2, and six NEX for b = 3000 s/mm2 [22].
A contrast-enhanced three-dimensional (3D) axial T1-weighted fast spoiled gradient echo (FSPGR) was served as anatomical reference for DWI (TR = 8.2, TE = 3.2ms, section thickness = 1 mm, matrix = 256 × 256, FOV = 24 cm, inversion = 450ms, flip angle = 12°. Post-contrast images were obtained after administration of intravenous contrast material (0.1 mmol/kg, gadopentetate dimeglumine, Bayer Schering, Berlin, Germany) at a speed of 2 ml/s.
MR image processing and histogram analysisThe obtained DWI data were transferred to a workstation (Advantage Workstation 4.6; GE Medical Systems) for further postprocessing. Parameter maps were generated through the MADC program in Functool software for each model.
The mono-exponential model was calculated with the following equation:
S(b)/S0 = exp (-b × ADC).
where S(b) is the mean signal intensity with diffusion gradient b, and S0 is the mean signal intensity without diffusion gradient [8]. In the present study, ADC was calculated from the mono-exponential model with two b-values (0, 1000 s/mm2).
The bi-exponential model was calculated with the following equation:
S(b)/S0 = [f × exp (-b × D*)] + [(1-f) ×exp (-b × D)]
where D is the pure molecular diffusion. D* is the pseudo-diffusion coefficient, and f is the microvascular volume fraction which represents the fraction of water diffusion relative to microcirculation [16].
The stretched-exponential model was calculated with the following equation:
S(b)/S0 = [exp (-b × DDC) alpha]
where DDC is the distributed diffusion coefficient which reflects the mean intravoxel diffusion rate, and alpha indicates intravoxel diffusion heterogeneity ranging from 0 to 1 [18].
MEM data were linearly fitted with the least square method. BEM and SEM data were fitted by the LevenbergeMarquardt fit for non-linear fitting [28].
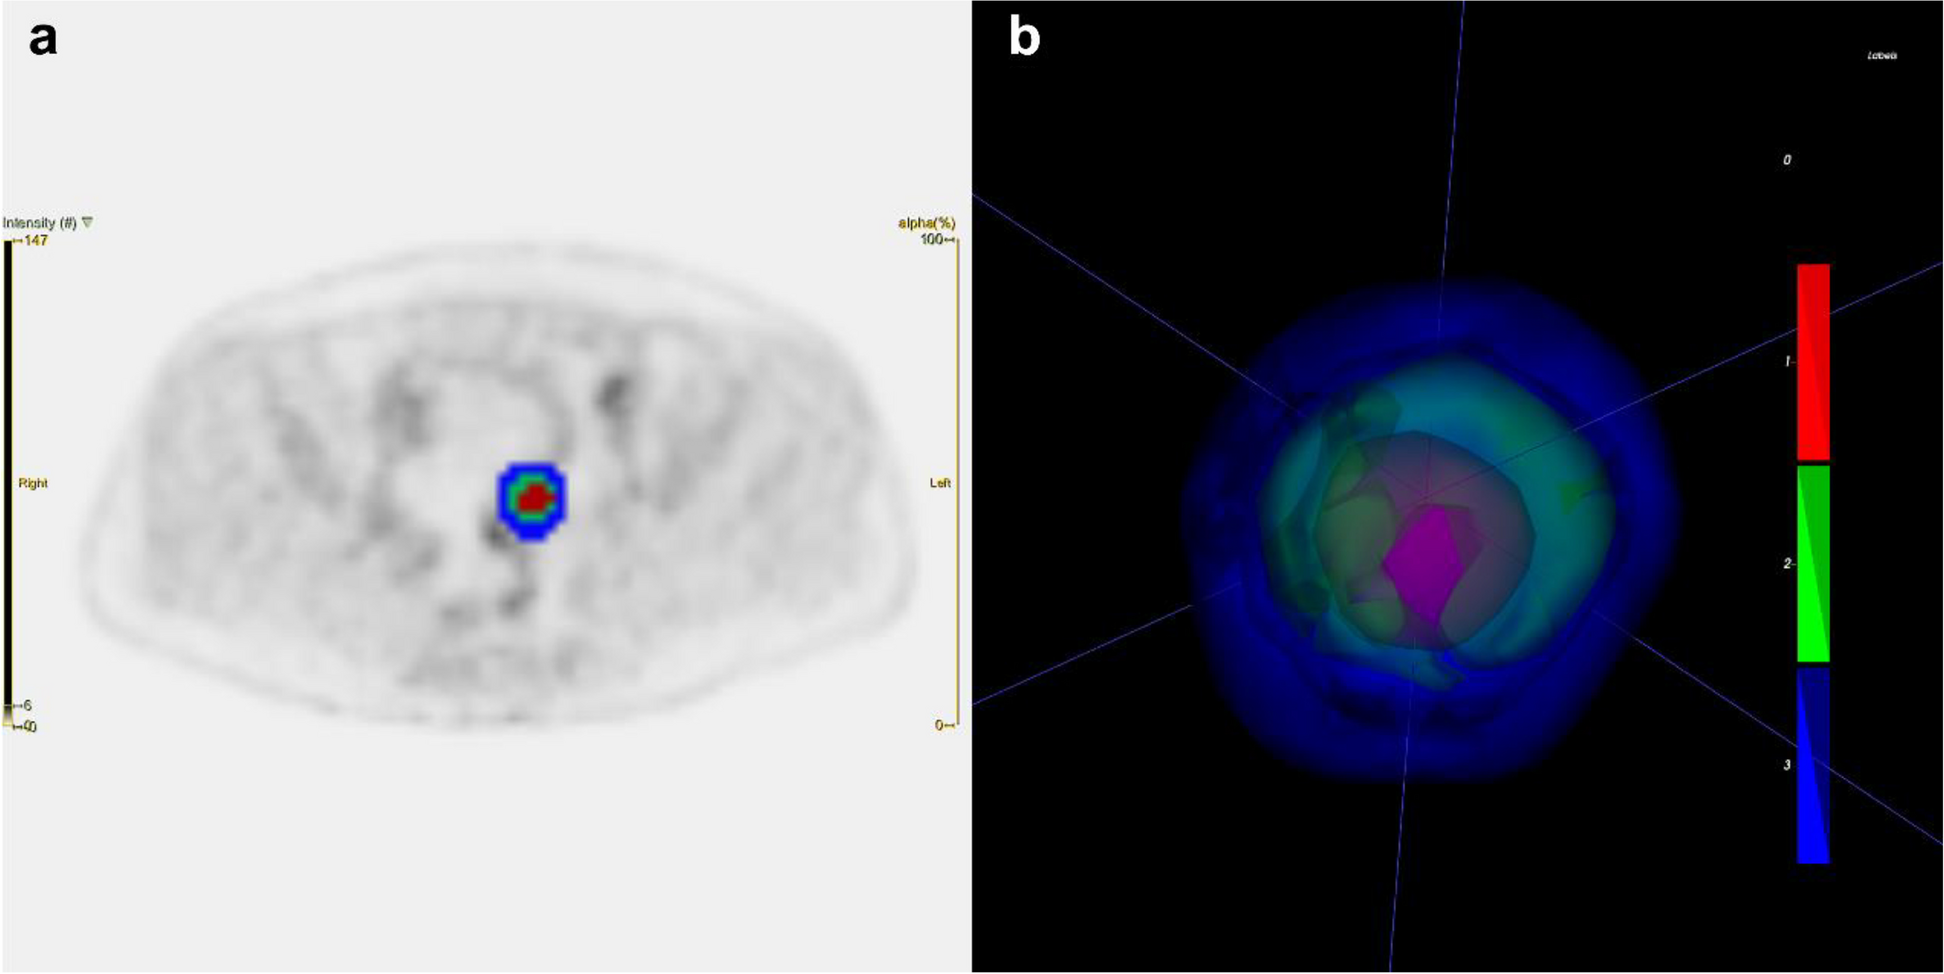
For each lesion, a three-dimensional volume of interest (VOI) of the whole tumour was semiautomatically delineated on all imaging slices with the ITK SNAP program (version 4.6.1, University of Pennsylvania, www.itksnap.org), by two independent radiologists (with 15 and 10 years of experience in neuroradiology, respectively). The VOIs of the solid tumour portion were delineated on axial contrast-enhanced T1WI by referring to conventional MR images. Necrosis, cystic portion, calcification and haemorrhage were carefully recognized and excluded from tumour portion. Then VOIs were automatically projected onto 6 diffusion maps (ADC, D, D*, f, DDC, alpha) by a co-registration tool in SPM8 (Wellcome Centre for Human Neuromaging, http://www.fl.ion.ucl.ac.uk/spm/).
The data of tumour solid parts were then assessed by an open-source software package FeAture Explorer (FAE; https://github.com/salan668/FAE). The 3D information from all voxels inside the VOIs was calculated to generate the histogram of 6 diffusion maps. The final extracted histogram parameters included mean, median, 10th percentile, 90th percentile, kurtosis, and skewness. The workflow chart is presented as Fig. S2.
Statistical analysisAll data analysis was performed with IBM SPSS Statistics (Version 23.0, IBM Corp) and Medcalc (Version 11.1.1.0). The interobserver agreements of all histogram parameters were evaluated with Bland‒Altman analysis and the intraclass correlation coefficient (ICC): 0.00–0.20, poor correlation; 0.21–0.40, fair correlation; 0.41–0.60, moderate correlation; 0.61–0.80, good correlation; and 0.81–1.00, excellent correlation. Student’s t-test or nonparametric Mann‒Whitney U test was performed to test the differences in histogram parameters between soft and hard tumours. For statistically significant parameters, ROC curves were conducted to evaluate their diagnostic abilities in differentiating hard tumours from soft tumours. The corresponding area under the ROC curves (AUCs), with the 95% confidence interval (CI), was calculated to determine the optimal cut-off values for each histogram metric in the grading of meningioma. The diagnostic sensitivity and specificity of the value were also computed. The optimal threshold was selected by the maximum Youden index. The DeLong method was used to analyse the significance of the difference between the AUCs. P values less than 0.05 were considered statistically significant.
留言 (0)