
記住我


The model population consisted of adult patients with high-risk, early-stage TNBC [31]. Population eligibility and baseline characteristics of patients were aligned with the KEYNOTE-522 trial (ClinicalTrials.gov, NCT03036488; participants were from 22 countries; however, no patients from Switzerland were included) (e.g., patients with newly diagnosed, previously untreated and nonmetastatic disease) [28]. The model assumed that all patients were female and the starting age at model entry was 49 years old [32, 33].
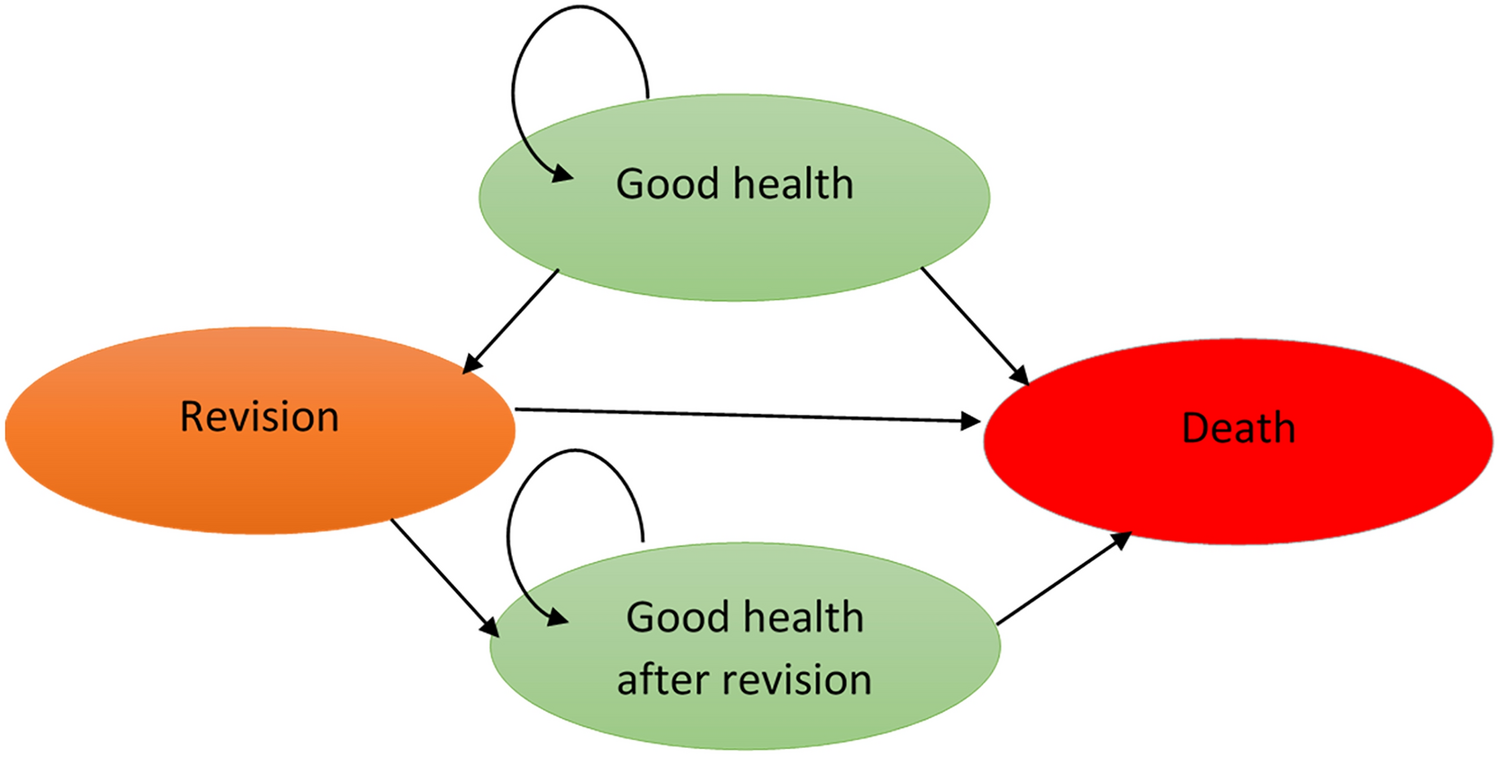
2.2 Model StructureA Markov state cohort transition model with four health states (event-free [EF]; locoregional recurrence [LR]; distant metastasis [DM], and death) was developed (Fig. 1) to estimate the cost-effectiveness of neoadjuvant pembrolizumab plus chemotherapy followed by adjuvant pembrolizumab versus neoadjuvant chemotherapy plus placebo followed by adjuvant placebo (referred to as pembrolizumab plus chemotherapy versus chemotherapy alone hereafter). The model considered clinical events, including grade 3+ adverse events (AEs) from neoadjuvant and adjuvant treatment, surgery following neoadjuvant treatment, and radiation therapy in the adjuvant treatment phase, for which specific cost inputs were applied. A 1-week model cycle length was used for a granular estimation of treatment-related costs, and a half-cycle correction was applied in the base-case analysis. An annual discount rate of 3% was applied to both costs and effectiveness in the base-case analysis, in line with recently published cost-effectiveness analyses in Switzerland [34,35,36]. A lifetime horizon of up to 51 years (maximum 100 years of age) was used to comprehensively capture differences in costs, effectiveness and outcomes between treatment arms, aligning with standard practice guidelines [37]. All analyses were conducted from a third-party payer perspective in Switzerland, representing the obligatory health insurance system, which has 100% coverage in the country. The model was developed in Microsoft Excel® 2016, and VBA was utilized to perform sensitivity analyses.
Fig. 1 2.3 Intervention and Comparator
The intervention in the model was neoadjuvant pembrolizumab plus chemotherapy followed by adjuvant pembrolizumab and the comparator was neoadjuvant chemotherapy followed by adjuvant placebo, reflecting the treatment arms in the KEYNOTE-522 trial [28]. Patients received neoadjuvant pembrolizumab plus chemotherapy, administered as four cycles of pembrolizumab (200 mg every 3 weeks) plus paclitaxel (80 mg/m2 weekly) and carboplatin (area under the curve [AUC] 5 every 3 weeks). This was followed by four cycles of pembrolizumab plus doxorubicin (60 mg/m2) and cyclophosphamide (600 mg/m2 every 3 weeks in the subsequent 12 weeks). Following definitive surgery, patients received adjuvant radiation therapy plus pembrolizumab once every 3 weeks for up to nine cycles. The comparator arm was modeled to reflect the placebo arm in the KEYNOTE-522 trial, following the same schedule as the chemotherapy in the intervention arm.
2.4 Transition ProbabilitiesTransition probabilities were estimated using data from the KEYNOTE-522 trial and natural mortality data from the Federal Statistical Office (2013–2020) [33, 37]. EFS was estimated using patient-level data from the KEYNOTE-522 trial and extrapolated over the modeled time horizon [33]. Survival curve fitting was carried out in line with the National Institute for Health and Care Excellence (NICE) Decision Support Unit (DSU) guidelines [37]. The base-case parametric survival models were chosen based on statistical tests, visual assessment of fit and clinical plausibility of the long-term extrapolated model. Separate survival models were fitted for each therapy arm and standard (one-piece) parametric models were fitted, including exponential, Weibull, log-normal, log logistic, Gompertz, gamma and generalized gamma. Statistical tests based on the Akaike information criterion (AIC) and the Bayesian information criterion (BIC), combined with visual inspection, were used to select the best-fit parametric distributions.
As standard parametric models did not provide a good fit to the observed data, piecewise parametric models were explored. For both arms, a 50-week cut-off point was used. This ensured the Kaplan-Meier (KM) data were robust enough to generate short-term transition probabilities for the first 50 weeks, and that enough data remained to extrapolate transition probabilities after week 50. For the pembrolizumab plus chemotherapy arm, a generalized gamma distribution provided the best fit, based on both AIC and BIC and confirmed by visual inspection. For the chemotherapy arm, AIC indicated a best fit using a generalized gamma distribution; however, BIC indicated a log-normal distribution as the best fit. Although the visual inspection suggested generalized gamma is more plausible, neither distribution fitted the observed EFS data well. As the standard parametric models did not provide a good fit, piecewise parametric models were explored. A log-normal distribution was found to be the best fit and was used in the base case for the chemotherapy arm. Scenario analysis tested a generalized gamma distribution for both therapy arms and a log-normal distribution for both therapy arms (results are presented in the Supplementary materials_1: Table S9; see the electronic supplementary material).
Transition probabilities from LR to DM or death were estimated using data from the KEYNOTE-522 trial [33]. Parametric models were fitted to the time from LR to DM or death, and an exponential distribution was used in the base case as it had the best fit.
The transition probabilities from DM to death were estimated based on the survival time for patients who had documented DM from the KEYNOTE-522 trial. Parametric models were fitted to the data. Exponential distribution was selected as the best fit, and time-constant transition probabilities for DM to death were estimated based on the fitted exponential distributions [33]. All-cause natural mortality was incorporated for all individuals in the model, and therefore, the probability of death was at least as high as the all-cause natural mortality.
2.5 Adverse Event Rates and DurationsThe model included grade 3+ all-cause AEs with an incidence of at least 5% for combined neoadjuvant and adjuvant phase in either treatment arm. AEs included neutropenia, febrile neutropenia, neutrophil count decrease, anemia, decrease in white blood cells and increase in alanine aminotransferase. AE rates and mean durations were obtained from the KEYNOTE-522 trial [33] and were considered separately for each treatment arm (Supplementary materials_1: Table S1; see the electronic supplementary material). A mean duration of 12.5 weeks was applied to all grade 3+ AEs based on pooled data from the KEYNOTE-522 trial [33]. AE-related disutility and costs were applied in the model (Supplementary materials_1: Table S2).
2.6 Utility InputsHealth state utility values used in the base case were derived from EQ-5D-5L data collected in the KEYNOTE-522 trial [33] and converted to population-based utility values using a published algorithm [38]. There is no EQ-5D value set for Switzerland; therefore, the model used the German value set in the base-case analysis [39, 40]. The German value set for the EQ-5D-5L was developed through interviews with a representative sample of the general population in Germany (n = 1158) as part of a time trade-off and discrete choice experiment [39]. Utility inputs used for the base-case model can be found in Supplementary materials_1: Table S2 (see the electronic supplementary material). A one-time AE utility decrement of − 0.022 was applied for grade 3+ AEs in both arms based on pooled data from the KEYNOTE-522 trial [33]. A disutility related to patient age (years) was applied per year of increasing age in the base-case analysis based on a model of mean health state utility values from the general population [41].
2.7 Cost and Resource Use InputsCost data were reported in CHF (2022) and estimated from a Swiss third-party payer perspective. The consumer price index was sourced from the Swiss Federal Office for Statistics and used to inflate costs as needed to 2022 values [42]. The following cost components were considered in the model: neoadjuvant treatment costs, adjuvant treatment costs, surgery costs, radiation costs, disease management costs, terminal care costs, AE management costs and distant metastatic treatment costs. Details of each cost input and the associated sources are outlined below and presented in Supplementary materials_1: Table S2 (see the electronic supplementary material).
Neoadjuvant and adjuvant treatment costs included drug acquisition costs (unit acquisition cost, number of units per administration, dose intensity and proportion of treatment allocation) and drug administration costs, for each cycle for the duration of treatment.
Surgery and radiation costs were calculated based on the unit costs and the proportion of patients receiving surgery or radiation in each treatment arm. Recurring disease management costs included consultations, mammograms and ultrasounds, which were applied weekly (Supplementary materials_1: Table S2). Disease management costs for patients who remained in the EF state for more than 10 years were assumed to be zero. A one-off terminal care cost was applied before death. AE costs were calculated as a function of the AE rates, the proportion hospitalized for each AE event and the unit costs of medical management for each AE in the inpatient or outpatient setting. A one-off cost was applied upon entry to the DM state, which included drug acquisition and administration costs associated with metastatic TNBC therapies. Treatment rate, distribution and duration of metastatic treatments were derived from the KEYNOTE-522 trial.
2.8 Time on TreatmentThe time on neoadjuvant and adjuvant treatment for both therapy arms was estimated using the observed KM curve from the KEYNOTE-522 trial. For scenario analyses, the lower and upper 95% CIs of the KM curve were considered.
2.9 Sensitivity AnalysesA one-way deterministic sensitivity analysis (DSA), a probabilistic sensitivity analysis (PSA) and scenario analyses were performed to analyze the robustness of the base-case results. The DSA was performed to test the robustness of the model to parameter uncertainty, by varying one model input or assumption at a time by their 95% CI derived from the standard error. In the PSA, model inputs were varied simultaneously for each parameter over 1000 iterations to assess uncertainty in the cost-effectiveness model results (Supplementary materials_1: Table S3; see the electronic supplementary material). Scenario analyses were conducted to assess the impact of different assumptions for the time horizons, discount rates, efficacy, EFS parametric functions, half-cycle correction, vial sharing, relative dose intensity, utilities (including removing the age disutility), time on treatment, remission rates, AE costs, treatment waning and subsequent treatment cost being equal in both arms (with the highest cost applied [CHF53,716.19]) (Supplementary materials_1: Table S4). Furthermore, scenario analyses investigating a generalized gamma distribution and a log-normal distribution for both therapy arms were also performed.
2.10 Model ValidationValidation of the modeled EFS curves was performed with internal and external sources. The modeled EFS was found to be comparable to the observed EFS in the KEYNOTE-522 trial, a retrospective study of patients with TNBC (median follow-up: 30 months) and a randomized, open-label, phase II trial of patients with stage II or III TNBC (n = 443) for both therapy arms (Supplementary materials_1: Table S5 and Fig. S1; see the electronic supplementary material) [33, 43]. The EFS results from these studies were shown to be similar to the base-case chemotherapy EFS, which confirms the plausibility of the EFS projections. As there are no long-term EFS data for patients with TNBC who received pembrolizumab, long-term EFS of the pembrolizumab plus chemotherapy arm was validated through discussions with a panel of key opinion leaders (KOLs), consisting of eight medical oncologists and two health economists from Europe. KOLs validated the intervention extrapolation in terms of the clinical plausibility and in comparison with the comparator extrapolation in terms of the expected improvement with immuno-oncology therapies.
Predicted cumulative incidence rates of EF to LR, DM or death were validated with the observed cumulative incidence rates from the KEYNOTE-522 trial [33]. This analysis demonstrated that the modeled cumulative incidence rates were comparable to the observed data (Supplementary materials_1: Fig. S1). Furthermore, the predicted OS data were validated using internal and external sources, including the KEYNOTE-522 trial, the CALGB 40603 (Alliance) trial and the study by Walsh et al. (2019; a retrospective study) [43, 44]. Modeled OS was comparable to observed OS in the KEYNOTE-522 trial and the two external studies (Supplementary materials_1: Figure S2). These analyses were performed using short-term data (up to 3 years), as there were no long-term OS data for patients with early-stage TNBC receiving pembrolizumab.
留言 (0)