
Remember me
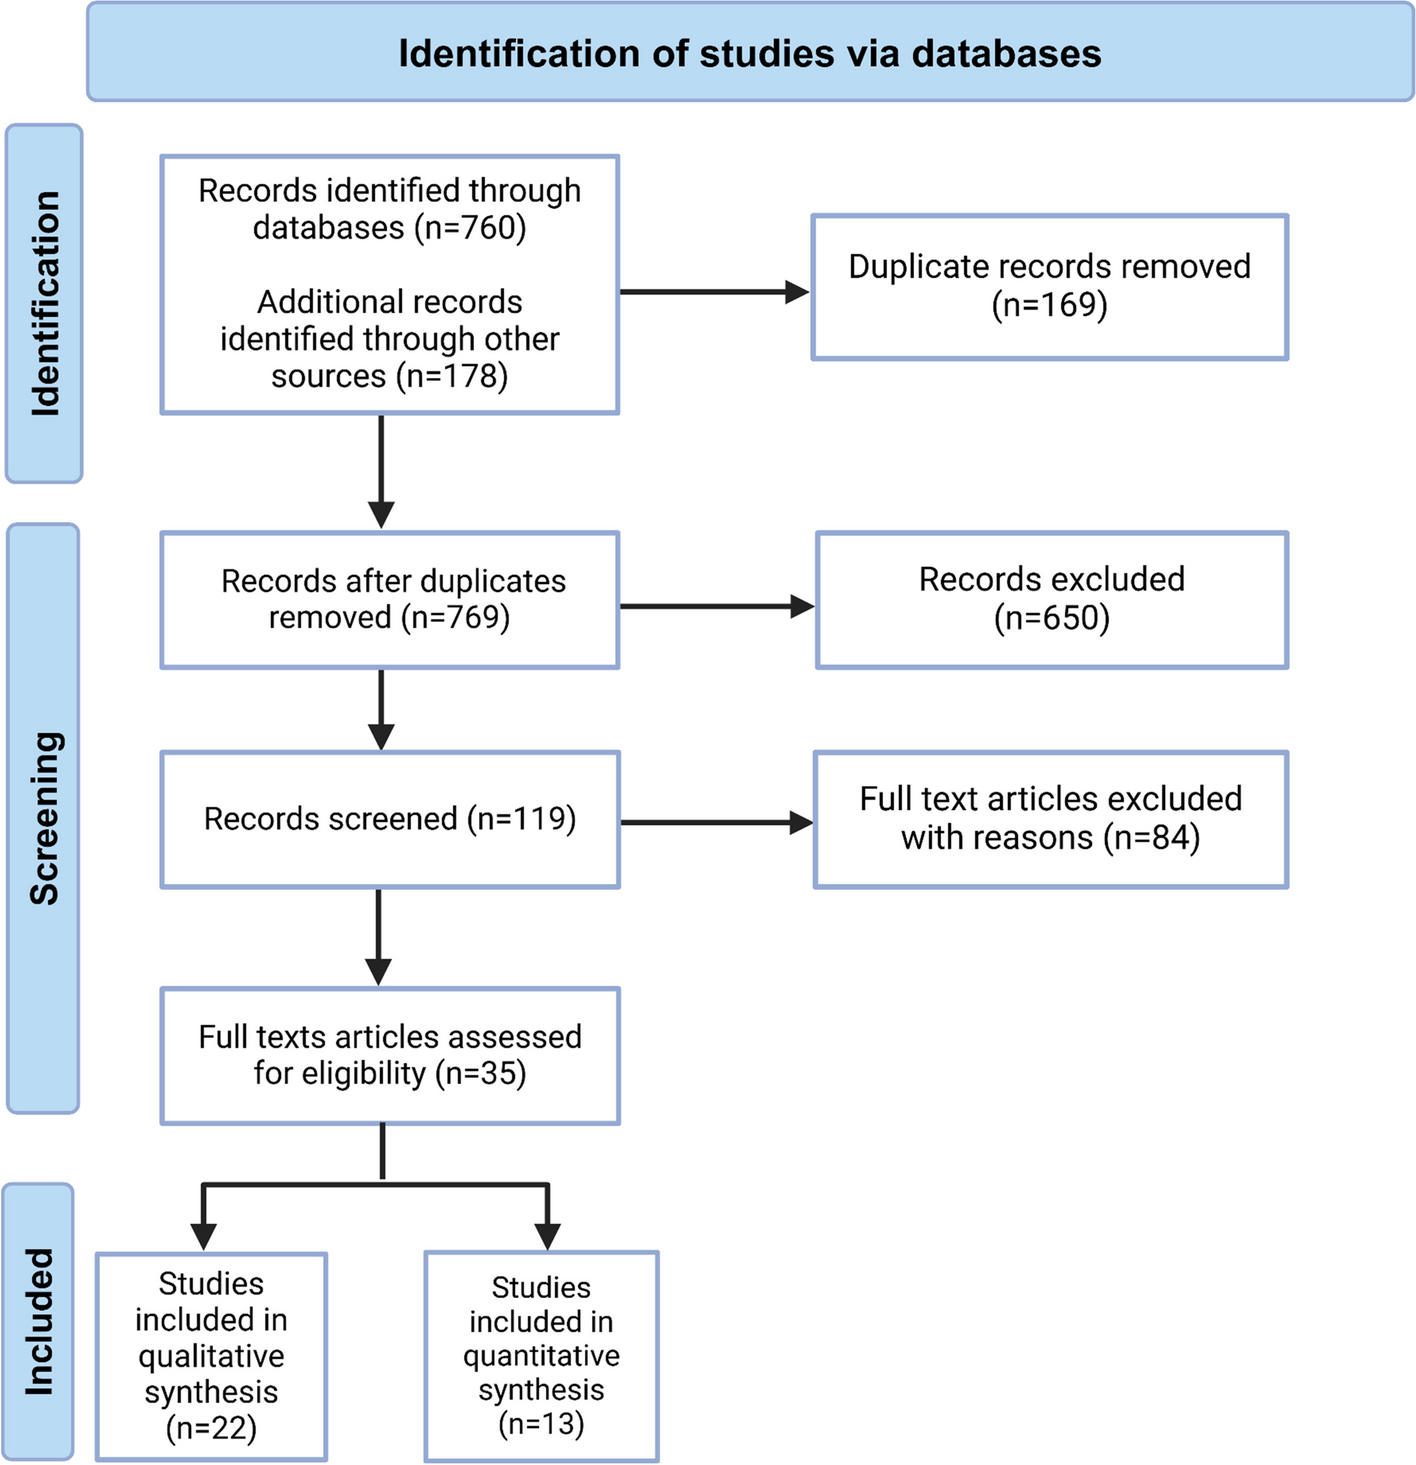


Online database search identified 2487 articles, of which 1638 records were retrieved after removing duplicates (Figure S1). Finally, 28 studies were included, including 15 full-length articles and 13 abstract studies. Among them, 7 abstract studies without specified survival data were included in the systematic review, [15,16,17,18,19,20,21]. 15 full-length articles were included in the IPD-based synthesis, [10,11,12,13, 22,23,24,25,26,27,28,29,30,31,32] and 20 studies with detailed survival data were included in the conventional synthesis of HRs (95% CI) [9,10,11,12,13, 23,24,25,26,27,28,29,30,31,32,33,34,35,36,37]. A full-length study by Zhao X et al. [22], which reported survival outcomes of 7 patients without HR (95% CI), was only included in the IPD-based synthesis. All studies included in quantitative analysis were assessed as high-quality studies (scored no less than 7 points) based on the NOS (Table S1).
The detailed baseline characteristics and survival outcomes of the included studies for meta-analysis were summarized in Tables S2 and S3, respectively. The 21 studies totally involved 1686 participants, ranging from 7 to 330 patients in each study. The first three testing timepoints were baseline, postoperative, and longitudinal timepoints (Figure S2). Additional file 3 summarized the IPD of 15 studies, the data from three of which was reconstructed from the reported Kaplan–Meier (K-M) curves [13, 23, 26]. Half of the included participants were younger than 60 years. Most of the patients (70.65%) were diagnosed as adenocarcinoma (AD) in the mean tumor size of 2.79 ± 1.41 cm. The detailed baseline characteristics of IPD were summarized in Table S4. In addition, inter-group disparities of baseline characteristics at the baseline, postoperative, and longitudinal timepoints were almost balanced using PSM (Figure S3; Tables S5 to S7 respectively).
Prognostic role of baseline ctDNA statusTotally, 13 studies [10,11,12,13, 22, 24,25,26,27,28,29,30,31] involving 1113 participants were included in the IPD-based DFS analysis (Fig. 1A). Patients with negative ctDNA status showed significantly lower recurrence rate than those with positive ctDNA status (HR = 3.73, 95% CI: 2.95–4.72, P < 0.001). Totally, 118 pairs of participants from 5 studies [24, 25, 27, 29, 31] were generated with PSM. The survival analysis indicated that the difference in recurrence rate between patients with different ctDNA statuses remained significant (HR = 1.97, 95% CI: 1.29–3.01, P = 0.002, Fig. 1B). Another analysis via multivariate Cox regression with 610 patients from 5 studies [24, 25, 27, 29, 31] generated similar estimate (P < 0.001, Table S8). Furthermore, sensitivity analyses by Cox regression with a shared frailty model and a stratified Cox regression model, which modeled between-study heterogeneity, confirmed the consistency of estimates (Table S8). IPD-based OS analysis based on 245 patients from 4 studies [22, 26, 27, 29] also yielded HRs in favor of ctDNA-negative patients (Fig. 1C). The results of subgroup analysis were summarized in Table S8. In addition, the pooled HRs (95% CI) of DFS and OS by conventional meta-analysis showed favorable prognostic value of ctDNA negative status (Fig. 1D and Figure S4A, respectively). Sensitivity analysis indicated that after removing the study by Zhang JT et al. [13], the between-study heterogeneity was reduced significantly (Figure S4B) and no publication bias was discovered (Figure S4C).
Fig. 1
Synthesis of survival outcomes by baseline ctDNA status. A Individual patient data (IPD)-based disease-free survival (DFS) by baseline ctDNA status (+ vs. −). B IPD-based DFS by baseline ctDNA status (+ vs. −) based on propensity score matching (PSM). C IPD-based overall survival (OS) by baseline ctDNA status (+ vs. −). D Pooled meta-analysis of DFS by baseline ctDNA status (+ vs. −)
Prognostic role of postoperative ctDNA statusTotally, 1051 participants from 14 studies [10,11,12,13, 22,23,24,25, 27,28,29,30,31,32] were included in the IPD-based DFS analysis (Fig. 2A). Postoperative negative ctDNA status predicted significantly lower recurrence rate than positive ctDNA status (HR = 6.52, 95% CI: 5.08–8.36, P < 0.001). PSM generated 53 pairs of participants from 5 studies [24, 25, 27, 29, 31], and the survival analysis confirmed the correlation of postoperative ctDNA positive status with higher risk of recurrence (HR = 3.96, 95% CI: 2.19–7.16, P < 0.001, Fig. 2B). Inter-group demographic discrepancy was also addressed using multivariate Cox regression analysis, which showed similar estimate (P < 0.001, Table 1). Furthermore, sensitivity analyses by Cox regression with the shared frailty model and the stratified Cox regression model confirmed the consistency of estimates (Table 1). IPD-based OS analysis with 225 patients from 5 studies [22, 23, 27, 29, 32] also yielded HRs in favor of ctDNA-negative patients (Fig. 2C). The results of subgroup analysis were summarized in Table 1. In addition, the pooled HRs (95% CI) of DFS and OS by conventional meta-analysis showed favorable prognostic value of postoperative ctDNA negative status (Fig. 2D and Figure S4D, respectively). Sensitivity analysis failed to identify the source of between-study heterogeneity (Figure S4E) and the funnel plot showed no publication bias (Figure S4F).
Fig. 2
Synthesis of survival outcomes by postoperative ctDNA status. A Individual patient data (IPD)-based disease-free survival (DFS) by postoperative ctDNA status (+ vs. −). B IPD-based DFS by postoperative ctDNA status (+ vs. −) based on propensity score matching (PSM). C IPD-based overall survival (OS) by postoperative ctDNA status (+ vs. −). D pooled meta-analysis of DFS by postoperative ctDNA status (+ vs. −)
Table 1 Survival outcomes by postoperative ctDNA status (+ vs −) based on reconstructed individual patient dataPrognostic role of longitudinal ctDNA statusA total of 8 studies [10,11,12,13, 27, 29,30,31] involving 610 participants were included in the IPD-based DFS analysis (Fig. 3A). During the follow-up period, patients with persistent negative ctDNA showed significantly lower recurrence rate than those with positive ctDNA (HR = 12.33, 95% CI: 8.72–17.43, P < 0.001). Totally, 39 pairs of participants from 3 studies [27, 29, 31] were generated with PSM, and the survival analysis showed that the between-group difference of recurrence rate remained significant (HR = 3.99, 95% CI: 1.76–8.89, P < 0.001, Fig. 3B). Another method via multivariate Cox regression helped to address inter-group demographic discrepancy, which generated similar estimate (P < 0.001, Table S9). Sensitivity analyses by Cox regression with the shared frailty model and the stratified Cox regression model confirmed the consistency of estimates (Table S9). IPD-based OS analysis with 142 patients from 2 studies [27, 29] also yielded HRs in favor of patients with longitudinal ctDNA negative status (Fig. 3C). The results of subgroup analysis were summarized in Table S9. In addition, the pooled HRs (95% CI) of DFS by conventional meta-analysis showed favorable prognostic value of ctDNA negative status (Fig. 3D). Sensitivity analysis showed that the between-study heterogeneity mainly originated from the study by Yin R et al. [34] (Figure S4G), and visional publication bias was discovered (Figure S4H).
Fig. 3
Synthesis of survival outcomes by longitudinal ctDNA status. A Individual patient data (IPD)-based disease-free survival (DFS) by longitudinal ctDNA status (+ vs. −). B IPD-based DFS by longitudinal ctDNA status (+ vs. −) based on propensity score matching (PSM). C IPD-based overall survival (OS) by longitudinal ctDNA status (+ vs. −). D pooled meta-analysis of DFS by longitudinal ctDNA status (+ vs. −)
Comments (0)