
記住我

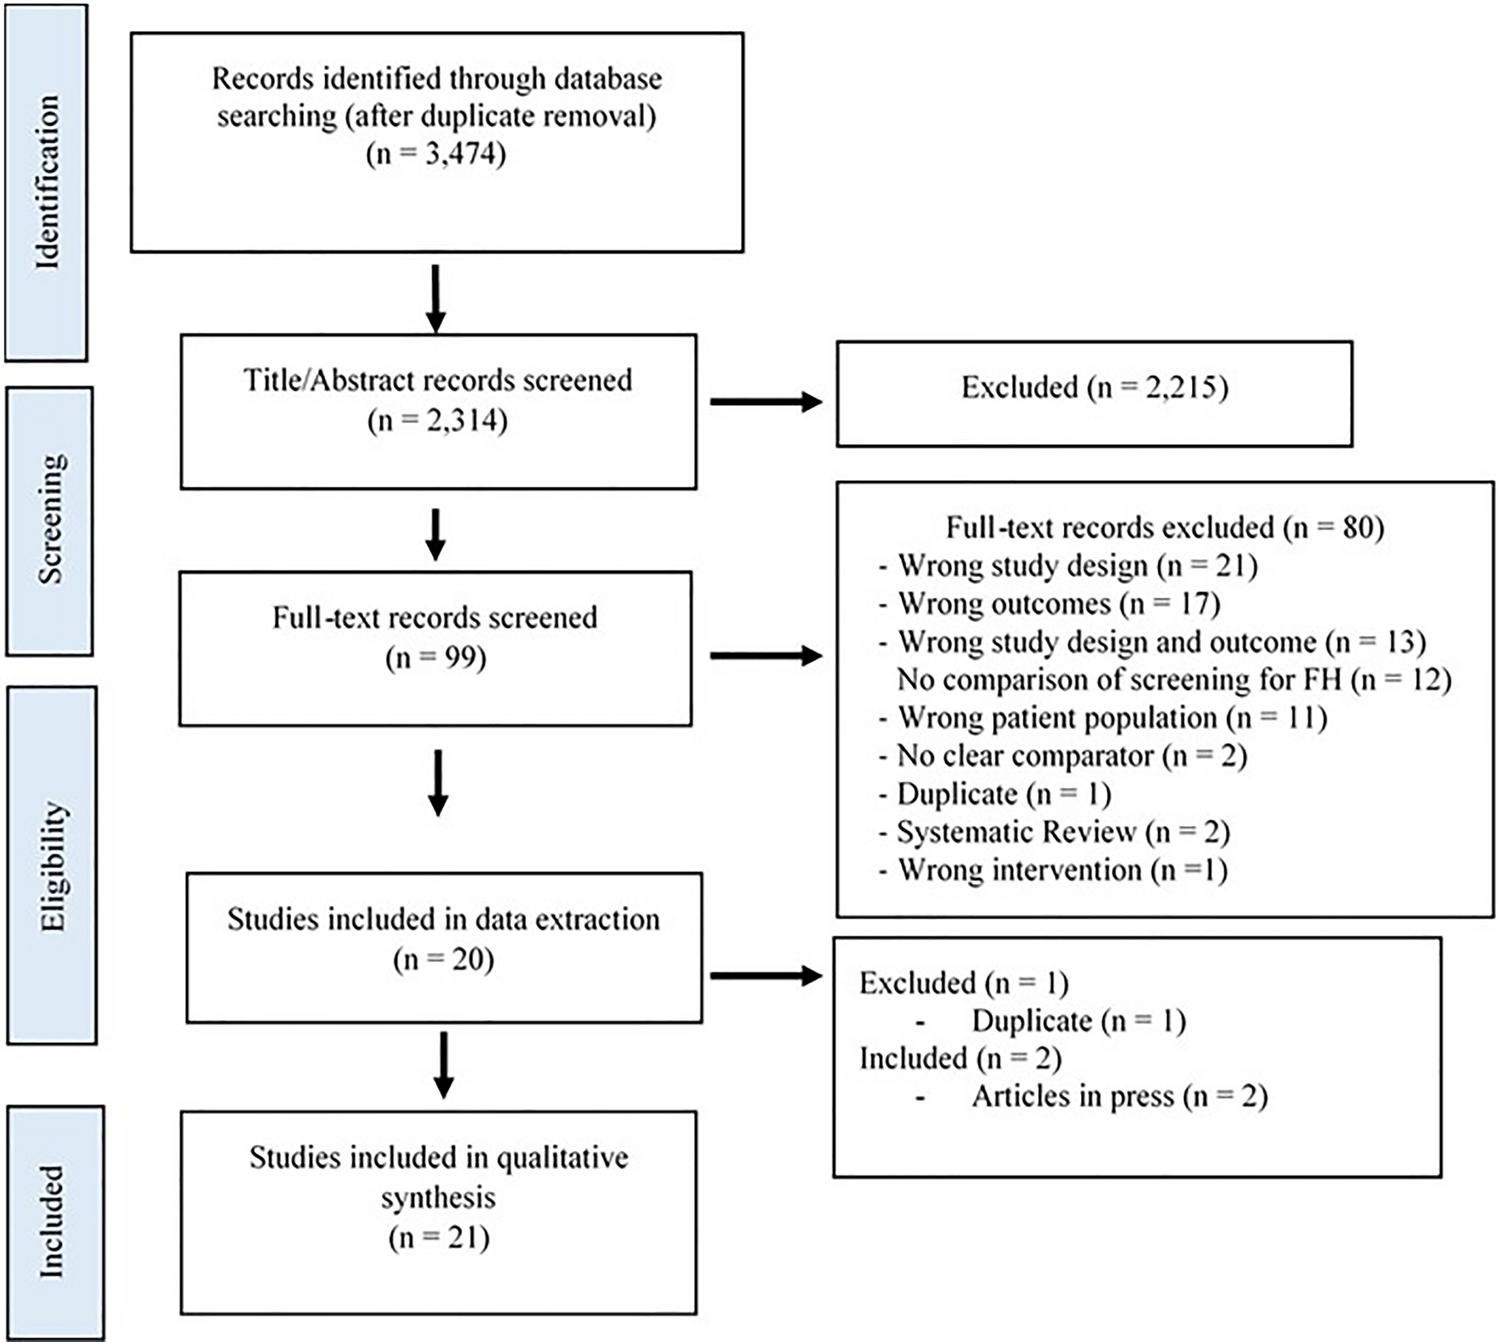
A population-based mathematical model was developed, using Microsoft Excel, to assess the value of introducing a new antimicrobial in treating hospital-acquired infections (HAIs) (treatment setting) and the prophylactic use to prevent infection during surgery and chemotherapy (prophylactic setting). The effectiveness of antimicrobials to treat and prevent infection is defined by the relationship between antimicrobial consumption (exposure) and AMR. The introduction of a new antimicrobial and the appropriate use of existing antimicrobials are considered in the context of the AMS principle that increased treatment diversity reduces selection pressure on existing antimicrobial treatments, and thus is considered to reduce the projected gain in population-level resistance (i.e. the mean resistance level across all pathogens and treatments). Reducing resistance gain leads to improved population-level effectiveness in both the treatment and prophylactic settings, when compared to without the introduction of a new antimicrobial. The value of introducing a new antimicrobial is captured in the model by improvements in population-level outcomes including reduced rates of infection, deaths, and hospital activity in both treatment and prophylactic settings. Figure 1 outlines the relationships between variables within the model, in a causal loop diagram, additional factors beyond the scope of the current analysis were also included to provide the wider context.
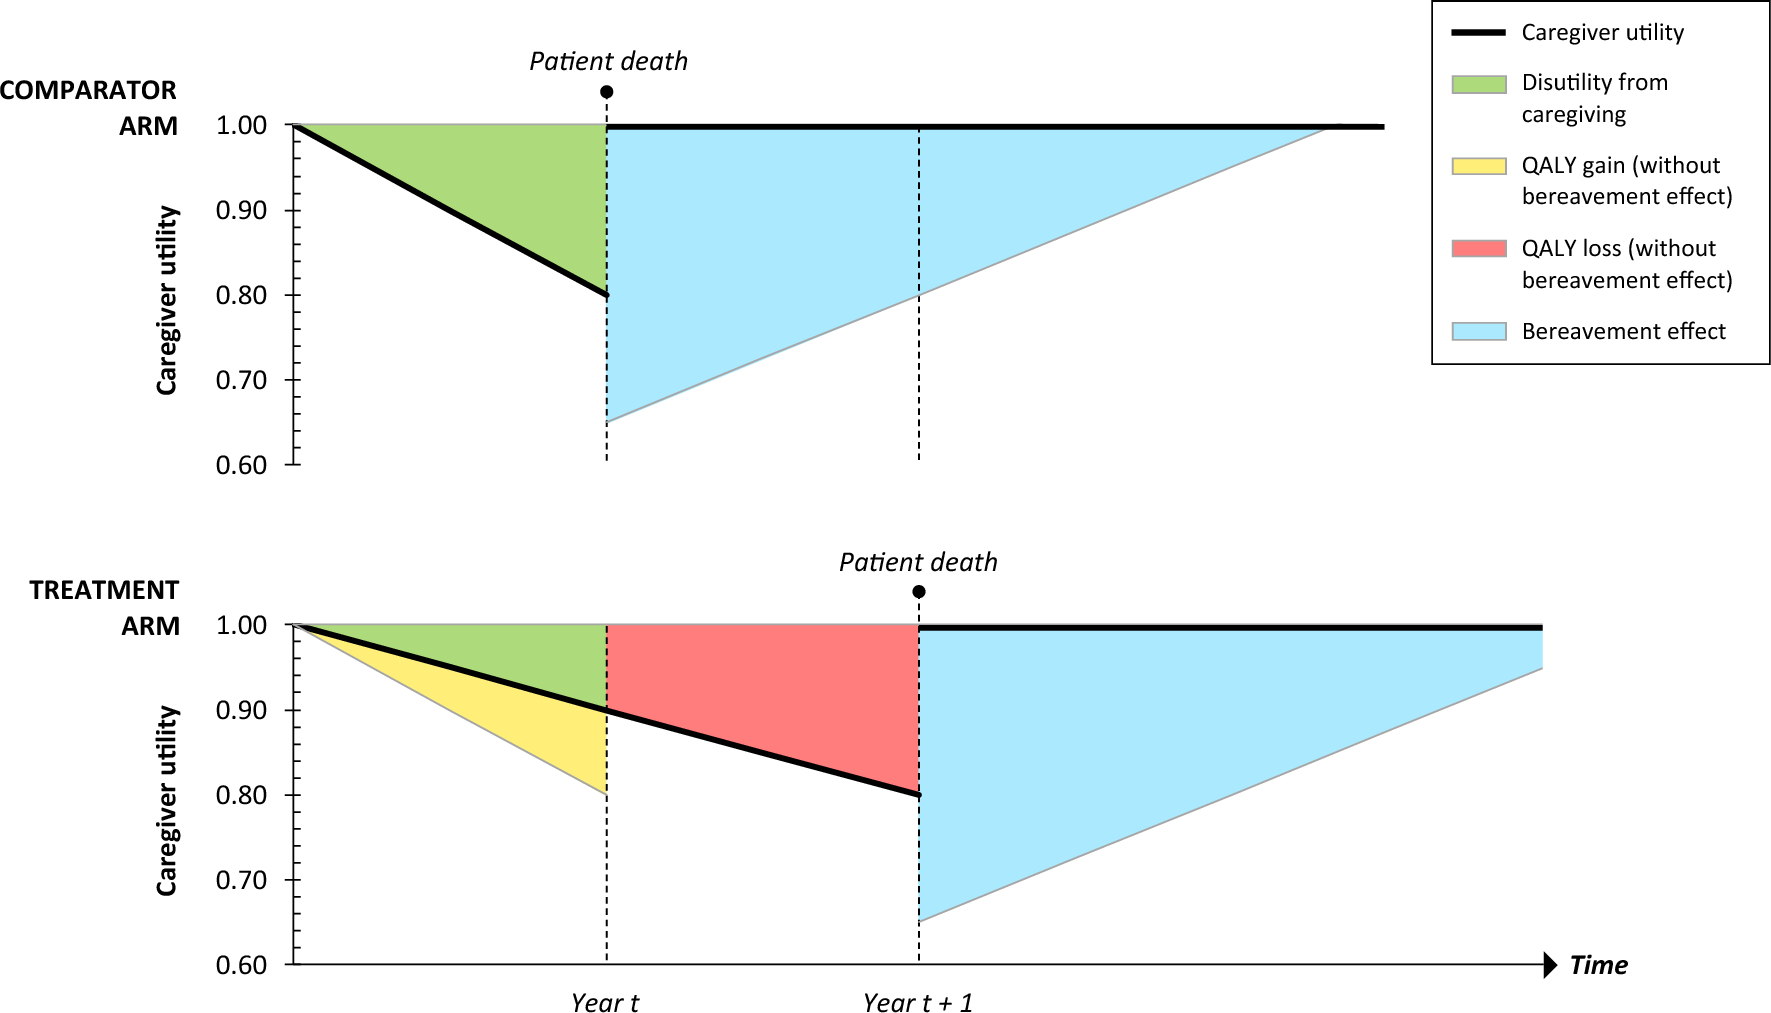
Fig. 1
Causal loop diagram demonstrating the interactions between modelled variables (yellow) to generate modelled outcomes (blue) within the hospital setting (the impact of antimicrobial use in the community and environmental settings are not covered within this diagram). Green arrows show the impact of introducing a new antimicrobial on each of the variables and the clinical and economic outcomes. The shaded areas show how the variables have been used to estimate transmission, diversity and enablement value. A new product increases antimicrobial diversity, reducing selection pressure and antimicrobial resistance, reduced antimicrobial resistance increases antimicrobial efficacy in the treatment and prophylactic setting, leading to fewer surgical- and chemotherapy-related infections and more effective hospital-acquired infection treatment, and reduced transmission of resistant infections. Variables and outcomes in white are not measured within the current model but have important influences on the measured variables. R&D research and development
A deterministic mathematical model was developed building upon previous AMR modelling studies [5, 14]. This model has two major components, outlined in a model schematic (Fig. S1 of the Electronic Supplementary Material [ESM]). The first component captures the effects of a new antimicrobial being introduced compared to no new antimicrobial in the treatment setting considering HAIs (capturing transmission and diversity value). The second component assesses the effects of a relative reduction in population-level AMR (derived from the impact of introducing a new antimicrobial compared with continuing without the addition of a new antimicrobial on resistance gain captured in the treatment setting) by means of a change in prophylactic efficacy in the prophylactic setting (capturing enablement value). A model analysis was undertaken from the healthcare system perspective to estimate the relationship between changes in AMR, antimicrobial efficacy and outcomes at a population level.
2.2 Treatment SettingThe treatment component is adapted from a published and validated dynamic model and has been described previously [14], in short, this model considered the impact of a new antimicrobial on the transmission of infection and resistance in an infectious environment to estimate the health economic value. The treatment setting in the current study uses regression equations to summarise the transmission dynamics and relationships for drivers of model outputs from the previously published model [14]. This approach was taken to reduce the model complexity and data requirements. The regression equations were derived by running over 1 million simulations, varying inputs for the population, baseline resistance, treatment strategy, treatment duration and treatment efficacy in the previously published model [14]. Linear regression models were applied to time on treatment, the number resistant to each treatment, and death, and were derived separately based on if two or three lines of treatment were modelled, which were then used to estimate model outcomes presented as a pooled estimate by pathogen and indication. Outputs of the linear regression models are presented in the ESM.
Inputs relating to treatment efficacy, baseline resistance, hospitalisation costs and length of stay, life expectancy and health state utilities (Table S2 of the ESM) are applied to the regression equations to estimate health economic outcomes for treating the modelled infections. Life-year (LY) and quality-adjusted life-year (QALY) outcomes are linked to the mortality equation, where utility values related to infected and non-infected patients and life expectancy post-successful treatment are applied. Cost outcomes are linked to the mortality and time on treatment equations where daily hospitalisation costs are applied (Fig. S1 of the ESM). An internal validation compared model outcomes against outcomes from the previously published model, which has been extensively validated against external data [14]. The disease transmission component of the published model, on which the regression equations were based, was calibrated to estimate resistance change and indication-specific infection incidence using UK data [14]; these dynamics were validated using historic resistance data for hospital-acquired infections in the USA reported from the National Healthcare Safety Network at the Centers for Disease Control and Prevention. The model was parameterised with resistance data from 2011 and the predicted outcomes for resistance were compared against reported data for 2012, 2013 and 2014 [16]. These validation exercises are described in Figs. S2 and S3 of the ESM.
2.3 Prophylactic SettingIn the prophylactic component of the model, outcomes are assessed in the context of preventing infection during surgery and chemotherapy. The change in prophylactic antimicrobial efficacy was estimated at a population level, dependent on antimicrobial exposure in the treatment setting. Antimicrobial exposure is estimated within a treatment pathway under two scenarios using projected population-level resistance, from the treatment setting, for the two-line treatment strategy (representing continuing with no new antimicrobial) and the three-line treatment strategy (representing the addition of a new antimicrobial to treatment options). A change in antimicrobial efficacy is estimated from antimicrobial exposure using the following equation.
$$\text= \frac}\left(\text\right)}-\frac}\left(\text\right)}$$
The change in population-level resistance estimated in the treatment setting is assumed to be reflected in the prophylactic setting and therefore, the proportional change in prophylactic antimicrobial efficacy was assumed to be equivalent to the estimated change in antimicrobial efficacy. The prophylactic component utilises research conducted by Teillant et al. [5] to link the improvement in prophylactic efficacy to outcomes. The authors conducted a literature review and meta-analysis of randomised controlled trials assessing the efficacy of antimicrobial prophylaxis treatment on outcomes of surgical procedures and immunosuppressing chemotherapy. Using the absolute risk reduction in infection (ARRi) rates between antimicrobial prophylaxis and control groups, they were able to estimate the number of infections and deaths avoided across the annual number of procedures (Ni), given changes in prophylactic antimicrobial efficacy, using the following equations, where i denotes the procedure:
$$}_=}_\times }_\times _\times \text$$
$$}_ =}_\times _\times \text$$
Using the methodology described by the authors, the prophylactic component estimated the number of infections and infection-related deaths for each of the ten most common surgical procedures and cancer chemotherapies in the USA, by applying the estimated percentage improvements in prophylactic efficacy to published procedure-specific rates of infection and mortality from infection [5]. Procedure-specific utilities and life expectancies were applied to infections and deaths avoided to calculate QALYs gained in the prophylactic setting.
2.4 Model InputsThe treatment component was populated with data from the US setting (model inputs detailed in Table S2 of the ESM), where outcomes were evaluated over a disease transmission horizon of 10 years based on an average of 19,396 HAIs per annum. These consisted of complicated urinary tract infections, complicated intra-abdominal infections and hospital acquired/ventilator-associated pneumonia caused by the three most common gram-negative pathogens (Escherichia coli, Klebsiella spp. and Pseudomonas aeruginosa) in US HAIs [17]. Whilst the model assesses outcomes for all indications of interest, the estimated annual infection incidence was informed by data from the 2019 National and State Healthcare-associated Infections Progress Report [18], which lacked data on complicated intra-abdominal infections. Therefore, the overall number of annual infections excludes complicated intra-abdominal infections. Current therapy was represented by piperacillin/tazobactam (first line) and meropenem (second line) for each of the three pathogens and indications of interest, informed by clinical guidance and expert opinion [19,20,21]. Antimicrobial resistance estimates were sourced from the most recent national summary of AMR (2015–17) from the National Healthcare Safety Network, considering all reported HAIs [17]. Antimicrobial resistance levels for carbapenems were used as a proxy for meropenem, and where data were not available for piperacillin/tazobactam, AMR rates for extended-spectrum cephalosporin were used as a proxy for E. coli and Klebsiella spp.; E. coli and Klebsiella spp. strains resistant to extended-spectrum cephalosporins are usually producers of extended-spectrum beta-lactamases and therefore will be resistant against piperacillin/tazobactam [22, 23]. Treatment efficacy in patients with no resistance to treatment for piperacillin/tazobactam and meropenem were obtained from randomised controlled trials and were estimated as a weighted average across the modelled pathogen and indications. As this analysis considered the addition of a hypothetical novel antimicrobial, its efficacy was assumed and the value reflected a moderate improvement on the comparator treatments. Hospitalisation costs were taken from the 2019 Centers for Medicare and Medicaid Services costs report [24].
The prophylactic component included the ten most common surgical procedures and immunosuppressing cancer chemotherapies in the USA as identified by Teillant et al. [5] The annual number of procedures are presented in Table S3 of the ESM.
The absolute risk reductions for infection/serious infection incidence and mortality for each procedure form the basis for the evaluation of annual infections and deaths avoided and are detailed in Tables S3–5 of the ESM. Procedure-specific utility decrements for infection, post-procedure life expectancy and post-procedure utility values are presented in Tables S6–9 of the ESM.
2.5 Data SourcesFor national data on HAI incidence, the current model draws on the 2019 National and State Healthcare-Associated Infections Progress Report produced by the Centers for Disease Control and Prevention National Healthcare Safety Network [18]. This source reports HAI data from almost 38,000 healthcare facilities across all 50 states in the USA. Evidence on national-level data on AMR for HAIs was also sourced from the NHSN reported by the Centers for Disease Control and Prevention [17]. Estimates of the incidence of surgical and chemotherapy treatments were sourced from Teillant et al. [5] and were based on the Centers for Disease Control and Prevention National Hospital Discharge Survey, the National Cancer Data Base or from the published scientific literature.
2.6 Model OutputsThe treatment setting of the model estimates the population-level value to patients and the healthcare system of achieving more effective treatment of infections through reductions in AMR in terms of cost offsets, LYs and QALYs gained [1]. The prophylactic setting was used to estimate the value to patients of reduced infections/deaths associated with more effective prophylactic antimicrobials, as determined by changes in AMR [2] Total value ([1] + [2]) was calculated based on the frequency of antimicrobial use in the treatment setting and in the prophylactic setting.
To quantify the economic outcomes associated with a reduction in AMR levels, we calculated the monetary benefit (MB), which is defined as follows:
$$\text = \text \times \text \left(\text\$\text\right) + \text.$$
We aimed to quantify the overall value to healthcare systems a new antimicrobial would provide; therefore, only hospitalization costs were considered. This is aligned with the NHS England/NICE pilot scheme approach, where treatment costs are excluded, to estimate the population-level economic value relevant to investment decisions and not as an assessment of cost effectiveness [29].
2.7 Model Analysis2.7.1 Base CaseWe estimated the potential population value of antimicrobials used in prophylactic and treatment-based settings by comparing model outputs under the intervention (introduction of a hypothetical new antimicrobial, within an AMS strategy) to those obtained under current practice (without the introduction of a new antimicrobial). The current practice consists of two lines of treatment (piperacillin/tazobactam first line followed by meropenem second line). The analysis assumed a willingness-to-pay (WTP) threshold of $100,000/QALY and applied a discount rate of 3.0% per year [25]
2.7.2 Sensitivity AnalysisThe sensitivity of the model to input estimates was tested deterministically in a series of one-way sensitivity analyses. Key model inputs relating to treatment efficacy, baseline resistance, utilities, and hospitalisation input listed in Tables S2 and S3–9 of the ESM were adjusted by ± 20% (proportions were maintained between 0 and 100%) and the impact was assessed according to the combined MB across both the treatment and prophylactic settings combined. Scenarios were also explored using a WTP threshold of $50,000 and $200,000.
To test the impact of input uncertainty on the model outcomes, an additional deterministic sensitivity analysis was conducted using the 95% confidence intervals (CIs) for upper and lower bound, where 95% CI were not available inputs were adjusted by ± 20%. Additionally, a two-way sensitivity analysis was conducted to assess the impact of correlated inputs on the model estimate for combined MB, by adjusting two key model inputs ± 20% simultaneously and testing for non-linear relationships between inputs.
Scenario analyses were conducted to explore the impact of the efficacy of the newly introduced antimicrobial. Five scenarios were considered, the first examined a scenario where all treatment lines have the same efficacy (90%), in the other analyses, the efficacy of the new antimicrobial was adjusted from 50 to 80% in 10% increments, whilst the efficacy of the current antimicrobials were unadjusted from the base case (piperacillin/tazobactam; 88% and meropenem; 87%).
留言 (0)