Search strategy and selection criteria
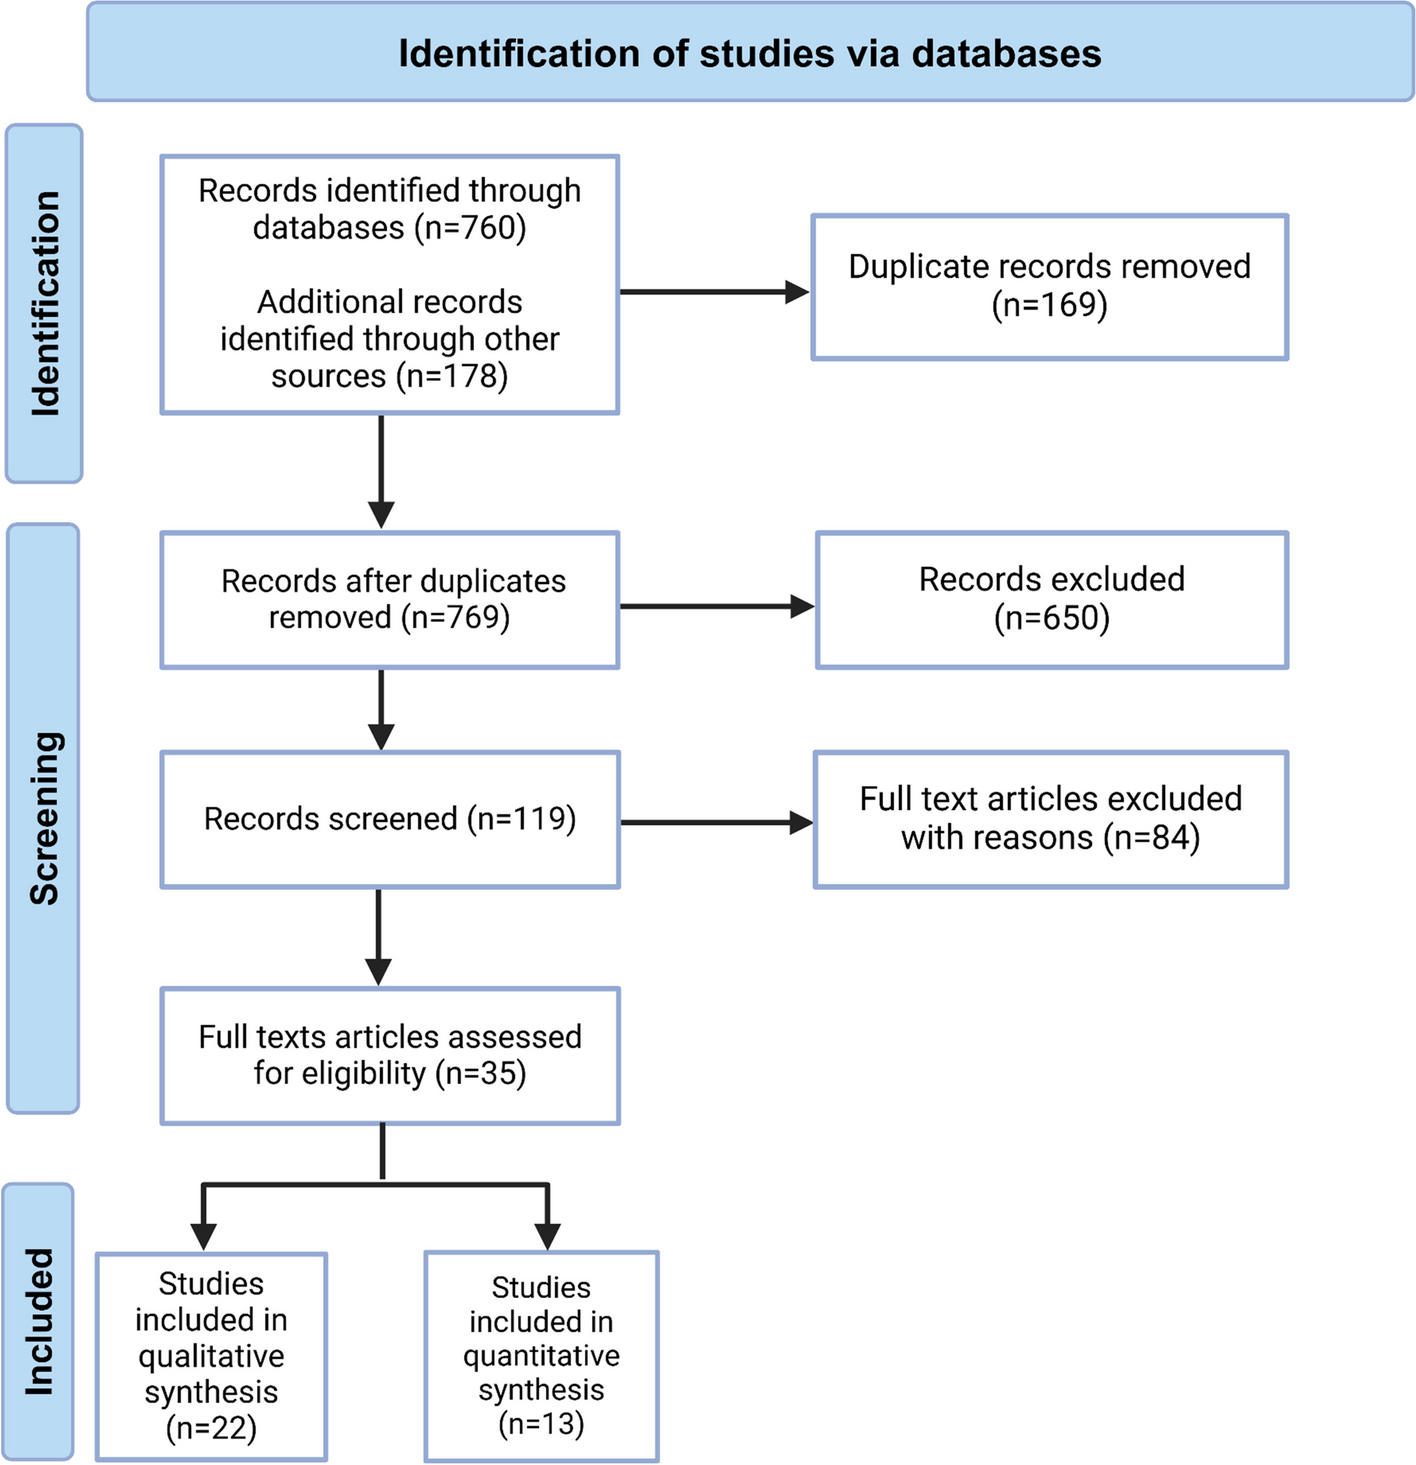
We followed the updated Preferred Reporting Items for Systematic Reviews and Meta-Analyses (PRISMA 2020) statement’s instructions [9]. Systematic searches were conducted through PubMed, EMBASE, and Cochrane Library principally up to January 1st, 2023, for studies focusing on the associations of female- and male-specific factors with dementia or cognitive decline. As there is already extensive literature on studies of hormone replacement treatment (HRT) in females, this paper will not discuss that topic [10]. Leveraging prior research [11] and guidance from experienced gynecologists and andrologists, we identified female-specific reproductive risk factors using the following search strategy: menarche, placental bed disorders, menstrual cycle, polycystic ovarian syndrome, reproductive period, menopause, climacteric symptoms, reproductive history, estradiol, sex hormone–binding globulin, pregnancy, gravidity, parity, breastfeeding, intrauterine growth retardation, preterm delivery, stillbirth, induced abortion, gestational diabetes, ectopic pregnancy, hyperemesis gravidarum, gestational hypertension, ovarian hyperstimulation, in vitro fertilization, oophorectomy, hysterectomy, subfertility, cesarean section, natural labor, dystocia, fetal death, multiple pregnancies, postpartum hemorrhage, amniotic fluid embolism, puerperal infection, postpartum depression, hyperprolactinemia, amenorrhea, premature ovarian failure, hypothalamus-pituitary-ovary axis, test tube baby, premature rupture of membrane, intrahepatic cholestasis of pregnancy. The following strategy was used for male-specific reproductive risk factors: erectile dysfunction, testosterone, dihydrotestosterone, androstanediol glucuronide, androgen, androgen deprivation therapy, orchiectomy, haplotype Y chromosome cryptorchidism, prostatic hyperplasia, cryptorchidism, varicocele. The literature search strategy included the following terms for outcomes: Alzheimer, dementia, cognitive, and cognition. The main outcome was dementia or cognitive decline. When multiple outcome types were reported for a factor, findings were categorized into the subgroups cognitive decline, dementia, and AD.
The inclusion criteria were as follows: (1) Studies were required to be cohort studies, however, for female reproductive factors (menstrual factors, parity, and gynecological operations), besides cohort studies, case–control studies were also included given the expectation of modest recall bias; (2) The measurement of the outcomes had to be described in detail, with cognitive decline assessed using standard and full-scaled cognitive tests, and dementia or AD diagnosed using objective and globalized diagnostic criteria such as Diagnostic and Statistical Manual of Mental Disorders criteria, International Classification of Diseases codes, and National Institute of Neurological and Communicative Disorders and Stroke and the Alzheimer’s Disease and Related Disorders Association criteria; and (3) For dose–response analysis, the pooled related factors needed to be separated into at least three levels, with specific or calculable person-years and case numbers within each level.
Two researchers independently screened the included studies. If a discrepancy arose, the third author was asked to determine whether to include or exclude the study. When two or more studies originated from the same database, the study with the biggest sample size and/or most detailed information was retained. Additionally, we combed through the bibliographies of qualified studies to avoid overlooking any potentially pertinent studies.
Data extraction
Predesigned templates were used to extract data from each article, including first author, publication year, study design, population resource, cognitive status at the baseline, mean age, gender composition, follow-up duration, attrition rate, total sample size for analysis, incident case, type of outcome, outcome measurement, type of exposed factor, measurement of exposed factor, adjusted confounders, and risk estimates. If any required data was not reported in the publication, we contacted the authors to obtain it. Two authors with extensive experience extracted the data, and any disagreements were resolved with assistance from a third reviewer.
Assessment of study quality
The Newcastle–Ottawa Scale (NOS) was used to evaluate potential bias. In order to more accurately measure potential bias in studies, a modified version of the NOS was utilized [12] (Additional file 1 Appendix A and Appendix B). The NOS can fully evaluate a single study, incorporating various criteria such as representativeness, comparability, objectivity, and reliability (Additional file 1: Appendix C).
Statistical analyses
Above all, the risk estimates and 95% confidence intervals (CIs) for a series of risk factors were acquired for further analysis. When odds ratios (ORs) were provided in some articles instead of relative risks (RRs) or hazard ratios (HRs), we used the following algorithm to convert ORs to RRs [13]:
$$RR\;adjusted=OR\;adjusted/\lbrack\left(1-P_0\right)+\;\left(P_\ast\;OR\;adjusted\right)\rbrack$$
P0 represents the incidence of dementia or cognitive decline in the non-exposed group. If P0 cannot be calculated, the overall incidence rate of the entire sample can be used instead.
To begin, we specified definitions of exposures to facilitate comparison of pooled data across studies: (a) early menarche was defined as age at menarche ≤ 13 years; (b) late menarche was ≥ 16 years; (c) early menopause was ≤ 45 years; (d) late menopause was ≥ 54 years; (e) short reproductive period was ≤ 34 years; (f) long reproductive period was ≥ 38 years; (g) early childbearing was ≤ 20 years; and (h) late childbearing was ≥ 30 years. The fixed model combined risk estimates of the same category within a study, while the random model pooled estimates across studies [13]. Heterogeneity was evaluated by the Q test and quantified by the I2 metric [14]. For factors with ≥ 10 studies, subgroup analysis and meta-regression were conducted.
Dose–response analysis for eligible components was undertaken using the inverse variance weighted least squares regression with cluster robust error variances (REMR model) [15]. For studies that did not use the lowest category as the reference group, we reassigned the reference group and recalculated the effect sizes using Orsini’s method [12]. When a range was provided, the midpoint represented the average exposure level. For open-ended categories, the exposure level was set to the boundary limit plus/minus the interval length of adjacent groups [16]. Figures and analyses were performed using GraphPad Prism 9.0 and Stata Version 12.0.
Evaluation of evidence certaintyGRADE scores
Five domains were used to assess the credibility of the meta-analysis: “risk of bias [17],” “inconsistency [18],” “imprecision [19],” “indirectness [20],” and “publication bias [21].” The certainty of each domain was classified as “0 (probably high), − 1 (probably moderate), or − 2 (probably low).” The Grading of Recommendations Assessment, Development, and Evaluation (GRADE) approach evaluated the overall credibility of the meta-analysis [22] (website of the GRADE: https://community.cochrane.org/help/tools-and-software/gradepro-gdt) (Additional file 1: Appendix D).
Systematic review index
Unlike traditional studies which neglected research not suitable for meta-analysis, we introduced a new parameter called “index S.” Index S was calculated using the following formula:
$$Index\;S\;=\left[\left(NOS\;score\;\left[study\_1\right]\;/9\right)\ast P\;+\;\left(NOS\;score\;\left[study\_2\right]\;/9\right)\ast P+...+\;\left((NOS\;score\;\left[study\_N\right]/9\right)\right]/N.$$
N denoted the total number of studies included in the systematic review. To better describe the results, we calculated both “index Sfor” and “index Sagainst.” Index Sfor reflected the number of high-quality studies agreeing with the meta-analysis results, while index Sagainst reflected those disagreeing. When calculating index Sfor, P was 0 if the study results were inconsistent with the meta-analysis, and 1 if consistent. The calculation of index Sagainst was reversed. Based on this, we introduced the concept of “index S divergence,” calculated as index Sfor minus index Sagainst. A higher divergence score indicated greater support for the meta-analysis result [23].


Comments (0)