
Remember me


The coagulopathy of traumatic brain injury (TBI) remains poorly understood. While coagulopathy occurs in nearly half of patients who incur a head injury, obstacles remain in predicting these patients and understanding the derangements in hemostatic capacity after TBI, in particular if also accompanied by multiple trauma or hemorrhagic shock.1 Contradictory descriptions in the literature highlight the distinction between systemic and local coagulation environment, with characterization of hypocoagulopathy and progression of intracranial hemorrhage to hypercoagulability due to systemic immune response, inflammation, and platelet hyperactivity.2–4 This latter pathologic hypercoagulability has been linked to higher rates of macrothrombotic morbidity including deep venous thrombosis and microthrombotic morbidity like acute lung and kidney injury.5–7
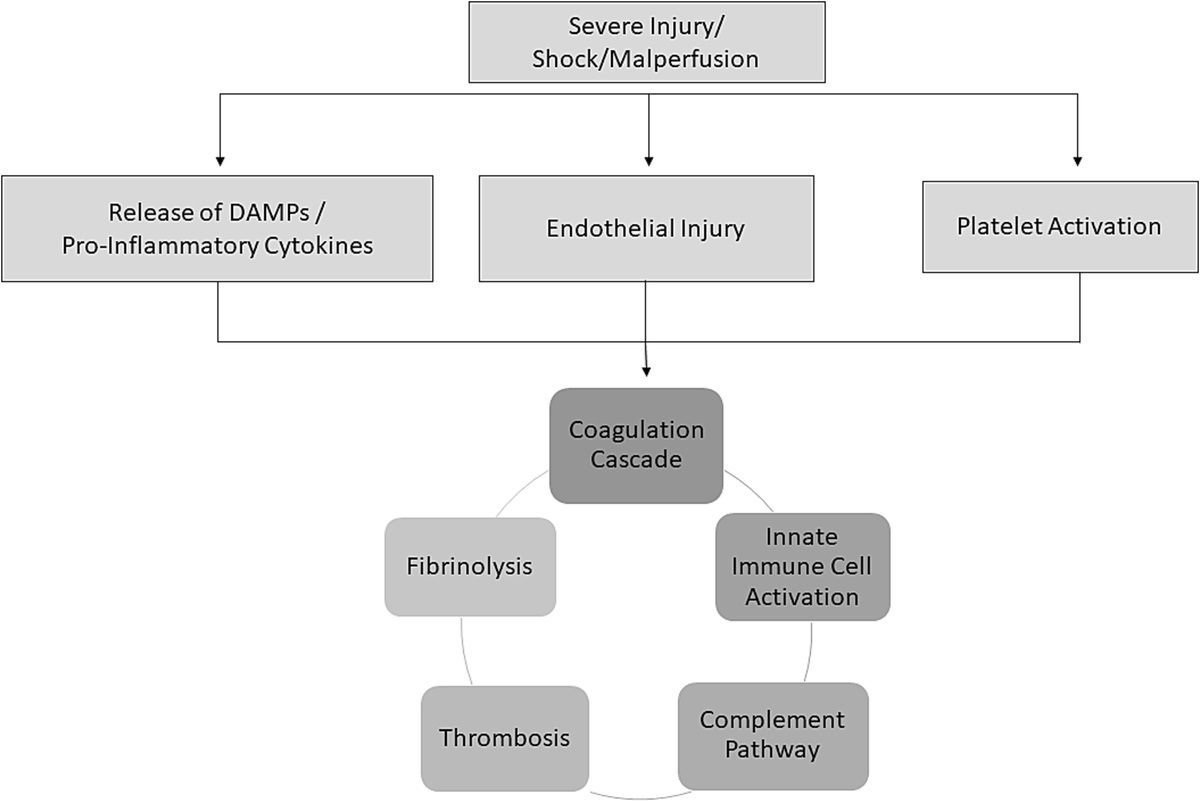
The mechanisms underlying the hypercoagulability of TBI remain elusive; however, previous work suggests a role of complement, platelet activation, fibrinolysis inhibition, endotheliopathy, and prothrombotic microparticles, among other players.8 The principal process of TBI-related hypercoagulability is thought to be driven by release of tissue factor from the dura, or another neuronal source, into the general circulation.9–11 These higher levels of tissue factor are hypothesized to drive increased thrombin generation and alter platelet responsiveness following cortical injury. Despite these theories, which ultimately suggest that the coagulopathy of TBI is an expression of disseminated intravascular coagulopathy (DIC), data to support tissue factor release after brain injury resulting in consumptive coagulopathy has not been proven and as such, a gap in the literature remains. Evolving omics technology have enhanced our understanding of the mechanisms underlying trauma-induced coagulopathy, but significant work remains in the field of TBI specifically, despite suggestion that neurometabolites and proinflammatory proteins may play a significant role in the pathology of cerebral injury12,13 and interplay with coagulation.
The aim of this study is to better characterize coagulopathy of brain injury in trauma patients, specifically by evaluating hemostatic capacity before and after dura violation in the procedural setting with viscoelastic hemostatic assays, tissue factor activity, metabolomics, and proteomics.14 Given the data describing tissue factor release after TBI, we hypothesize that dura violation is associated with higher circulating levels of tissue factor, conversion to a hypercoagulable profile, and a unique metabolomic and proteomic phenotype.
METHODSTo examine the coagulopathy of TBI, we conducted a prospective, observational cohort study from 2019 to 2021 at an academic Level I trauma center. The study was approved by the local institutional review board (IRB 17-2093) and performed under waiver of consent. This study was compliant with STROBE guidelines (checklist in Supplemental Digital Content 1, https://links.lww.com/TA/D168).
Patient and Sample CollectionInclusion criteria were patients admitted to the surgical trauma intensive care unit (ICU) with traumatic brain injuries (including subarachnoid, intraparenchymal, or epidural bleeds) requiring neurosurgical intervention. At this institution, there is no dedicated neuro ICU and as such, all patients with ICU needs and TBI are admitted to the surgical ICU, where they are cared for collaboratively by surgical critical care intensivists and neurosurgery. Once a patient was admitted to the ICU with a TBI, whether isolated or as part of a multiple trauma complex, a 24/7 professional research assistant pager was notified for enrollment at time of neurosurgical procedures. Patients were excluded if minors (<18 years old) or pregnant. When a patient was in the operating room (after immediate transport from the emergency department or ICU), whole blood was drawn before dura violation and then 1 hour thereafter (given the half-life of tissue factor is approximately 1 hour) in citrated vacuum tubes (35 mL, 3.2% sodium citrate).
Sample ProcessingCitrated rapid (CR-) thrombelastography (TEG) and tissue plasminogen activator (tPA-) challenged TEG (ThromboTherapeutics Inc., Walpole, MA) were performed with the TEG 5000 Thrombelastography Hemostasis Analyzer (Haemonetics, Niles, IL) according to manufacturer's instructions. Citrated rapid-TEG results in the following: activating clotting time (ACT, time elapsed from initiation of test until onset of clot formation in seconds), angle (rate of clot strength increase in degrees), maximum amplitude (MA; maximal clot strength achieved in millimeters), and percent clot lysis 30 minutes after reaching MA (LY30; lysis 30 minutes after MA in %). The tPA-challenged TEG, which has been validated in previous studies and detects fibrinolysis with a greater sensitivity than citrated rapid TEG,15–17 uses 75 ng/mL of exogenous tPA to assess degree of tPA-provoked fibrinolysis. The degree of fibrinolytic responsiveness is categorized as normal, “tPA-sensitive”, or “tPA-resistant,” the latter being linked to increased mortality in trauma patients.17,18 The remaining blood was spun down to platelet-poor plasma (1,000g at 4°C for 15 minutes, then 12,600g at 4°C for 6 minutes) for storage in −80°C until time of omic analysis and tissue factor measurements.
Metabolomics AnalysesFor metabolomics, metabolites were extracted from plasma samples for mass spectrometric analysis using previously described methods.19 Briefly, metabolites were extracted using a methanol, acetonitrile, and water (5:3:1) solution. Extracts were centrifuged to pellet insoluble fractions. Supernatants were transferred to autosampler vials and loaded into a Vanquish UHLPC coupled to a Q-Exactive mass spectrometer (Thermo Fisher Scientific, Bremen, Germany) with a Kinetex C18 column (Phenomenex). Raw data were processed using Maven (Princeton University, Princeton, NJ) equipped with the KEGG database.
Proteomics AnalysesFor proteomics, analyses were performed as previously described.20 Briefly, plasma samples were digested in the S-Trap 96-well plate (Protifi, Huntington, NY) following the manufacturer's procedure. The Evosep One system (Evosep, Odense, Denmark) was used to separate peptides on a Pepsep columnpacked with ReproSil C18 1.9 μm, 120A resin, and the system was coupled to the timsTOF Pro mass spectrometer (Bruker Daltonics, Bremen, Germany) via the nano-electrospray ion source (Captive Spray, Bruker Daltonics). The mass spectrometer was operated in diaPASEF mode, and we used a project-specific library generated from 24 high-pH reverse-phase peptide fractions acquired with PASEF technology. For tissue factor analysis, plasma tissue factory activity (CY-QUANT MV-TF activity) was measured through ELISA (BioCytex) per manufacturer's instruction.
Statistical AnalysisAll statistical analyses were performed using in R (version 4.1.0; 2021-05-18). Wilcoxon signed rank test was used for pairwise comparison (for pre- and post-dura violation) for the thrombelastography and tissue factor results. For the omic results, row-wise, log transformation normalization was performed with normalization to constant sums, and then again pairwise comparison was performed (for pre- and post-dura violation), in addition to multivariate analysis for the metabolomic data including PCA, PLS-DA, hierarchical clustering analysis as has previously been described.21 Finally, to assess any correlation of the omic data to measurements of hemostatic capacity, proteome and metabolome wide correlations to TEG measurements were performed. Raw omics data were correlated using the Spearman method. Omics data that were mean centered and divided by the square root of the standard deviation for each analyte achieved a normal distribution. Pearson correlations were calculated for the normalized data. Top significant correlates were selected for linear regression and results that showed a significant p value of the predicted slope were plotted. Statistical significance was considered at p < 0.05.
RESULTSOverall, 57 patients were included, 42 of whom underwent craniotomy, four underwent extraventricular drain placement, and 10 underwent intracranial bolt (Table 1). The majority (61%) were male, the median age was 52 years old, and 70% presented after blunt trauma. The median Glasgow Coma Score was 7 (3–14 interquartile range [IQR]). One patient was taking warfarin for atrial fibrillation, and two patients were taking clopidogrel. The majority of patients did not present in shock, with only 7% (4) presenting with systolic blood pressure <90 mm Hg. None of the patients required massive transfusion, and while 9% (5) received packed red blood cells and 7% (4) received fresh frozen plasma in the first hour, none received platelets, cryoprecipitate, or tranexamic acid. Three patients (5%) developed deep venous thrombosis. The mortality rate was 24% (14).
TABLE 1 - Demographic and Clinical Characteristics of Study Population Demographics Sex, % Male (n) 68% (39) Age (y) 52 (34–61) BMI 26 (23–30) Injury characteristics Blunt, % (n) 70% (40) GCS 7 (3–14) Physiologic characteristics SBP (mm Hg) 124 (111–148) Base deficit (meq/L) 5.7 (3.2–9.6) Lactate (mmol/L) 2.7 (2.2–4.9) Hematology/coagulation assays Hemoglobin (g/dL) 14.2 (12.8–15.0) Hematocrit (%) 42.7 (38.6–45.0) Platelets (109/L) 250 (214–302) INR 1.12 (1.05–1.27) PTT (s) 27.1 (24.8–31.6) Clinical outcomes Mortality, % (n) 24% (14) ≥ 1 U PRBC in 1st hour 9% (5) ≥ 1 U FFP in 1st hour 7% (4) Ventilator days 3 (0–8) ICU LOS (d) 6 (3–14) Hospital LOS (d) 11 (5–26)Presented as medians and IQRs or % (n) as appropriate.
BMI, body mass index; FFP, fresh frozen plasma; GCS, Glasgow Coma Scale; SBP, systolic blood pressure; INR, International Normalized Ratio; PTT, partial thromboplastin time; PRBC, packed red blood cell; LOS, length of stay.
Compared with pre-dura violation, post-dura violation blood samples demonstrated a systemic hypercoagulability characterized by increased clot strength and decreased fibrinolysis (Supplemental Digital Content 2, https://links.lww.com/TA/D169). After dura violation, there was a significant increase in clot strength (median MA, 74.4 mm; interquartile range [IQR], 70.2–77.7 vs. 63.5 mm; IQR, 58.5–68.8 IQR; p < 0.0001). Similarly, after dura violation, there was a significant decrease in fibrinolysis, specifically sensitivity to tPA (LY30 on tPA-challenged TEG of 1.4%; IQR, 0.4–3.4 IQR vs. 2.6%; IQR, 0.7–7.3; p = 0.04), with conversion to tPA-resistant phenotype (LY30 < 1.8%) in the post-dura violation group. There were no differences in time to clot formation or rate of clot propagation (Supplemental Digital Content 2, https://links.lww.com/TA/D169).
MetabolomicsMetabolomic analyses were performed on samples from pre- and post-dura violation (Fig. 1A). In total, a total of 131 metabolites were identified (Supplemental Digital Content 3, https://links.lww.com/TA/D170) with significant changes in the metabolomic profile pre- and post-dura violation (Supplemental Digital Content 2, https://links.lww.com/TA/D169, Fig. 1). Key increases in serine biosynthesis and carnitine and fatty acid metabolism and decreases in glycolysis, TCA cycle, GSH homeostasis, urea cycle, sulfur metabolism, indole and tryptophane, and glycerophospholipid biosynthesis were observed.
 Figure 1:
 Depiction of samples drawn pre- and post-dura violation (A), partial least square discriminant analysis (B), and hierarchical clustering map of the top 25 significant changes (C).
Compared to pre-dura violation (Supplemental Digital Content 2, https://links.lww.com/TA/D169), there were significant increases in amino acid l-cysteine (amino acid), nucleotide 5-6-dihydrothymine, serine biosynthesis metabolite 5, adenosyl-l-homocysteine, arginine and proline metabolite tissue creatinine, and carnitine and fatty acid metabolite 0-decenoyl-l-carnitine. In contrast, there were also significant decreases in a myriad of metabolites, including several amino acids (l-histidine, l-lysine, l-tyrosine), nucleotides (IDP, allantoate, nicotinamide, glycolytic metabolite pyruvate, TCA cycle metabolite oxaloacetate, GSH metabolite dehydroascorbate, serine biosynthesis metabolite 5-adenosyl-l-methionine, urea cycle metabolites (ornithine, l-citrulline), arginine and proline metabolites (4-acetamidobutanoate, guanidinoacetate), sulfur metabolite 3-sulfocatechol, indole and tryptophan metabolite (5-hydroxyindoleacetate, g-oxalocrotonate), glycerophospholipid biosynthesis metabolites (sphingosine, sphingosine-1-phosphate, acetylcholine, sphinganine-1-phosphate), and essential fatty acid metabolites (dodecanoic acid, tetradecanoic acid).
To make better sense of the metabolomic data, partial least square discriminant analysis was performed to separate pre- versus post-dura violation samples (Fig. 1B). Results informed the hierarchical clustering map of the top 25 significant changes in Figure 1C. Specifically, top significant metabolites are noted upon normalization of post-dura violation data to baseline values in the volcano plot in Figure 2A. Most significant changes were noted for metabolites involved in late glycolysis/entrance to the Krebs cycle in mitochondria (pyruvate, oxaloacetate, citrate), cysteine and one carbon metabolites (S-adenosyl-methionine [SAM] and S-adenosyl-homocysteine [SAH]), and metabolites involved in endothelial dysfunction/arginine metabolism/responses to hypoxia (ornithine, sphingosine 1-phosphate; Fig. 2B).
 Figure 2:
 Top significant metabolites noted upon normalization of post-dura violation data to baseline values in volcano plot (A), with selected most significant changes (B).
On correlation analysis with the thrombelastographic evidence, several metabolites significantly positively correlated with MA (Fig. 3), specifically several fatty acids (12:0, p = 0.63 and 22:6, p = 0.61, p < 0.001 for both).
 Figure 3:
 Metabolome wide correlates to TEG MA, LY30, R parameters. (A) Raw metabolomics data was correlated with separate TEG parameters independently for “pre” and “post” time points using the Spearman method. Significant correlates (p < 0.05) are colored, while insignificant hits remain gray. Coloring of significant hits were dictated by the respective TEG parameter as described in the legend. Blue corresponded to MA, gold corresponded to LY30 (after MA), and orange corresponded to R (reaction time, time to clot formation). The correlation results from each time point were plotted together and differentiated by shape. Such that, “pre” was represented with a triangle and “post” was represented with a circle. (B) Top correlates were selected for further analysis by linear regression. The line of best fit was colored by time point, teal for “pre” and red for “post.”
ProteomicsTo expand on the metabolomics analyses and provide additional mechanistic insights on the TBI-associated coagulopathy, proteomic analyses were performed on samples from pre- and post-dura violation. In total, a total of 233 proteins were identified (Supplemental Digital Content 4, https://links.lww.com/TA/D171), which demonstrated significant changes in the proteomic profile pre- and post-dura violation, with key changes in a variety of proteins related to platelet degranulation and activation, intracellular calcium signaling, and fibrinolysis (Supplemental Digital Content 2, https://links.lww.com/TA/D169). Compared with pre-dura violation, there were significant increases in proteins responsible for platelet activation (including retinoic acid receptor responder protein 2, amyloid A1 metalloproteinase inhibitor-1, platelet glycoprotein Ib and V, clusterin, protease C1 inhibitor, CD109, alpha-1-antichymotryspin, inter-alpha-trypsin inhibitor heavy chain H3 and H4, kininogen-1, sulfhydryl oxidase 1, complement factor D, coagulation factor VII and X, serotransferrin, pro low-density lipoprotein receptor-related protein 1, fibrinogen alpha and beta chain) and fibrinolysis inhibition (protease C1 inhibitor, alpha-2-antiplasmin) and decreases in proteins responsible for fibrinolysis promotion (kallikrein, tetranectin, plasminogen). However, there were also significant decreases (whether due to consumption or decreases in release into circulation) in platelet activating and antifibrinolytic proteins including selenoprotein P, heat shock protein beta-1, hyaluronidase-1, thrombospandin-1, superoxide dismutase, coagulation factor V, XI, and XIII, platelet factor 4, platelet-activating factor acetylhydrolase, beta-2- and alpha-1B-glycoprotein, multimerin-1, platelet basic protein, fermitin, galectin-3-binding protein, alpha-1-acid-glycoprotein-1, carboxypeptidase B2, and vitronectin. While there were significant increases in several procoagulant, antifibrinolytic proteins, there were also increases in some proteins with an anticoagulant effect (such as antithrombin and tissue factor pathway inhibitor), highlighting the complexity of these protein profiles and the importance of interpretation of net effect.
On correlation analysis with thrombelastography, several proteins significantly positively correlated with MA (Fig. 4), specifically apolipoprotein C-1 (r = 0.63), platelet activating factor acetylhydrolase 1b subunit (p = 0.66), fibrinogen beta chain (r = 0.63), gamma chain (r = 0.60) and alpha chain (r = 0.62), matrix metallopeptidase 9 (r = 0.60), complement component C9 (r = 0.66), and fatty acid-binding protein 2 (r = 0.68) (p < 0.001 for all).
 Figure 4:
 Proteome wide correlates to TEG MA, LY30, R parameters. (A) Raw proteomics data was correlated with separate TEG parameters independently for “pre” and “post” time points using the Spearman method. Significant correlates (p < 0.05) are colored while insignificant hits remain gray. Coloring of significant hits were dictated by the respective TEG parameter as described in the legend. Blue corresponded to MA, gold corresponded to LY30 (after MA), and orange corresponded to R (reaction time, time to clot formation). The correlation results from each time point were plotted together and differentiated by shape. Such that, “pre” was represented with a triangle and “post” was represented with a circle. (B) Top correlates were selected for further analysis by linear regression. The line of best fit was colored by time point, teal for “pre” and red for “post.”
Tissue Factor ActivityThere were no statistically significant differences in tissue factor activity pre-dura violation versus post-dura violation (median, 5.1 fM; IQR, 1.5–30.6 fM vs. 5.2 fM; IQR, 2.7–18.0 fM; p = 0.98).
DISCUSSIONAfter dura violation, a systemic hypercoagulability is observed in TBI patients, characterized by increased clot strength, decreased fibrinolysis, and increased resistance to tPA. In addition, TBI and dura violation causes a unique metabolomic and proteomic phenotype. Systemic metabolism is affected by substrate-specific metabolic derangements, with increases in serine biosynthesis and carnitine and fatty acid metabolism and decreases in glycolysis, TCA cycle, GSH homeostasis, urea cycle, sulfur metabolism, indole and tryptophane, and glycerophospholipid biosynthesis. Further, the proteomic profile shifts to one with significant representation of proteins, which promote platelet activation and diminish fibrinolysis. These robust omic changes are not accompanied by changes in circulating tissue factor. These findings highlight the importance of consideration of tissue specific versus systemic hemostatic profiles, in which we describe patients with intracranial hemorrhage yet who develop a robust systemic hypercoagulability. This work adds to a growing body of literature developing deeper understanding of the coagulopathy and omics of TBI, challenging the paradigm that tissue factor drives TBI-related hypercoagulability.
In this prospective study, TBI after dura violation was associated with a conversion to a hypercoagulable state with increased clot strength. This contributes to previous works on the coagulopathy of TBI, which has been riddled with contradictory reports, highlighting clinical equipoise in understanding the hemostatic capacity derangements after this injury. While some reports have described hypocoagulopathy in TBI, other reports have found a hypercoagulability associated with head injury.2–4 It is worth mentioning that when hypocoagulopathic phenotypes of trauma-induced coagulopathy (TIC) in TBI are observed, it is often in patients taking anticoagulant or antiplatelet medications pre-injury.22 Moreover, TBI patients with a described hypocoagulopathy often present with a mixed picture of TBI with hemorrhagic shock or specific multiple trauma injury complexes.23,24 Our work describes a hypercoagulable coagulopathy of TBI, which adds to the ongoing mixed phenotypes described. Further, as is well known with TIC, it is a dynamic phenotype which changes over time; the reports of coagulopathy related to TBI likely have conflicting findings because TBI-related coagulopathy is also dynamic, with an accelerated onset as early as 12 hours after injury and as delayed as 5 days after injury.25 This time course has been classically described as an early picture of hypocoagulopathy and hyperfibrinolysis, which drives early intracranial hemorrhage progression, with subsequent conversion to a hypercoagulable, antifibrinolytic profile.26 The results of our work, however, highlight that derangement to hypercoagulability may occur within hours of injury and/or neurosurgical procedures, driven not by tissue factor release as previously thought and described in the DIC literature.27
Extensive literature examining the mechanism of TBI-related hypercoagulability suggests that inflammation plays a crucial role and may be mediated by activation of complement systems, endothelial shedding, protein C activation, von Willebrand factor (vWF) activity, brain-derived extracellular vesicles and extracellular vesicles from endothelial cells and platelets26; these pro-inflammatory and procoagulant proteins may be more pronounced after dura violation and neurosurgical procedures, leading to aberrant platelet activity. Our findings of significant increases in clot strength on thrombelastography after dura violation highlight the role of platelets in promoting the pathologic hypercoagulability of TBI, which has been suggested in previous works.8 This elevation of MA is similar in the numbers reports in previous works of trauma patients that has been linked to increased risk of thrombotic complications (MA, 71.9 mm in patients with thromboses vs. 68.5 mm in patients without thromboses, compared with 74.4 mm post-dura violation vs. 63.5 mm pre-dura violation in our patients),28 suggesting these changes observed in MA in our data have clinical significance. The increased platelet-mediated clot strength in our patients may be an important player in mitigating the locally hypocoagulopathic environment of hemorrhagic cerebrum, as evidenced by prior reports of higher maximum clot firmness (another viscoelastic metric of clot strength) in TBI survivors versus nonsurvivors29 and poorer outcomes in TBI patients with thrombocytopenia.30
Beyond the cellular contributions to the pathologic hypercoagulability of TBI, our data highlight an important transition to fibrinolytic shutdown and tPA resistance. There has been controversy in the literature as to whether TBI drives a hyperfibrinolytic or antifibrinolytic phenotype.31,32 In a prospective study of severely injured patients, Samuels et al.24 delineate differential coagulation phenotypes based on injury complexes; the authors ultimately found no evidence that TBI contributes to hyperfibrinolysis, suggesting that fibrinolytic shutdown may be more prevalent in patients with head injury, as found after dura violation in our population. Additional work by Cohen et al.33 also did not find hyperfibrinolysis in TBI patients without concomitant hypoperfusion and shock. In another prospective study of over 1,000 TBI patients, Meizoso et al.34 found that fibrinolysis shutdown was more common in TBI patients, occurring in up to one fourth of TBI patients, and when controlling for sex, injury mechanism, injury severity and shock, TBI independently decreased lysis at 30 minutes. As described in our work, this TBI-related fibrinolytic shutdown occurs as early as 1 hour after injury, perhaps as a reactive, compensatory mechanism. This association between fibrinolytic shutdown and TBI may ultimately be driven by tPA resistance and elevated PAI-1 levels.35 The process of an initial thrombin and fibrin burst following by conversion to fibrinolytic shutdown in TBI is further suggested by a gradual decrease in fibrinogen and D-dimer during the first 3 hours following brain injury,36 a distinct process from the tissue factor-drive DIC.
Previous metabolomic analyses of injured patients or animal models of traumatic injury have focused on the phenotypes provoked by hemorrhagic shock versus tissue injury,37 but a paucity of data has explored TBI, in particular in tandem with coagulation data. This literature gap is important, as multi-omics data extends relevance into the care of trauma patients and precision medicine; previous descriptions of omics highlight its importance for trauma surgeons in identifying diagnostic and therapeutic markers to assess response to interventions and inform clinically-decision making based on dynamic cellular and subcellular level processes.38 Our data describes increases in serine biosynthesis and fatty acid metabolism and consumption of critical metabolites in the glycolysis and TCA pathway, among others. This consumptive picture of the TCA cycle provides a compelling mechanistic explanation for why neuron-specific enolase, which converts 2-phosphoglycerate to phosphoenolpyruvate in glycolysis, serves as a marker of TBI which may be seen concomitantly with dura violation.39 A drastic increase in homocysteine was observed after dura violation in the setting of TBI, which bears clinical significance for several reasons. Homocysteine catabolism can be dysregulated by injury and stress, leading to neurotoxic effects. Tchantchou et al.40 found that hyperhomocysteinemic rats had increased oxidative stress, upregulated expression of hypercoagulable proteins, exacerbated blood-brain barrier dysfunction, infiltration of inflammatory cells into the cortex, and aggravated anxiety-related behaviors. Not only is homocysteine tied to neurotoxicity but is also associated with hypercoagulability via reduced antithrombin, endotheliopathy propagation, platelet dysfunction and hyperactivity, and diminished plasmin activity and fibrinolysis.41
As has been previously described in injury-associated hemorrhagic shock models,42 TBI promoted lipolysis and beta-oxidation of lipids, as suggested by an increase in fatty acid-acyl-carnitine O-decenoyl-l-carnitine (acyl-C10:1) and decreases in essential fatty acids dodecanoic acid (lauric acid) and tetradecanoic acid (myristic acid). Fatty acids have been established as important potential metabolite markers of severity of TBI, with medium-chain fatty acids, octanoic and decanoic acids, being highly associated with severity of injury.12 Not only do these changes in fatty acids have implications in neurotrauma, but fatty acids are also associated with prothrombotic effects.43
In addition to increased lipolysis metabolites, our data revealed decreases in citrulline, arginine, and proline metabolites, which has been described in previous TBI metabolomic investigations.44 These same changes have been observed in critically injured patients and those in hemorrhagic shock37 and linked to adverse clinical outcomes.45 These reductions in arginine ultimately lead to reduction in nitric oxide necessary to maintain cerebral perfusion. Further, ornithine, a crucial part of the arginine and nitric oxide pathway, was significantly decreased in TBI patients after dura violation, as seen in previous TBI literature.46 Ornithine is a substrate for ornithine decarboxylase for polyamine synthesis, with polyamines serving as markers of TBI and mediating fibrinolysis.47 Beyond fibrinolysis, ornithine has been described as a marker of endotheliopathy, competing with arginine as a substrate with nitric oxide synthase; the end result in the setting of TBI is that ornithine induces oxidative stress and decreases blood-brain barrier integrity.48 Creatinine, another important metabolite in the arginine and proline pathway, significantly increased after dura violation in our population; in a previous study aimed to identify predictors of coagulopathy in TBI and develop machine learning (ML) models to predict the risk of coagulopathy, Yang et al. found that creatinine was a core component in contributing to prediction of coagulopathy in TBI patients.1
To complement the metabolomic data which characterizes a shift toward platelet hyperactivity and fibrinolysis shutdown, our proteomic data demonstrated key increases in proteins related to platelet activation, degranulation, and aggregation which correlated to thrombelastographic measurements of platelet activity. Examining the mechanisms and natural history of TBI has been recently empowered by proteomic data, which has further characterized the neuroinflammatory response to TBI.49 Our data describe significant changes in several proteins related to platelet activation and activation with positive correlations to measurements of clot strength, including apolipoproteins, which are also known to be involved in the neuroinflammatory response to brain injury.13 Other proteomic work describes significantly increased levels of proteins related to neutrophil degranulation and mobilization, which in sum with our work highlight a picture of pan-cellular hyperactivity and recruitment.49 The proteomic data additionally showed key increases in antiplasmin and fibrinogen, which correlated to hypercoagulability on thrombelastography. Fibrinogen is known to increase immediately after TBI before a precipitous decline and is believed to participate in destruction of the blood-brain barrier and neuroinflammation.36 The release of antiplasmin as a result of TBI may be a compensatory mechanism to mitigate intracerebral hemorrhage progression, as previous proteomic work has identified an inversed relationship between antiplasmin and progressive hemorrhagic injury.50
Limitations to this study include a reliance on steady-state measurements for the omic observations; therefore, conclusions on aberrant metabolic fluxes through glycolysis, Krebs cycle, purine oxidation, and fatty acid/amino acid oxidation, in addition to protein cascades, will require further validation with flux analysis studies based on incubation with stable isotope-label tracers. Another limitation is the lack of control patients, specifically TBI patients who do not undergo neurosurgical procedures, however this study focused on our specific cohort as we are most interested in patients who had dura violation, which we think this is part of the mechanism driving TBI-related systemic hypercoagulability. Lastly, this TBI cohort is heterogeneous in the neurosurgical intervention (a minority underwent EVD or bolt instead of craniotomy), which may affect our interpretation of how dura violation impacts coagulation.
In conclusion, in this prospective study of TBI patients undergoing neurosurgical procedures, there is a robust conversion to a hypercoagulable phenotype, accompanied with a drastic shift in the metabolomic and proteomic profile. These changes happen early and rapidly after injury and procedures, independent of tissue factor, and highlight cause for caution in resuscitation of TBI patients with procoagulant agents. Further, these data demonstrate that while a patient may be locally hypocoagulable in the setting of a traumatic brain hemorrhage, this does not necessarily signify a systemic coagulation concordance; thus, while TBI patients may have an organ-specific hypocoagulable, hyperfibrinolytic profile, systemic hypercoagulability and fibrinolytic shutdown predominate. As such, these data contextualize why early venous thromboembolism prophylaxis is reasonable early in many TBI patients. Ultimately, these data highlight the systemic hypercoagulability of TBI after dura violation, with procoagulant metabolites leading to increased clot strength, decreased clot breakdown, and tPA resistance which represents a unique and previously undescribed phenotype after trauma unrelated to tissue factor as once was previously thought. Further, these data highlight the potential role for omics as a tool to identify early metrics of pathologic hypercoagulability in TBI and guide precision medicine to mitigate thrombotic morbidity. Additional work is merited to further delineate the relationship between these observations.
AUTHORSHIPJRC performed the literature search, data collection, data analysis, writing, and critical revision. A.D'A., I.LC., M.D., F.G., W.R., C.C.S, M.J.CC. contributed to the study design, data interpretation, writing, and critical revision. P.L. and S.M. contributed to data collection, data analysis, and critical revision.
ACKNOWLEDGMENTResearch reported in this publication was supported by the National Institute of General Medical Sciences of the National Institutes of Health (T32 GM008315 and P50 GM049222). The content is solely the responsibility of the authors and does not necessarily represent the official views of the National Institutes of Health or other sponsors of the project.
DISCLOSUREThe authors declare no conflicts of interest.
REFERENCES 1. Yang F, Peng C, Peng L, Wang J, Li Y, Li W. A machine learning approach for the prediction of traumatic brain injury induced coagulopathy. Front Med. 2021;8:792689. 2. Hubbard WB, Dong JF, Cruz MA, Rumbaut RE. Links between thrombosis and inflammation in traumatic brain injury. Thromb Res. 2021;198:62–71. 3. Di Battista AP, Rizoli SB, Lejnieks B, Min A, Shiu MY, Peng HT, et al. Sympathoadrenal activation is associated with acute traumatic coagulopathy and endotheliopathy in isolated brain injury. Shock. 2016;46(3 Suppl 1):96–103. 4. Lee TH, Hampton DA, Diggs BS, McCully SP, Kutcher M, Redick BJ, et al. Traumatic brain injury is not associated with coagulopathy out of proportion to injury in other body regions. J Trauma Acute Care Surg. 2014;77(1):67–72; discussion 72. 5. Abdelmalik PA, Boorman DW, Tracy J, Jallo J, Rincon F. Acute traumatic coagulopathy accompanying isolated traumatic brain injury is associated with worse long-term functional and cognitive outcomes. Neurocrit Care. 2016;24(3):361–370. 6. Yasui H, Donahue DL, Walsh M, Castellino FJ, Ploplis VA. Early coagulation events induce acute lung injury in a rat model of blunt traumatic brain injury. Am J Physiol Lung Cell Mol Physiol. 2016;311(1):L74–L86. 7. Labbadia R, Diomedi Camassei F, Antonucci L, Guzzo I, Muda OA, et al. Reversible glomerular damage in disseminated intravascular coagulation. Pediatr Transplant. 2022;26(1):e14147. 8. Fletcher JJ, Kade AM, Sheehan KM, Wilson TJ. A case-cohort study with propensity score matching to evaluate the effects of mannitol on venous thromboembolism. J Clin Neurosci. 2014;21(8):1323–1328. 9. Halpern CH, Reilly PM, Turtz AR, Stein SC. Traumatic coagulopathy: the effect of brain injury. J Neurotrauma. 2008;25(8):997–1001. 10. Hubbard WB, Sim MMS, Saatman KE, Sullivan PG, Wood JP. Tissue factor release following traumatic brain injury drives thrombin generation. Res Pract Thromb Haemost. 2022;6(4):e12734. 11. Suehiro E, Fujiyama Y, Kiyohira M, Motoki Y, Nojima J, Suzuki M. Probability of soluble tissue factor release lead to the elevation of D-dimer as a biomarker for traumatic brain injury. Neurol Med Chir. 2019;59(2):63–67. 12. Posti JP, Dickens AM, Orešič M, Hyötyläinen T, Tenovuo O. Metabolomics profiling as a diagnostic tool in severe traumatic brain injury. Front Neurol. 2017;8:398. 13. Lindblad C, Pin E, Just D, Nimer FA, Nilsson P, Bellander B, et al. Fluid proteomics of CSF and serum reveal important neuroinflammatory proteins in blood-brain barrier disruption and outcome prediction following severe traumatic brain injury: a prospective, observational study. Crit Care. 2021;25(1):103. 14. Huibregtse ME, Bazarian JJ, Shultz SR, Kawata K. The biological significance and clinical utility of emerging blood biomarkers for traumatic brain injury. Neurosci Biobehav Rev. 2021;130:433–447. 15. Genét GF, Ostrowski SR, Sørensen AM, Johansson PI. Detection of tPA-induced hyperfibrinolysis in whole blood by RapidTEG, KaolinTEG, and functional fibrinogen TEG in healthy individuals. Clin Appl Thromb Hemost. 2012;18(6):638–644. 16. Kupesiz A, Rajpurkar M, Warrier I, Hollon W, Tosun O, Lusher J, et al. Tissue plasminogen activator induced fibrinolysis: standardization of method using thromboelastography. Blood Coagul Fibrinolysis. 2010;21(4):320–324. 17. Moore HB, Moore EE, Chapman MP, Huebner BR, Einersen PM, Oushy S, et al. Viscoelastic tissue plasminogen activator challenge predicts massive transfusion in 15 minutes. J Am Coll Surg. 2017;225(1):138–147. 18. Moore HB, Moore EE, Huebner BR, Dzieciatkowska M, Stettler GR, Nunns GR, et al. Fibrinolysis shutdown is associated with a fivefold increase in mortality in trauma patients lacking hypersensitivity to tissue plasminogen activator. J Trauma Acute Care Surg. 2017;83(6):1014–1022. 19. Nemkov T, Reisz JA, Gehrke S, Hansen KC, D'Alessandro A. High-throughput metabolomics: isocratic and gradient mass spectrometry-based methods. Methods Mol Biol. 1978;2019:13–26. 20. LaCroix IS, Cohen M, Moore EE, Dzieciatkowska M, Nemkob T, Schaid TR Jr., et al. Omics markers of red blood cell transfusion in trauma. Int J Mol Sci. 2022;23(22):13815. 21. D'Alessandro A, Nemkov T, Moore HB, Moore EE, Wither M, Nydam T, et al. Metabolomics of trauma-associated death: shared and fluid-specific features of human plasma vs lymph. Blood Transfus. 2016;14(2):185–194. 22. Böhm JK, Güting H, Thorn S, Schäfer N, Rambach V, Schöchl H, et al. Global characterisation of coagulopathy in isolated traumatic brain injury (iTBI): a CENTER-TBI analysis. Neurocrit Care. 2021;35(1):184–196. 23. Martin G, Shah D, Elson N, Boudreau R, Hanseman D, Pritts TA, et al. Relationship of coagulopathy and platelet dysfunction to transfusion needs after traumatic brain injury. Neurocrit Care. 2018;28(3):330–337. 24. Samuels JM, Moore EE, Silliman CC, Banerjee A, Cohen MJ, Ghasabyan A, et al. Severe traumatic brain injury is associated with a unique coagulopathy phenotype. J Trauma Acute Care Surg. 2019;86(4):686–693. 25. Lustenberger T, Talving P, Kobayashi L, Inaba K, Lam L, Plurad D, et al. Time course of coagulopathy in isolated severe traumatic brain injury. Injury. 2010;41(9):924–928. 26. Fletcher-Sandersjöö A, Thelin EP, Maegele M, Svensson M, Bellander BM. Time course of hemostatic disruptions after traumatic brain injury: a systematic review of the literature. Neurocrit Care. 2021;34(2):635–656. 27. Wada T, Shiraishi A, Gando S, Yamakawa K, Fujishima S, Saitoh D, et al. Disseminated intravascular coagulation immediately after trauma predicts a poor prognosis in severely injured patients. Sci Rep. 2021;11(1):11031. 28. Coleman JR, Kay AB, Moore EE, Moore HB, Gonzalez E, Majercik S, Cohen MJ, White T, Pieracci FM. It’s sooner than you think: blunt solid organ injury patients are already hypercoagulable upon hospital admission—results of a bi-institutional, prospective study. Am J Surg. 2019;218(6):1065–1073. 29. Schöchl H, Solomon C, Traintinger S, Nienaber U, Tacacs-Tolnai A, Windhofer C, et al. Thromboelastometric (ROTEM) findings in patients suffering from isolated severe traumatic brain injury. J Neurotrauma. 2011;28(10):2033–2041. 30. Lillemäe K, Luostarinen T, Reinikainen M, Bendel S, Laitio R, Hoppu S, et al. Early thrombocytopenia is associated with an increased risk of mortality in patients with traumatic brain injury treated in the intensive care unit: a Finnish Intensive Care Consortium study. Acta Neurochir. 2022;164(10):2731–2740. 31. Fair KA, Farrell DH, McCully BH, Rick EA, Dewey EN, Hilliard C, et al. Fibrinolytic activation in patients with progressive intracranial hemorrhage after traumatic brain injury. J Neurotrauma. 2021;38(8):960–966.
Comments (0)