Instruments
The Wellbeing Related option-Freedom instrument (WeRFree) instrument is a newly developed instrument that shows the benefits of developing surveys with a comprehensive conceptualization of the concept of “capability” [33]. The WeRFree instrument consists of 3 scales with a total of 15 items that measure health-related capabilities and subjective well-being [33]. These three scales represent different elements of capability – and subjective well-being. Capability well-being is captured with the “perceived access to options” scale and consists of five items measuring various aspects of health-related capabilities. Different elements of how people experience living with those capabilities are captured with the reflective wellbeing (six items) and affective wellbeing (four items) scales. All items follow a Likert scale format, with response options ranging from four to eleven categories. Depending on the construct, items inquire about the extent that individuals feel satisfied with various aspects of their lives (from completely dissatisfied to completely satisfied), whether they disagree with certain statements (from strongly disagree to strongly agree), whether they experienced certain emotions over the last four weeks (e.g. from all of the time to none of the time), and whether individuals can complete certain tasks (e.g. whether an individual can do tasks very quickly and efficiently without any help to not being able to do these tasks themselves). The WeRFree instrument was developed by matching items from the Multi-Instrument-Comparison (MIC) study database with constructs from an earlier developed theoretical framework by the authors [33, 34]. Further information about the (theoretical) background of the instrument can be found in [22, 33, 34].
The ICEpop CAPability measure for Adults (ICECAP-A) is an instrument that was developed to assess the capability well-being of adults [35, 36]. The ICECAP-A measures capabilities in five domains: stability, attachment, autonomy, achievement, and enjoyment. Each of these domains consists of a single item, with each item having four response options. Each item inquires about the level of capability, ranging from no capability (I cannot…, I am unable…) to full capability (I can…, I am able to…). Together, these items reflect the capability well-being of individuals. The domains and items were developed through interviews with the general population of England [35]. Evidence indicates that the instrument shows construct validity, content validity and responsiveness in a number of different populations [25].
Data
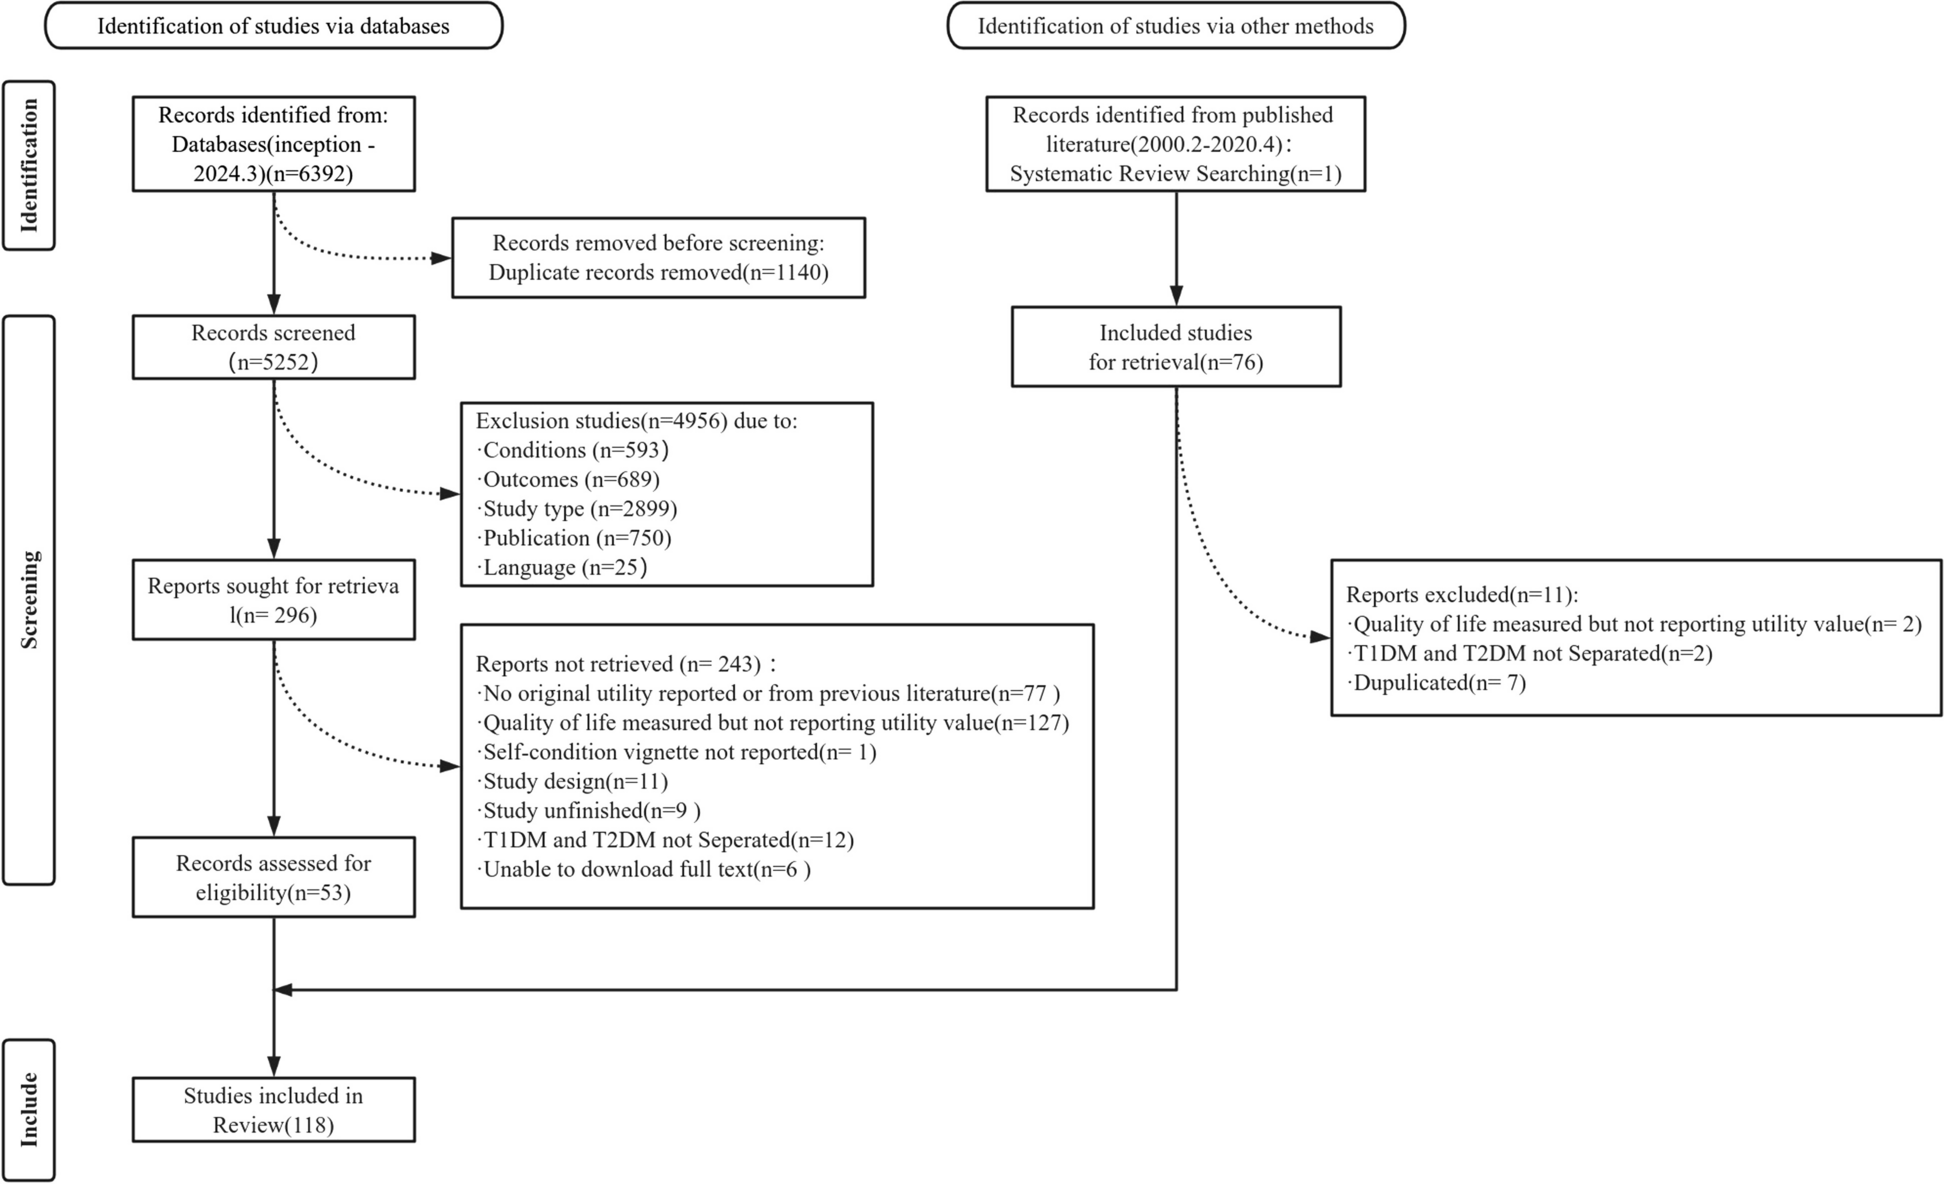
For this study, the MIC study database was used [37]. The MIC study had the objective to analyze and compare a set of HRQoL and well-being instruments. The general questionnaire of this study consisted of eleven such instruments. Following a cross-sectional design, the study was conducted in six countries: Australia, Canada, Germany, Norway, the United Kingdom, and the USA. A total of 9665 respondents participated in completing the general questionnaire. Informed consent was obtained from all individual participants included in the study. Individuals were recruited with nine different health conditions: arthritis, asthma, cancer, depression, diabetes, hearing problems, heart problems, stroke, and obstructive pulmonary disease. Additionally, a group of healthy individuals was recruited. Unreliable responses were removed from the database by the MIC study team. Responses were deemed unreliable if they showed inconsistencies in responses (i.e. between items that are similar) and if respondents took too little time to complete the general questionnaire. After the removal of these responses, the MIC study database consisted of 8022 observations. Further information about the MIC study can be found on the website of the project [38]. Concerning the analysis of the ICECAP-A, all the responses of the MIC database were used, except those from Norway, since in Norway the ICECAP-A instrument was not administered. For measurement invariance testing, different subsamples were created based on the characteristics of the participants. Participants were grouped according to their age, level of education, gender, and health condition. Measurement invariance was then tested in each of these subsamples with the WeRFree and ICECAP-A instruments.
Analyses
Before conducting a measurement invariance study, the dimensionality of instruments needs to be studied. This was done through a confirmatory factor analysis (CFA). Model fit was considered acceptable when the following fit index values reached certain values: Comparative Fit Index (CFI) with a value higher than 0.900, Tucker-Lewis Index (TLI) with a value higher than 0.900, Root Mean Square Error of Approximation (RMSEA) with a value lower than 0.08, and Standardized Root Mean Square Residual (SRMR), with a value lower than 0.08 [39,40,41]. The model fit of the WeRFree instrument with the MIC data has been presented in an earlier study that further explains how the instrument was developed [33]. In the case of the ICECAP-A, we followed the approach of Rencz, Mitev [26] and conducted a CFA to study the dimensionality of the ICECAP-A, for which we assumed that the five items reflect one construct: capability wellbeing. Additionally, the Cronbach’s alpha was computed, with a cut-off value of > 0.7 deemed acceptable.
A multi-group CFA was conducted to test for four different types of measurement invariance: (1) configural invariance, (2) metric (or weak factorial) invariance, (3) scalar (or strong factorial) invariance, and (4) residual (or strict) invariance [41,42,43,44]. These types were tested sequentially since for each type of measurement invariance a different model is constructed that is more restrained than the last model.
An instrument is (1) configural invariant if its factorial structure can be reproduced in different groups. In the case of the current study, this would for example mean that the three-factor structure of the WeRFree instrument can be replicated in different groups. When configural invariance can be established, (2) metric invariance can be tested [41, 42]. An instrument is metric invariant when the factor loadings are invariant across different groups. The factor loading represents the strength of the relationship between a construct and an item, or, in other words, how far a change in a construct influences the response to an item from an individual. Invariant factor loadings indicate that the constructs influence changes in item scores in the same way in different groups. The third type of invariance that is tested for in this study is (3) scalar invariance. An instrument is scalar invariant when the intercepts of each item are the same across different health conditions. Once scalar invariance is established, it is possible to compare the mean scores of the scales between different groups [41, 42]. Lastly, the (4) residual invariance properties were studied. Essentially, this means that the residuals of the items are similar across different groups. This indicates that the mean differences in scale scores that can be observed between groups are a result of differences in the latent construct and are not caused by other factors [41, 42]. This provides additional confidence that the difference in mean scores is indeed driven by differences in the latent construct of interest and not by other unmeasured constructs [41, 42].
In the current analysis, for both the WeRFree instrument and the ICECAP-A, mean factor scores will be presented. Furthermore, for the WeRFree instrument, adjusted scale scores are presented. Due to the varying number of response categories of the items, scale scores were normalized by dividing the number of response categories of items by their respective length (e.g. an item with a score from 0 to 3 was divided by 3), multiplying that score by 100, and dividing that score by the number of items in a scale to ensure that the score of each item contributed equally to the overall score of scale. Also ICECAP-A scores are presented, with raw index values being adjusted according to the United Kingdom tariff developed by Flynn, Huynh [36]. This score ranges from zero to one, with a zero reflecting a state of no capability and a one a state of full capability [36].
Various fit indices were used to establish measurement invariance. The following fit index values were used to establish configural fit: CFI with a value higher than 0.900, RMSEA with a value lower than 0.08, and SRMR with a value lower than 0.08 [39,40,41]. To study the other forms of measurement invariance, we followed the suggested fit index values by Chen [41] for group sizes that are equal to or larger than 300, because the sample sizes of the groups in the different subsamples are larger than 300. For further measurement invariance testing, the ΔCFI, the ΔRMSEA, and the ΔSRMR fit indices were used. A score of ≥ 0.010 in ΔCFI, ≥ 0.015 in ΔRMSEA, and a score of ≥ 0.030 in SRMR indicated noninvariance regarding metric invariance. Scores of ≥-0.010 in ΔCFI, ≥ 0.015 in ΔRMSEA, and ≥ 0.010 in SRMR were used as an indication of noninvariance regarding scalar and residual invariance. The chi-square difference test was not used to assess and compare model fit, because of the large sample sizes of the subsamples, which would result in trivial differences in model fit being flagged as significant [41].
For the analysis presented in this manuscript, the Lavaan package was used in R [45]. Because some response options of some of the items included in this study received close to no responses, it was decided not to use polychoric correlations, since in such cases correlations could be estimated incorrectly, which affects the estimation of parameters of CFA models [46]. Instead, Pearson correlations were used for model estimation, given that the sample sizes in each group were reasonably large (the smallest group had more than 500 observations, see Table 1) and that the number of response options for the items was generally larger than five. In such conditions, authors have argued that data can be treated as continuous [47, 48]. For the same reasons, it was decided to estimate the models with a maximum likelihood estimator [47, 49]. In these estimates, missing data were handled through a full information maximum likelihood estimation of the models [50].


Comments (0)