Study design
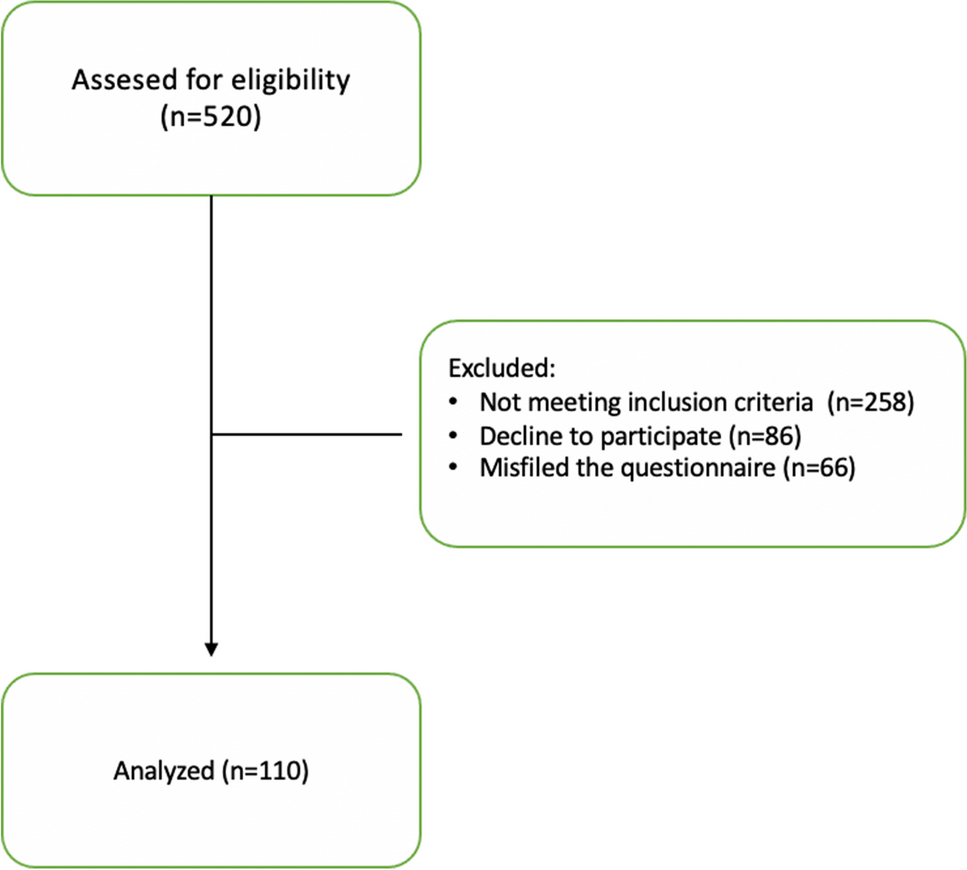
Mexican adults participated in this cross-sectional analytical study in an outpatient clinic-based sample physician-diagnosed with T2D. This was a convenience sample of adult population. We divided them into two groups according to the type of recruitment: (a) We used a community-based approach which entailed several different strategies to recruit participants (e.g., use of social media) and (b) patients of Diabetes Clinic at the “Adolfo López Mateos” Medical Center were invited. Patients were recruited from February to July 2022. The study included 230 participants.
The inclusion criteria for this study were as follows: (1) males and females, aged + 18; (2) diagnosed with type 2 diabetes for at least 1 month or more; (3) Mexican nationality and living in Mexico; (4) under medical care for diabetes in Mexico; (5) able to read and write Spanish to complete the forms, questionnaires, and tests; (6) access to the internet website; and (7) acceptance to participate in this study. The exclusion criteria were based on self-reports from participants of the following: (1) physical and/or mental conditions that obstruct participation; (2) incapacity to obtain reliable information; and (3) complications of T2D that interfered with or modified medical treatment as renal disease or replacement therapy.
Data collection: e-Health
The tool e-Health was used for data collection through a website with web-based questionnaires/tests from paper-based tools. The patients were instructed on how to access online to fill out the questionnaires/tests. Each patient’s data was collected with the help of a major questionnaire divided into 3 sections: identification data, reported dietary data, and tests. Participants who did not know how to fill in were interviewed through video call. They received regular communication from the team through newsletters, reminder emails, and reminder texts for completion. Survey data collector kept records in the cloud, computing them until their analyses. Acceptability of the website was measured by the total of invitations, time using the website, incomplete questionaries, and rejection to participate in the study [17].
Obtaining dietary information and creating the Dietary Inflammatory Index
We evaluated dietary intakes based on a validated paper-based Food Frequency Questionnaire (FFQ) migrated to web-based [18, 19]; validity of a web-based FFQ has previously been reported [20]. We constructed, with the use of images for portion size estimation and multiple options, a web-based questionnaire which contained 160 food items combining the characteristics of a typical Mexican diet with multiple possible answers, divided into 8 sections. Possible answers indicated the frequency of consumption of each food in relative frequency (never, almost, and always) and absolute frequency (times per month, week, day). Kind and type of meals and foods were evaluated by quantifiers (e.g., cups, glasses, plates, portions) to obtain the amount of the food consumed. We applied a 24-h recall from three different days to contrast information. Dietary intake and nutrient composition were analyzed by ESHA’s Food Processor® Nutrition Analysis software version 11.2.23 (ESHA Research©, Oregon, USA). Additionally, we evaluated the composition of Mexican foods through the Database of Mexican Foods Composition (“BAM”) version 18.1.1(INSP, Mexico) [21] and polyphenol intake using the USDA Database for the Flavonoid Content of Selected Foods Release 3.0 [22] in combination with the Phenol Explorer Database version 3.6 [23].
Calculation of the DII score was obtained by computing the amounts of nutrients collected using the FFQ and transformed into intakes of food parameters from the individual diet composition. The DII development has been described elsewhere [13]. As result of calculation of the DII, we obtained individual scores and the inflammatory potential of the diet. According to composite global database and global scores, the scale of the DII score of the maximal pro-inflammatory diet was interpreted at + 7.98, the maximal anti-inflammatory DII score was interpreted at − 8.87, and the neutral/transition effect was at + 0.23.
Tests applied on study populationProfile of psychological stress
We evaluated stress variables, with measurements made with two instruments, the first one assesses perceived stress (PSS-14) [24], interpreted as very low stress (0 to 15 points) and high stress (16 to 21 points); the second tool evaluates the stress caused by diabetes and types of distress, the Diabetes Distress Scale-17 (DSS), that pre-establishes items from four domains of diabetes-related distress: emotional burden distress subscale, physician-related distress subscale, regimen-related distress subscale, and diabetes-related interpersonal distress subscale [12]. We obtained interpretations from subscale scores. The total score of DSS was interpreted as psychological stress and categorized as low-moderate stress (≤ 2.9 mean item score) and high stress (≥ 3.0 mean item score) [25]. Spanish versions of the instruments were validated in Mexican people living with T2D previously [26, 27].
Assessing self-management and quality of life
The Diabetes Self-Management Questionnaire (DSMQ) was applied for glycemic control assessment, and the subscale glucose management from DSMQ was utilized. Glucose management and interpretation were categorized low effective management (scale ranging from 0 to 5) and more effective management (scale ranging from 6 to 10). The questionnaire was designed to assess self-care behaviors which can be related to the measure of HbA1c [28]. For the assessment of adherence to medical treatment, we tested with the 8-item Morisky Medication Adherence Scale (MMAS-8); adherence is determined according to the final score (total sum of 8 points) and categorized as adherence (total of 8 points) and no adherence (< 8 total points). We evaluated lifestyle domains utilizing the Instrument to measure lifestyle of type 2 diabetes mellitus patients (IMEVID). This tool explored barriers to diabetes self-management such as physical activity, smoking, type of diet, cooking capacity, and effort to eat well (also called the “healthy eater” effect due to the intention of careful, health-conscious people to choose meals). The total scores were obtained; the results were categorized into a rating system as favorable (≥ 80 total points) and unfavorable lifestyle (≤ 80 total points). These tools were validated in the Mexican population with T2D [29,30,31].
Statistical analyses
A descriptive analysis of the socio-demographic characteristics of the study population was performed, and we analyzed the differences by type of recruitment. Continuous variables are described in terms of averages and standard deviations (mean ± SD) or median (minimum–maximum); categorical variables were described by numbers and percentages. The χ2 test was used for interpreting categorical variables and Student’s t test was for continuous variables. Spearman’s correlation coefficient calculated the relation between diet and inflammation and stress response.
We constructed a dichotomous variable for analysis of the DII score, we divided the data into low-inflammatory scores (≤ 1.0) and high-inflammatory scores (> 1.0), and the χ2 test was used to examine associations between stress variables and the inflammatory diet. We used bivariate analysis to estimate the association between diabetes stress and DII score; we used a simple univariable (unadjusted) and multivariable logistic regression analysis adjusted for predictors of stress (age, sex, physical activity, smoking, and body mass index (BMI)). To assess possible effect modification, analyses stratified by sex and age were performed. Logistic regression analyses were used to calculate ORs and 95% CIs of DII concerning to diabetes stress. Two-tailed p values were utilized, where a p value less than 0.05 was deemed statistically significant. Analyses were performed using IBM® SPSS® Statistics software version 25.0 and Graphpad© Prism software version 9.4.1 for drawing plots and DAGitty software version 3.0 for drawing and analyzing the acyclic graph.
Sensitivity analysis: comparison with the Energy–Density Dietary Inflammatory Index
E-DII was created to improve the prediction of observed relations between overall consumption of dietary energy and nutrient intakes and densities that differ among the studied population to determine the diet’s overall inflammatory potential [14]. The energy-adjusted from every food parameter was expressed per thousand kilocalories (1000 kcal). The following 22 food parameters available for E-DII were used: carbohydrate; fiber; protein; total fat; saturated fat; monounsaturated fat; polyunsaturated fat; n-3 fatty acids; n-6 fatty acids; cholesterol; vitamins A, B1, B2, B3, B6, B12, C, D, and E; beta-carotene; folate; magnesium; iron; selenium; zinc; alcohol; and caffeine.
To explore whether E-DII provided a better adjustment to our multivariable-adjusted mixed model, we performed Spearman’s correlations between DII and E-DII, and we constructed E-DII quintiles; the ANOVA test was used to evaluate differences across quintiles, and the χ2 test was used to examine the distribution of qualitative variables over E-DII quintiles. Finally, we used EB subscale and E-DII potential confounding factors in the stratified analysis.


留言 (0)