Cell culture
Sol8 cells (mouse skeletal muscle progenitor cells) (Otwo Biotech, China) were cultured in a 6-well cell culture plate with high glucose Dulbecco’s modified eagle’s medium (H-DMEM, Gibco, USA) containing 10% fetal bovine serum (FBS, Gibco, USA) and 5% penicillin-streptomycin solution. Cells were placed in an incubator (5% CO2, 37 ℃). After 48 h of cultivation, cells were passaged at a 1:6 ratio.
Assessment of cytotoxicity and omics sample preparation (CCK-8)
Cell viability of Sol8 cells after exposure to ouabain (HY-B0542, MCE, USA) and veratrine (HY-N6691, MCE, USA) was evaluated by the CCK-8 assay. Experiment repeated independently 5 times. Ouabain (11018-89-6, 99.96%) and veratrine (71-62-5, 99.96%) were obtained from MedChemExpress (NJ, MCE), and dissolved in complete culture medium at a concentration of 10 µM and1 µM, respectively. Cells were seeded in 96-well plates (Thermo Fisher Scientific, USA) with a density of 2,000 cells/well, and cultured in 100 µL complete medium for 24 h. Subsequently, different doses of ouabain and veratridine solutions (0, 2, 4, 6, 8, and 10 µL) were added to each well, and then supplemented the complete medium to 100 µL. After 24 h of incubation, 10 µL CCK-8 (TIANGEN, China) was added to each well. The absorbance at 450 nm was measured using a microplate reader and cell viability was calculated. Finally, 5 µL ouabain and veratridine solution was selected to construct a Sol8 cell injury model according to the cell viability.
The effects of µ-CTX GIIIB on the Sol8 cell injury model were evaluated by CCK-8 assay. In brief, cells were seeded in 96-well plates (2,000 cells/well) for 24 h incubation. Blank control group, O/V group and experimental group were set up. The blank group was added with 100 µL complete medium. The O/V group and the experimental group were both added with 5 µL ouabain and veratridine solution, and the experimental groups were also supplemented with different doses of µ-CTX GIIIB (140678-12-2, Apeptide, China) solution (the final concentration was 0, 20, 40, 60, 80, 100, 200, 400, 600, 800 and 1000 nM). All wells were supplemented with medium to 100 ml. Subsequently, cell viability was calculated by CCK-8 assay.
RNA extraction, library preparation and Illumina Hiseq xten sequencing
Cells were seeded in 6-well plates with a density of 2 × 10⁵ cells/well, and cultured for 24 h. When reached about 60% confluency, cells were exposed to varying levels of the µ-CTX GIIIB (0 and 1 µM) for 24 h. Sol8 cells treated with 1 µM µ-CTX GIIIB were named as the experimental group, and treated with 0 µM µ-CTX GIIIB were named as the control group. Three replicate wells were set up for each group. Then, cells were collected using a cell scraper and subjected to transcriptome sequencing.
TRIzol (Invitrogen, USA) was used to extract total RNA from Sol8 cells. Genomic DNA was removed using DNA enzyme I (TaKara Bio Inc., Shiga, Japan), and then the quality and purity of total RNA was evaluated by ND-2000 (NanoDrop, Wilmington, DE, USA). RNA-sequencing transcriptome libraries were prepared using 1 µg total RNA (OD260/280 = 1.8–2.2, OD260/230 ≥ 2.0, RIN ≥ 6.5, 28 S:18 S ≥ 1.0, > 1 µg) and a TruSeq™ RNA Sample Preparation Kit (Illumina Inc. San Diego, CA, USA). The mRNA was separated by polyA selection using Oligo (dT) beads and fragment buffers. Then, a SuperScript double-strand cDNA synthesis kit (Invitrogen, USA) and random hexamer primer (Illumina, USA) were used to construct double-stranded cDNA, and terminal repair phosphorylation and A-base addition were performed. The 300 bp cDNA fragment was amplified by PCR using Phusion DNA polymerase (NEB, Ipswich, MA, USA) and quantified by TBS380. A 300 bp cDNA target fragment was screened for Phusion DNA polymerase (NEB, USA) PCR amplification with 15 PCR cycles. After TBS380 was quantified, an Illumina HiSeq XTEN /NovaSeq 6000 sequencer (2 × 150 bp reading length) was used to sequence the RNA-Seq library at the pair end. Finally, the RNA-Seq library was sequenced using the Illumina HiSeq XTEN /NovaSeq 6000 sequencer (2 × 150 bp reading length).
Read mapping
In order to control the quality, the original end readings were cut into pairs using SeqPrep (https://github.com/jstjohn/SeqPrep) and Sickle (https://github.com/najoshi/sickle). The directional patterns of reads were cleaned separately using HISAT2 (http://ccb.jhu.edu/software/hisat2/index.shtml) software and compared with the reference genome. Each example map was read by StringTie with a method based on a reference assembly.
Identification of DEGs
In order to screen the DEGs between the two samples, the expression level of each transcript was calculated according to the transcripts per million reads (TPM) method. Gene abundance was calculated based on quantitative analysis using RSEM (http://deweylab.biostat.wisc.edu/rsem/). In essence, using the Q value 0.05 DESeq2 differential expression analysis, when |log2FC| > 1 and Q value ≤ 0.05 (DESeq2 or EdgeR) /Q value ≤ 0.001 (DEGseq), the gene was considered to be significantly differentially expressed. In addition, the Gene Ontology (GO) annotation analysis is carried out by Goatools(https://github.com/tanghaibao/Goatools) and the Kyoto Encyclopedia of Genes and Genomes (KEGG) function enrichment analysis is carried out by KOBAS (http://kobas.cbi.pku.edu.cn/home.do) [17].
Quantitative real-time polymerase chain reaction (qRT-PCR)
To verify the accuracy of transcriptome data, seventeen genes were selected from the DEGs. And the remaining samples were used for qRT-PCR to verify the expression levels of nine genes. Table 1 shows the primers designed for the nine genes. cDNA was synthesized from RNA samples using HiScript Q-RT SuperMix and qRT-PCR was performed on an ABI7300 fluorescence quantitative PCR instrument (Bio-Rad, Hercules, CA, USA) and ChamQ SYBR Color qPCR (Vazyme Biotech, Nanjing, China). GAPDH was used as the reference gene for three replicates in each sample, and the relative fold changes of the expression levels of target genes in the samples were calculated by the 2−∆∆CT method.
Table 1 The primer sequences used for qRT-PCR
Proteomic analysisTotal protein extraction and digestion
Sol8 cells were resuspended with lysis buffer [1% sodium dodecylsulfate acid (SDS), 8 M urea and protease inhibitor] for 30 min. Vortex mixing was performed every 5 min and ultrasonication was performed for 2 min (40 kHz, 40 w). After centrifugation (30 min, 4℃ 16,000 × g), the supernatant was removed and protein was quantified using a BCA protein assay kit (Pierce, Thermo Fisher Scientific, Waltham, MA, USA). 100 µL of lysate was added to every 100 µg of extracted protein at 37℃, followed by 10 mM TCEP buffer, and the protein was incubated for 60 min. Finally, iodine acetamide (40 mM) was added. The mixture was incubated in the dark for 40 min.
TMT labeling and high pH RPLC separation
The sample protein was precipitated in a 6-time volume of cold acetone for 4 h under − 20 °C conditions. Then the sample was centrifuged at 10,000 g at 4 °C for 20 min, and recovered by addition of 10,000 µL triethylammonium bicarbonate (TEAB) buffer (50 mM, Sigma, USA). Trypsin solution (1:50, Promega, USA) was added to each sample tube, and incubated overnight at 37 °C. Next, TMT reagent (Thermofisher, USA) in 50 µL acetonitrile was added and labeled for 2 h at room temperature. After 15 min with hydroxylamine at room temperature, sample desalination was performed, followed by drying in vacuo.
The mixed labeled samples were subjected to ACQUITY Ultra Performance Liquid chromatography (Waters Corporation, Milford, MA, USA) and ACQUITY UPLC BEH C18 column (1.7 m, 2.1 mm 150 mm; Waters) was used for separation. Briefly, the polypeptides were separated by gradient elution (Phase A: 2% acetonitrile, pH 10; Phase B: 80% acetonitrile, pH 10) over 48 min at a flow rate of 0.2mL/min. The peptides were eluted using the following gradient: 0 ~ 1.9 min, 0 ~ 0% B; 1.9 ~ 2 min, 0 ~ 5% B; 2 ~ 17 min, 5 ~ 5% B; 17 ~ 18 min, 5 ~ 10% B; 18 ~ 35.5 min, 10 ~ 30% B; 35.5 ~ 38 min, 30 ~ 36% B; 38 ~ 39 min, 36 ~ 42% B; 39 ~ 40 min, 42 ~ 100%B; 40 ~ 44 min, 100% B; 44 ~ 45 min, 100 ~ 0% B; 45 ~ 48 min, 0% B. Twenty fractions were collected from each sample and then pooled to produce ten total fractions per sample.
LC-MS/MS analysis
Labeled peptides were analyzed using a 9rkfsg2_ncs-3500r system (Thermo, USA) in on-line nanoflow liquid chromatography tandem mass spectrometry connected to a Q Exactive Plus quadrupole orbital well mass spectrometer (Thermo, USA) via a nanoelectro-spray ion source. The peptide mixture was added into a C18 reversed-phase column (75 μm × 25 cm; Thermo, USA), and the peptides were eluted at a flow rate of 0.3mL/min. The mobile phases consisted of buffer A (2% acetonitrile with 0.1% formic acid) and buffer B (80% acetonitrile with 0.1% formic acid). The gradient elution program was as follows: 0–4 min, 0–5% B; 4–66 min, 5 − 23% B; 66–80 min, 23 − 29% B; 80 − 89 min, 29 − 38% B; 89–91 min, 38–48% B; 91–92 min, 48–100% B; 92–105 min, 100% B; 105–106 min, 100–0% B. The Q Exactive mass spectrometer can automatically switch between MS and MS/MS acquisition, because it operates in data-dependent mode. The automatic gain control (AGC) target at 3e6 and the maximum fill time at 20 ms and full scan MS spectra (350–1300 m/z) were acquired at a resolution of 70,000.
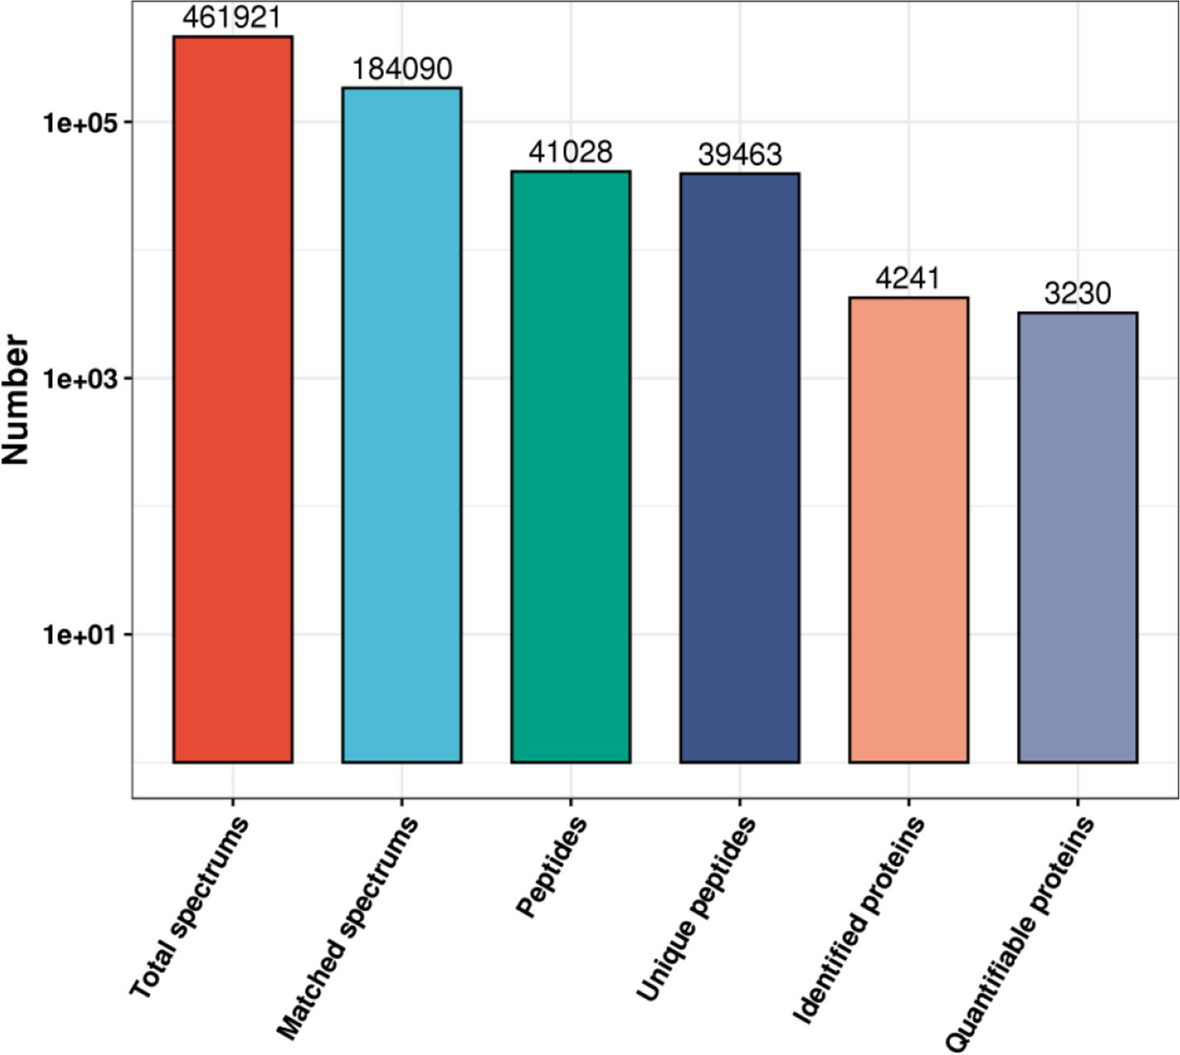
Protein identification
The raw data files were analyzed using ProteomeDiscoverer (Thermo Scientific, Version 2.2) against the Mus_musculus database (http://asia.ensembl.org/Mus_musculus/Info/Index, Assembly Version GRCm38, 67856s). The MS/MS search criteria were as follows: The mass tolerance was 10 PPM Da 0.02 ms and MS/MS, trypsin 2 leakage was allowed, urea cysteine methylation and TMT N-terminal and lysine side chain polypeptides were fixed modifications, and methionine oxidation was a dynamic modification. The false discovery rate (FDR) of peptide identification was set as FDR ≤ 0.01.
Statistical analyses
A total of 444 DEPs were obtained by the analysis and identification of proteomic data. Fold-change thresholds (> 1.2 or < 0.83) and p < 0.05 were applied to the screen for DEPs. We identified 121 upregulated and 323 downregulated proteins in the experimental group compared with the control group. All proteins identified were subjected to GO (http://www.blast2go.com/b2ghome; http://geneontology.org/) and KEGG pathway analysis (http://www.genome.jp/kegg/), and further analysis of the enrichment. Protein–protein interactions were analyzed using String V10.5.
Parallel reaction monitoring (PRM) mass spectrometry analysis
PRM analysis was used to examine the DEPs obtained from the TMT experiment. Seventeen DEPs were randomly selected for PRM validation. In PRM analysis, the same method as TMT experiment was used for protein extraction, digestion and mass spectrometry analysis, and the obtained data were analyzed and integrated by Skyline software [18].


留言 (0)