Cell lines
U1 (U937 cells latently infected with HIV-1) [14] and J-Lat (Jurkat cells latently infected with HIV-1) were generously provided by Shibo Jiang (Fudan University, Shanghai, China) and Jianqing Xu (Fudan University, Shanghai, China), respectively. U1, U937, J-Lat, and Jurkat cells were cultured in RPMI 1640 with 10% fetal bovine serum, 100 U/mL penicillin, and 100 mg/mL streptomycin (Thermo Fisher Scientific, Shanghai, China), under standard cell culture conditions. U1 and U937 cells were utilized for PM enrichment, flow cytometry detection, and experiments involved HIV-1 reactivation and lysosomotropic stimulation. The PM-enriched samples from U1 and U937 cells were further used for proteomic study and western blotting. In contrast, J-Lat and Jurkat cells were exclusively employed for PM enrichment, followed by western blot analysis.
Cell models for HIV-1 reactivation and lysosomotropic stimulation
In order to assess the effects of HIV-1 reactivation on LAMP2 protein expression, concentration- and time-dependent experiments were performed using panobinostat (404950-80-7, MedChemExpress LLC, Neaw Zealand, USA) (an HIV-1 reactivation agent [23]). Briefly, U1 and U937 cells (5 × 10⁵) were cultured in 12-well plates with 2 mL culture medium. Cells were exposed to panobinostat at a final concentration of 0, 10, or 25 nM for 24 h, or 25 nM for 0, 24, or 48 h. Cell supernatants were collected for HIV-1 p24 detection, while cells were collected for protein extraction with RIPA cell lysis buffer, followed by western blot detection of LAMP2 expression. Each group was seeded in three replicate wells, and the experiment was repeated twice.
Furthermore, to assess the relationship between LAMP2 expression and lysosome regulation, the cells were exposed to hydroxychloroquine (Laboratory of the Government Chemist, Luckenwalde, Germany) (a lysosomotropic agent) [24] at a final concentration of 0, 10, or 25 µM for 24 h, or 10 µM for 0, 24, or 48 h. The following detections were the same as those in panobinostat treatment, with supernatants for HIV-1 p24 detection and cells for western blot detection of LAMP2 expression.
Volunteer enrollment and sample collection
This study was reviewed and approved by the Ethics Committee of Shanghai Public Health Clinical Center (approval no.: 2017-Y037). Informed consents were obtained from all participants. Three groups of volunteers were enrolled, including: (1) latent HIV-1 infected patients [25] (n = 5) who had been treated with ART for at least six months and maintained a viral load of < 50 copies/mL [19]; (2) untreated HIV-1 infected patients (n = 5) who had not received ART and had a virus load exceeding 105 copies/mL; and (3) healthy volunteers without HIV-1 (n = 5). All participants were aged 18–65 years and had no history of cancer, pregnancy, breastfeeding, hepatitis B virus (HBV), HCV, and tuberculosis infection. Peripheral blood (5 mL) was collected into a K2EDTA anticoagulated tube and immediately used for the separation of resting CD4+ T cell.
Resting CD4+ T cell separation
Resting CD4+ T cells were enriched as described in our previous study [19]. Briefly, peripheral blood mononuclear cells (PBMC) were separated from blood using a Ficoll density centrifugation. Subsequently, CD4+ T cells were isolated by negative selection through incubating PBMC with anti-CD25/CD69/HLA-DR coated beads packed in a CD4+ T cell isolation kit (130-096-533, Miltenyi Biotec, Germany). The eluted fragments were collected as resting CD4+ T cells, which were then detected using a flow cytometry (Beckman, Florida, USA). These cells were stored at -80℃ for the validation of LAMP2 expression by mass spectrometry-based multiple reaction monitoring (MRM).
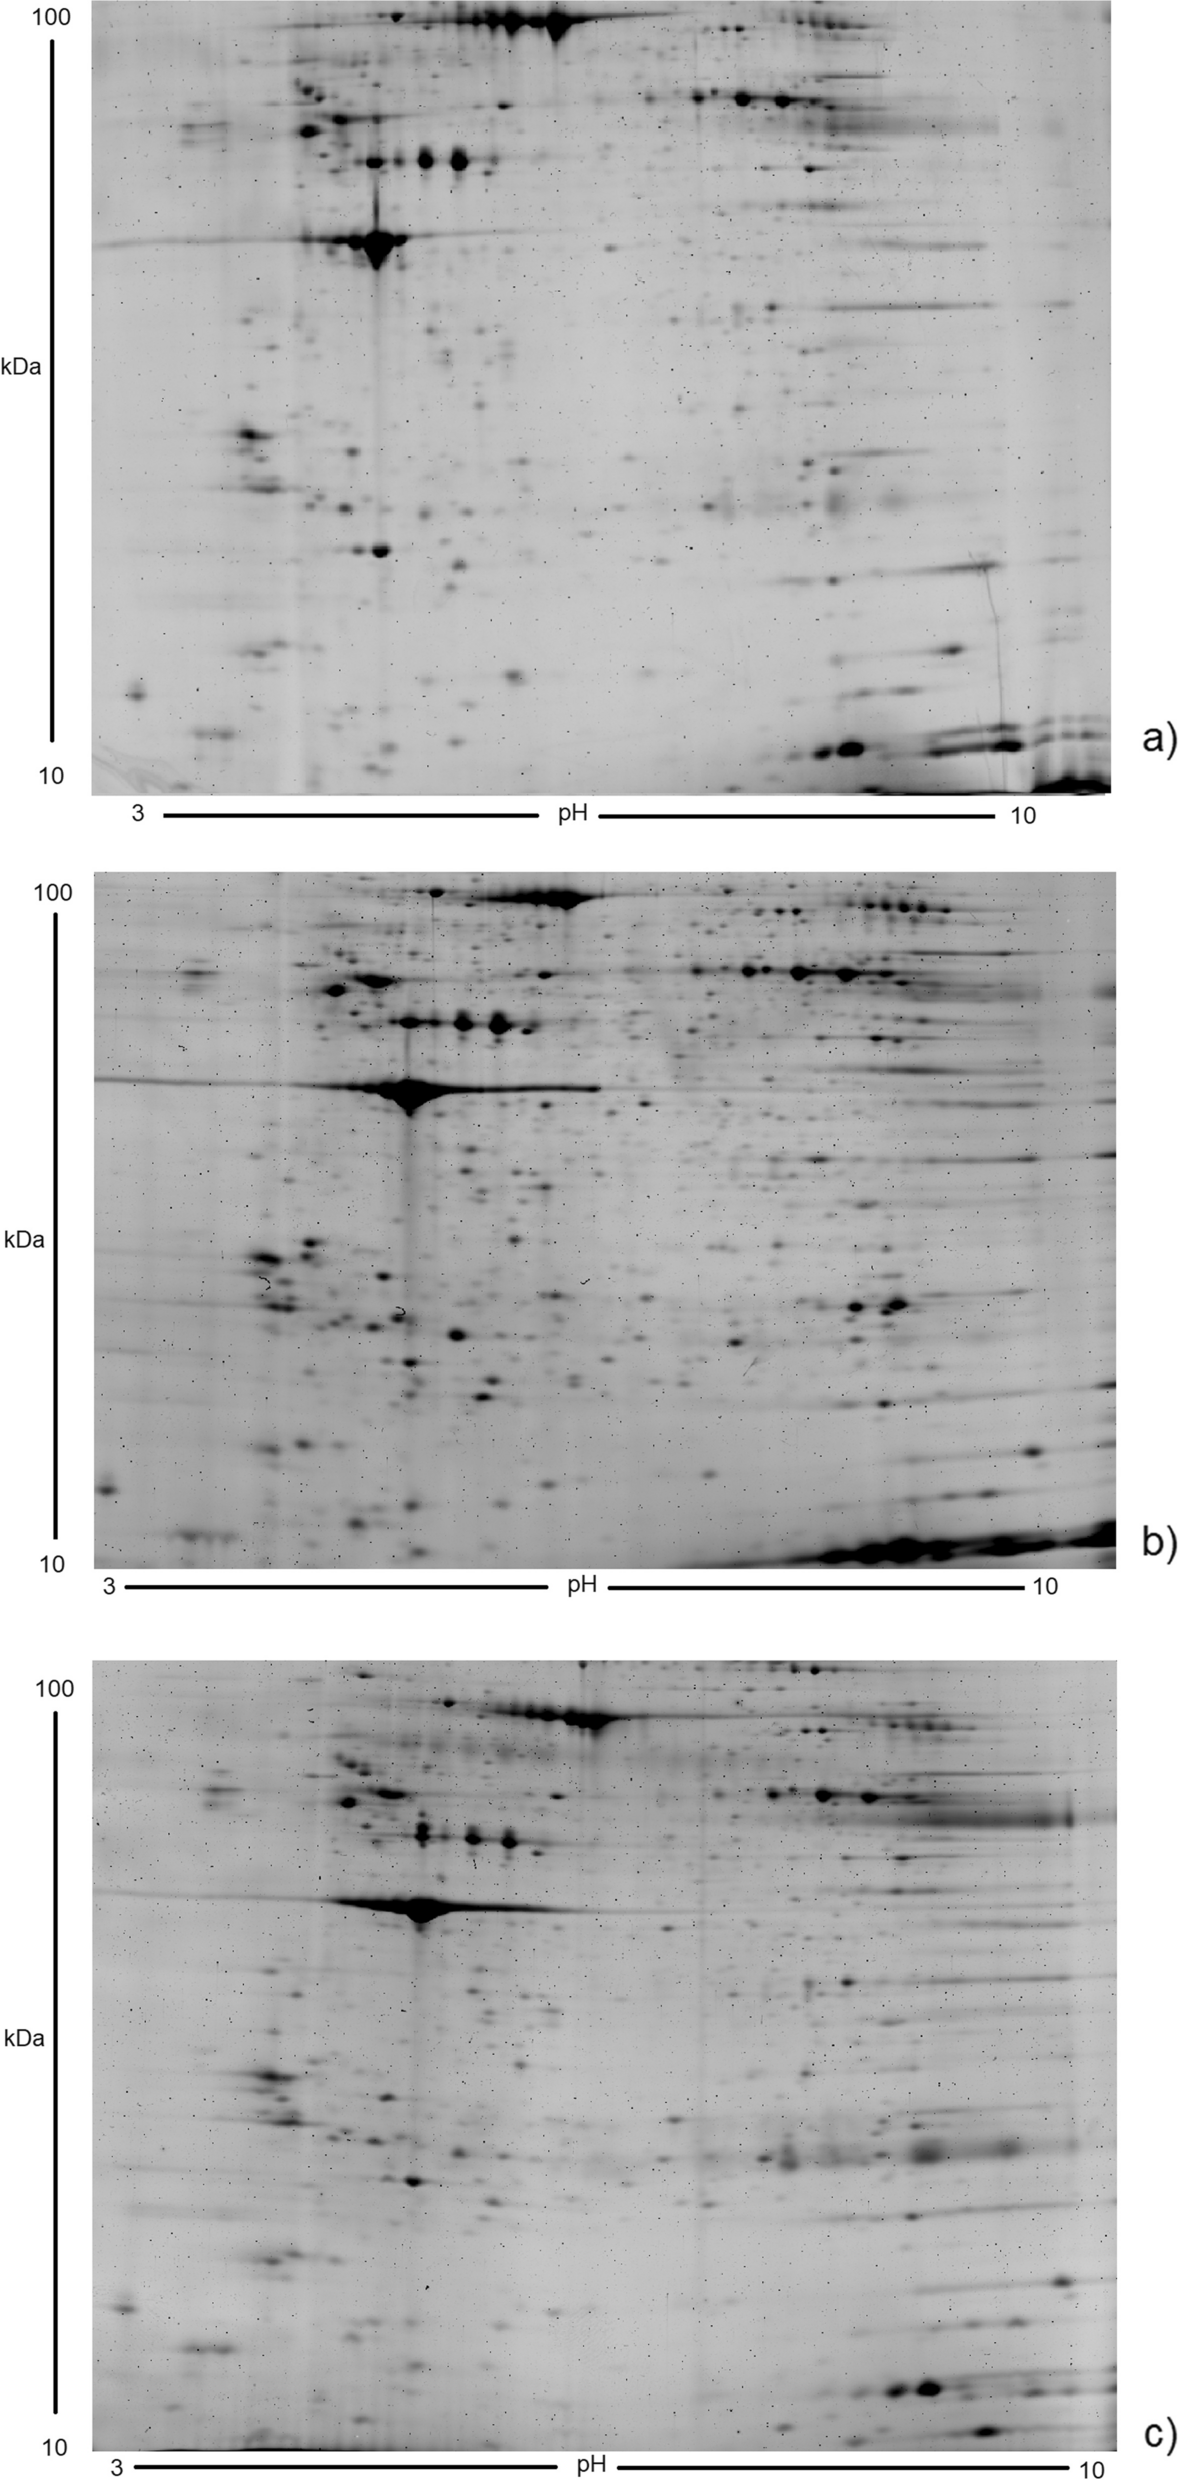
PM enrichment
The PM was enriched using a PM protein extraction kit (ab65400, Abcam, Cambridge, Massachusetts, USA) following the manufacturer’s protocol and a previous study [19]. Briefly, suspended U1, U937, J-Lat, and Jurkat cells (5–8 × 10⁸ cells/each) were centrifuged at 500 g for 5 min to collect the cell pellet. The pellet was washed twice with phosphate buffered solution (PBS) and homogenized in PBS with protease inhibitors. A portion of the homogenate, referred to as the ‘homogenate of whole-cell’, was collected, and used for protein extraction. The rest homogenates were continually centrifuged at 700 g to remove the nuclear and unbroken cells. The resulting supernatant was then centrifuged at 10,000 g for 30 min. The resulting pellet, representing the total membrane (TM), was collected and resuspended in 200 µL of the upper phase solution. This suspension was combined with 200 µL of the lower phase solution, mixed thoroughly, incubated on ice for 5 min, and centrifuged at 1000 g for 5 min at 4 °C to collect the upper phase, which was referred to as the PM fraction (PM). The homogenate of whole-cell, TM, and PM were used for protein extraction, followed by western blot for membrane purification detection, proteomic study, and DEP evaluation. To ensure an adequate amount of protein samples and make biological replicates, the PM enrichment process was triplicated and used for subsequent experiments, including protein extraction, western blot, digestion, and labeling of peptides.
Protein extraction
Proteins were extracted from the whole-cell homogenate, TM or PM with a triple volume of lysis buffer (nonidet P 40 (1%), urea (8 M), thiourea (2 M), 3-[(3-cholamidopropyl)-dimethylammonio]-1-propane sulfonate (4%), phenylmethanesulfonyl fluoride (0.5 mM), and dithiothreitol (DTT) (65 mM)). After incubating for three hours at room temperature, the samples were centrifuged to remove any insoluble fraction, and the resulting supernatants containing the total extractable protein were collected. Total protein concentrations were quantified using the Bradford method and stored at -80℃ for further usage.
For U1 and U937 cells undergoing HIV-1 reactivation and lysosomotropic stimulation, as well as CD4+ T cells from volunteers, proteins were extracted with RIPA cell lysis buffer, quantified using the bicinchoninic acid method, and used for western blot validation of LAMP2 expression.
Protein reduction, alkylation and digestion
Based on the measured protein concentrations, various samples from the PM of U1 and U937 cells were diluted to the same concentration and volume. Subsequently, equal amounts of protein (100 µg) from each sample were reduced with DTT to a final concentration of 5 mM for 60 min at 55 °C. After reduction, the samples were alkylated with iodoacetamide at a final concentration of 10 mM for 30 min at room temperature in a dark place, and desalted with a six-fold volume of pre-cooled acetone to precipitate the proteins at − 20 °C overnight. Following precipitation, the samples were centrifuged at 8,000 g for 10 min at 4 °C to collect the precipitate. After volatilizing acetone, the precipitated protein sample was digested with 50 µL of the tryptic solution (triethylammonium bicarbonate (TEAB) with a trypsin concentration of 50 ng/µL) at 37 °C for 16 h. Then, the digested peptide solution was centrifuged at 10,000 g for 10 min to collect the supernatant. The precipitates were washed with 67% acetonitrile (ACN) containing 5% formic acid (FA), and centrifuged to collect the supernatant. Both supernatants were combined, lyophilized, and stored at -80℃ for iTRAQ labeling.
iTRAQ label
The digested peptide samples from the PM of U1 and U937 cells were re-dissolved in 50 µL of 100 mM TEAB and labeled with eight-channel iTRAQ reagent (AB SCIEX, Massachusetts, USA), as following: three individual samples from U937 were labeled with reagent 117, 118, or 119, and individual U1 samples were labeled with 114, 115, or 116. Furthermore, one-sixth of the above samples was mixed, labeled with 121, and used as a reference sample. The labeling was performed according to the manufacturer’s instructions. Briefly, iTRAQ reagent was dissolved in 150 µL isopropanol at room temperature and added to 50 µL of the digested peptide sample (from 100 µg of proteins). The labeling reaction was performed at room temperature for 2 h. To terminate the labeling reaction, 100 µL of water was added to each sample and incubated for 30 min at room temperature. Subsequently, the seven labeled peptide samples (three from U937, three from U1, and one mixed reference) were mixed, lyophilized, and stored at -80 °C for liquid chromatography-mass spectrometry detection.
Liquid chromatography-mass spectrometry (LC-MS)
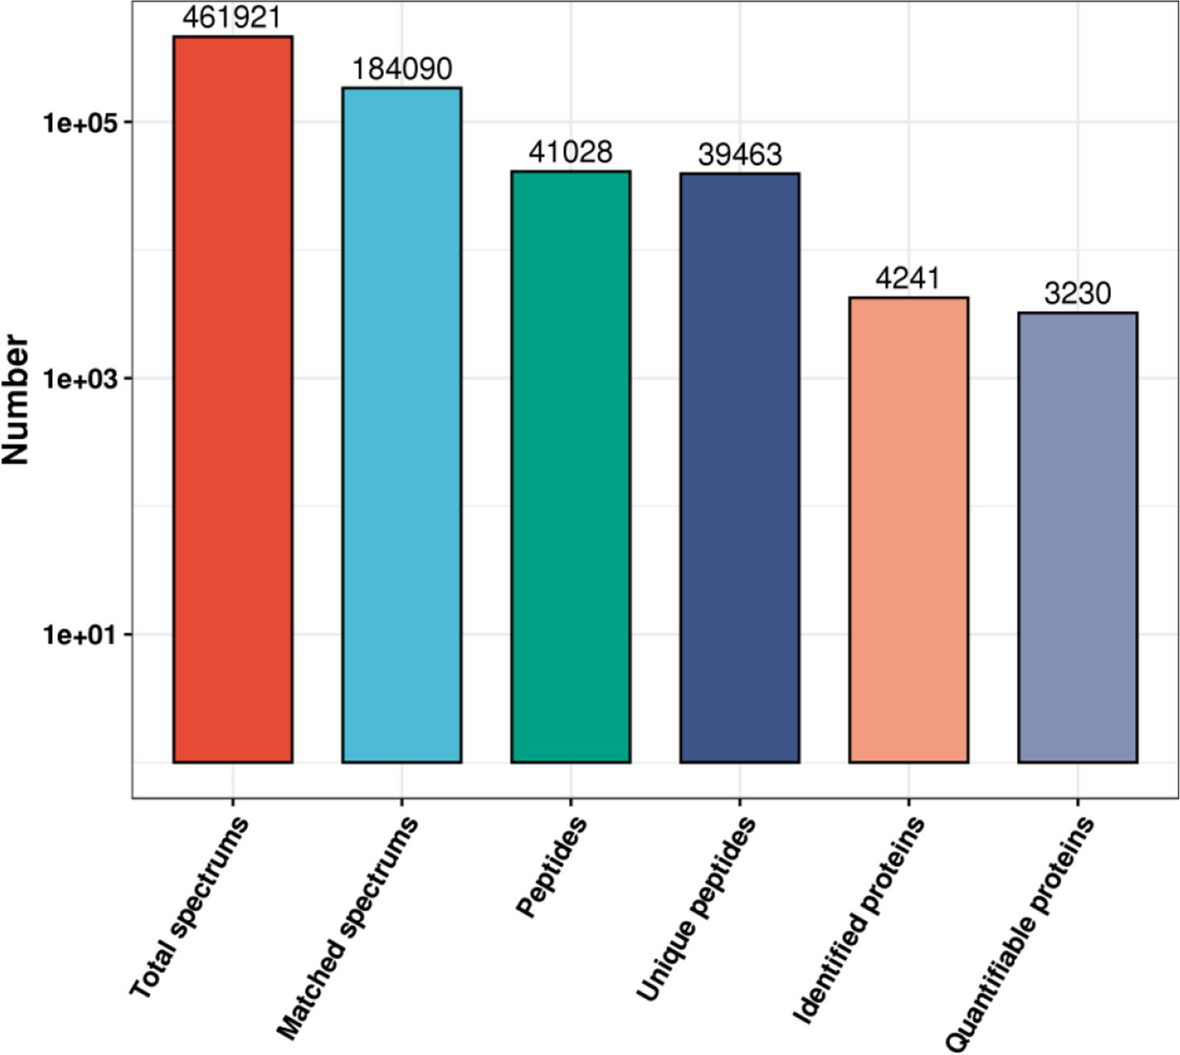
The labeled peptides were dissolved in 110 µL of mobile phases A (2% ACN in water, pH10, ammonium hydroxide (NH4OH)) and separated into ten fractions using an Agilent 1100 HPLC System (Agilent, California, USA). Briefly, the labeled peptides were separated at a flow of 300 µL/min using an Agilent Zorbax Extend reverse phase column (5 μm, 150 mm × 2.1 mm) with a solvent gradient as follows: of 0–8 min, 2% B (98% ACN in water, pH10, NH4OH); 8–8.01 min, 2–5% B; 8.01–30 min, 5–25% B; 30–40 min, 25–40% B; 40–45 min, 40–90% B; 45–50 min, 90% B; 50–55 min, 90–2% B; and 55–60 min, 2% B. The eluents from 8 to 60 min were collected into 10 centrifugal tubes with one tube collected every minute in a circular manner until the end of the gradient. The separated peptides were lyophilized for mass spectrometry detection.
The dried fractions (10 in total) were separately solubilized in 100 µL of nano-RPLC buffer A (2% ACN containing 0.1% FA), and each underwent LC-MS detection twice, named replicate 1 and replicate 2. In each replicate, 2 µL from each fraction was injected into an online nano-RPLC (Eksigent nano LC-Ultra™ 2D System, AB SCIEX, Massachusetts, USA). Initially, the labeled peptides were desalted by loading onto a C18 nano LC trap column (100 μm × 3 cm, C18, 3 μm, 150 Å) and washed with nano-RPLC buffer A at a flow rate of 2 µL/min for 10 min. Subsequently, the trap was switched to an in-line analytical ChromXP C18 column (75 μm × 15 cm, C18, 3 μm, 120 Å (ChromXP Eksigent, AB SCIEX)), with a flow rate of 300 nL/min. The linear gradient was applied over 65 min (0–45 min, 2–28% B (0.1% FA in ACN); 45–55 min, 28–42% B; 55–60 min, 42–90%B; and 60–65 min, 90% B).
Data acquisition was performed using a Triple TOF 5600 System (AB SCIEX) equipped with a Nanospray III source (AB SCIEX) and a pulled quartz tip as the emitter (New Objectives, USA). The acquisition parameters included an ion spray voltage of 2.5 kV, curtain gas at 30 PSI, nebulizer gas at 5 PSI, and an interface heater temperature of 150 °C. A TOF MS survey scan was performed at m/z 450 − 1500 within 250 ms. The Q1 isolation window was set to unit resolution of 1.0 m/z. For MS2 spectra acquirement, an information -dependent acquisition (IDA) model was used. The top 35 abundant precursor ions (with m/z of 450–1250, charges between + 2 and + 5, and intensity above 300 cps) from each MS1 scan were selected for MS/MS product ion scan (m/z,100 to 1500, 60 ms). The rolling collision energy (CE) was optimized for fragmentation of precursor ions with different charges and molecular weight. The exclusion time was set at 18s, and the total MS and MS2 cycle time was 3s.
The raw data have been deposited to the ProteomeXchange Consortium (http://proteomecentral.proteomexchange.org) via the iProX partner repository with the dataset identifier PXD037308, or iProX with the number of IPX0005164000 (https://www.iprox.cn/page/project.html).
Protein identification and quantification
The MS/MS data files from all fractions were combined and searched against Swiss-Prot human database (uniprot-human-2.fasta) by ProteinPilot™ software 5.0 (AB SCIEX, USA) with the Paragon algorithm (5.0.0.0, 4767). The search parameters were specified as follows: digestion, trypsin; one missed enzymatic cleavage site; the mass tolerance of ± 0.05, and ± 0.1 Da for precursor ions and fragment ions, respectively. Carbamidomethyl of cysteine, and iTRAQ 8-plex of lysine and the N-terminus were specified as fixed modifications, and oxidation of methionine and iTRAQ 8-plex of tyrosine were specified as variable modifications. Data was normalized for loading error by background correction and bias corrections calculated using ProteinPilot. All identified proteins had a global false discovery rate (FDR) less than 0.01. Protein groups considered for quantification required at least one peptide; and quantification was performed with unique peptides as well as shared peptides. The peak area ratios of the iTRAQ reporter ions of 114:121, 115:121, 116:121, 117:121, 118:121, and 119:121 were used for DEP analysis.
LAMP2 validation using mass spectrometry-based MRM technology
CD4+ T cell proteins from the three groups were extracted and digested as previously described. Before loading onto LC-MS, the peptides were desalted using C18 ZipTips microcolumns (Millipore, USA) and eluted with 50% ACN containing 0.1% FA according to the previously described [26].
The peptides selected for MRM quantification adhered to the following criteria: 1) detection in iTRAQ-based proteomic study; 2) unique peptides reported by MS/MS data searching software; 3) confidence level exceeding 95%; and 4) inclusion as reference peptides for LAMP2 in the proteomics database (https://www.proteomicsdb.org). Ultimately, the peptide sequence of IPLNDLFR was chosen. This peptide (5 mg with purity of 95.19%) and the internal standard peptide of GYSFTTTAER (5 mg with purity of 96.0%) from β-actin were synthesized by Shanghai Qiangyao Biotechnology Co., Ltd. (Shanghai, China).
The synthesized peptide was dissolved in water containing 0.1% FA to the final concentrations of 5–200 ng/mL, and a volume of 10 µL was injected and quantified using ultra-high-performance liquid chromatography/tandem mass spectrometry. Chromatographic separation was conducted on a C18 column (Venusil ASB C18, 2.1 × 50 mm, 5 μm) (Agela Technologies, Tianjin, China) in a Waters ACQUITY UPLC system (Waters company, Massachusetts, USA). The compounds were eluted with 0.1% FA in water (A) and 0.1% FA in ACN (B) at 0.35 mL/min for 3.5 min at a gradient of 0–0.8 min, 2% B; 1.2–2.2 min, 80% B; and 2.5–3.5 min, 2% B. The peptides were detected using A QTRAP 5500 tandem mass spectrometer (MS) (Applied Biosystems/AB SCIEX, Boston, USA) in a positive MRM mode. The MS parameters were optimized to detect the MRM precursors/fragment ions of 494.6 ((M + 2 H)2+)/664.2 and 567.1(M + H2O + 2 H)2+)/912.5 for IPLNDLFR from LAMP2, and GYSFTTTAER from β-actin, respectively. The peptide from β-actin was used as internal standard (IS). Quantification analysis was performed by Analyst 1.6.3 software using the peak area of analysts to that of the IS. Part of the method validation experiments, such as specificity, calibration curves, and accuracy, were performed according to the guidelines of the Food and Drug Administration (FDA) before the relative quantitation of LAMP2 in the CD4+ T cells from the volunteers. In this study, five samples from each group were involved, and each sample were detected twice by LC-MS.
Bioinformatics analysis
R package software (version 4.0.2) was used to analyze the volcano plot, venn diagram, and clustering data [27]. The protein accessions of a total of 110 DEPs were input for bioinformatics analysis through STRING software (Version:11.0b) (https://string-db.org). The up-regulated and down-regulated proteins were submitted separately. Biological process (BP), molecular function (MF), cellular component (CC), Kyoto Encyclopedia of Genes and Genomes (KEGG) pathway, and protein-protein interactions were analyzed by setting a minimum required interaction score of 0.7 (indicating high confidence) and a FDR less than 0.05. When the number of description items for BP, MF, CC, and KEGG pathway (reported by the STRING software) exceeded 10, only the top 10 items were extracted. Interactions between DEPs and HIV proteins were examined using the HIV interaction database (https://www.ncbi.nlm.nih.gov/genome/viruses/retroviruses/hiv-1/interactions). The protein-protein interaction network was constructed using Cytoscape software (version 3.7.1), and node proteins were exported from the STRING software.
Western blotting
For membrane purification detection, U1 and U937 cells were used. In the analysis of differential protein expression involving LAMP2, CD55, ITGA6, and CD47, U1, U937, J-Lat, and Jurkat cells were employed. The protein fractions analyzed included homogenate, TM, and PM. LAMP2 protein levels were further investigated in U1 and U937 cell homogenate treated with panobinostat or hydroxychloroquine.
Proteins (20 µg) from homogenate, TM, and PM were separated by electrophoresis in a sodium dodecyl sulfate (SDS)-12.5% polyacrylamide gel and transferred to a PVDF membrane (Millipore company, Boston, Massachusetts, USA). After blocking in 10% defatted milk for 2 h at room temperature or overnight at 4℃, blots were incubated for 2 h at 37˚C or overnight at 4℃ with specific primary antibodies (Na+/K+-ATPase (ab7671, 1:5000), prohibitin (ab28172, 1:2000), LAMP2 (ab199946, 1:1000), CD55 (ab133684, 1:1000), ITGA6 (ab181551, 1:1000), CD47 (ab218810, 1:1000), and β-actin (60009-1-Ig, 1:5000, PROTEINTECH). After three washes with TBST (TBS + Tween), blots were incubated for one hour at room temperature with secondary antibodies (goat anti-mouse IgG-HRP (1:2000, Santa Cruz Biotechnology, California, USA) or goat anti-rabbit IgG-HRP (1:2000, Santa Cruz Biotechnology, California, USA)). After further washes, the immune complexes were revealed by enhanced chemiluminescence and imaged with ChemiScope 5300 (Shanghai, China). The protein bands were quantified using Image J software (ImageJ 1.51j8). Three biological replicates were performed.
LAMP2 validation using flow cytometry
To validate the relationship between LAMP2 and HIV latency, LAMP2 expression in U1 and U937 cells was detected using flow cytometry. The cells were incubated with precooled methanol for 10 min, washed twice with PBS containing 2% BSA, and then incubated for 15 min with the primary antibody against LAMP2 (ab199946, 1:200). Subsequently, they were treated with the Goat Anti-Mouse IgG H&L (Alexa Fluor 488)-conjugated secondary antibody (ab150113, 1:1000). Flow cytometric analysis was performed using a flow cytometer (Beckman, Bremen, Germany). The experiments were performed in triplicates.
HIV-1 reactivation detection by HIV p24 expression
HIV-1 reactivation was detected using a Capsid Protein p24 ELISA kit (SEK11695, Sino Biological, Inc., Beijing, China) following the manufacturer’s protocol. Briefly, a 96-well plate with 100 µL of sample or standards in dilution buffer per well was incubated for three hours at room temperature (about 25 °C) and washed thrice with wash buffer. Subsequently, 100 µL of the detection antibody (diluted in dilution buffer to a final concentration of 0.35 µg/mL) was added to each well. The plate was then sealed and incubated for one hour at room temperature. After washing with wash buffer three times, 100 µL of the substrate solution was added to each well, incubated for 20 min at room temperature, and followed by adding 50 µL of stop solution. The optical density of each well was immediately determined using a microplate reader at 450 nm by gently tapping the plate to ensure thorough mixing.
Statistical analysis
For proteomic data, the quantitative data file generated by the ProteinPilot software from the MS/MS intensities of the reporter tags was statistically analyzed using Microsoft Excel 2010. The relative peak intensity from U1 (114:121, 115:121, and 116:121) was compared to that from U937 (117:121, 118:121, and 119:121). DEPs were defined with a fold-change of ≥ 2 or ≤ 0.5 (p < 0.05) when comparing U1 to U937. For p24 quantification and western blotting, statistical analyses were performed using GraphPad Prism software (version 8.3.0). The unpaired Student’s t-test analysis was used to compare differences for two groups, while a one-way analysis of variance (ANOVA) was employed to identify significant differences among multiple groups. A statistically significant difference was considered at p < 0.05.


Comments (0)