
記住我

First, we sought to determine whether the number of senescent cells is altered in IBM compared to NDC and IMNM patients. For this purpose, we recruited a multicentric cohort of 48 patients (16 per group) in three tertiary centres specialized in managing IIMs. The clinical and epidemiological characteristics are given in Table 1. Given that age is likely to have a major impact on the development of cellular senescence, NDC and IMNM patients were matched to IBM by age to account for this confounder. For diagnosis of IBM and IMNM, patients were required to meet the current ENMC criteria for diagnosis, respectively [2, 35]. Briefly, IBM patients were 73 (45–87) years old with 7 males and 9 females. 5 out of 16 patients received intravenous immunoglobulin treatment at the time of biopsy. No other immunosuppressants were recorded for the IBM cohort.
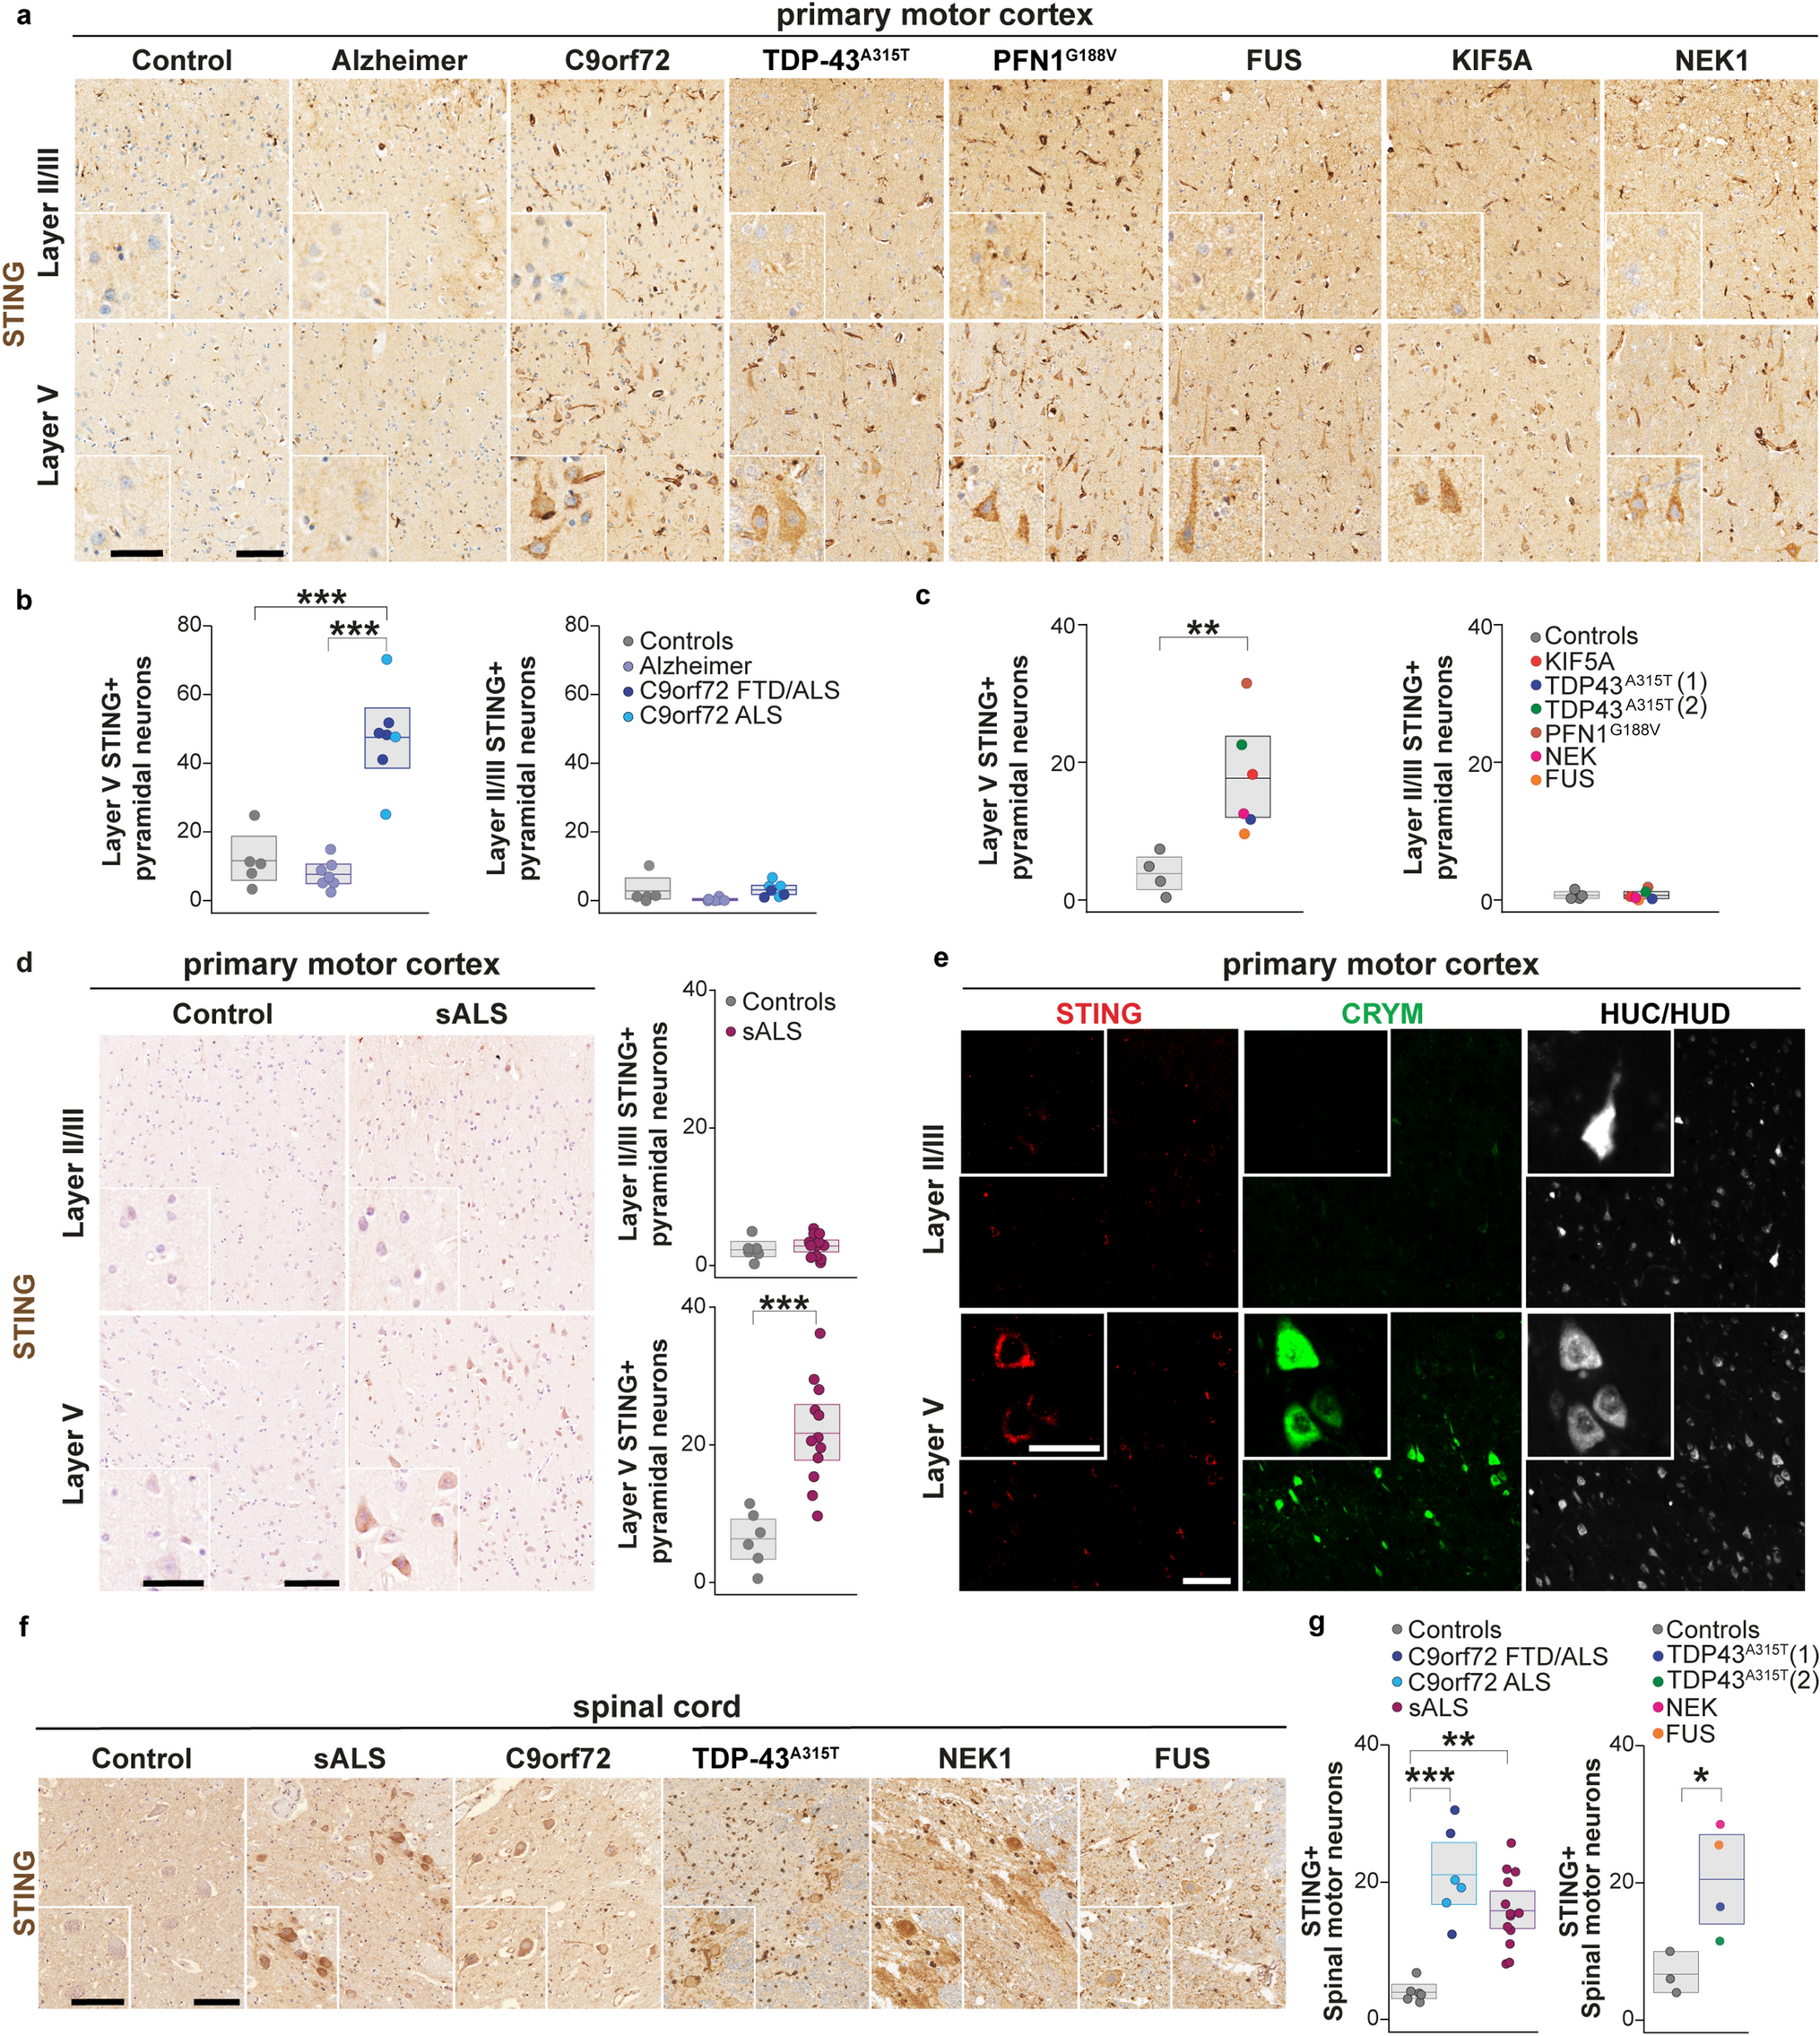
Table 1 Clinical and demographic characteristicsAs the first readout, we focused on the study of p21, an established marker for cellular senescence [15]. This choice was motivated by several recent studies in murine and human tissues demonstrating that p21 governs a senescent program in skeletal muscle and serves as a marker for muscle cell senescence [12, 50, 64]. We assessed the number of p21+ cells by IF (Fig. 1a). Given the nuclear expression of p21, only cells that demonstrated clear co-localization of p21 and DAPI were considered to be p21+. Indeed, the number of p21+ cells was higher in IBM as compared to NDC and IMNM patients (Fig. 1b). To further corroborate this data, we also analysed p21 at the gene level by PCR observing an increased expression of CDKN1A (coding for p21) in IBM compared to NDC or IMNM patients (Fig. 1c). Intriguingly, a substantial number of p21+ cells were detected in the perimysial area in IBM. To clarify the origin of those p21+ cells, we also counted the number of p21+ myonuclei (Fig. 1d). Myonuclei were defined as nuclei localized inside the boundaries of the corresponding myofiber (Fig. 1e). IBM and IMNM patients demonstrated similar numbers of p21+ myonuclei leading us to hypothesize that non-myogenic cells resident in skeletal muscle might primarily assume a senescent phenotype in IBM. Of note, longer disease durations were associated with an increased number of p21+ cells (Fig. 1f). Following this line of argumentation, we aimed to study senescence at the level of single cells (or nuclei) in the landscape of myogenic and non-myogenic cells in the IBM muscle.
Fig. 1
p21+ senescent cells are abundant in muscle of IBM. a Immunofluorescence staining of p21 (red), laminin-β1 (green), and DAPI (blue) in muscle specimens of NDCs (n = 16), IBM (n = 16), and IMNM (n = 16) patients. Patients were matched by age. Arrows indicate single p21+ cells or clusters of p21+ cells. b p21 + cells were counted in randomly distributed 10 HPF (≙ 0.16 mm2). The biopsies were blinded for quantification, with the diagnosis impossible to identify from the label. p21+ cells were defined as cells with a clear expression of p21 in the nucleus. c RT-qPCR analysis of CDKN1A coding for p21 in muscle specimen (n = 16 per group). The 2−ΔΔCT method was used for normalization. CDKN1A is significantly over-expressed to NDC for both IBM and IMNM. d Quantification of p21+ myonuclei in muscle in muscle specimen (n = 16 per group). p21+ myonuclei were defined as nuclei located inside a muscle fiber. e Exemplary image of a p21+ nucleus located inside a myofiber. Differences between groups were analysed by Kruskal–Wallis test followed by post hoc testing. f Simple linear regression of the number of p21+ cells and the disease duration of each IBM patient. The disease duration was defined as the time in months between the first symptoms as reported by the patient and the time of biopsy. The dotted line indicates the 95% confidence interval. Significance was tested by the likelihood test. *p < 0.05, **p < 0.01, ***p < 0.001. NDC non-diseased control; HPF high-power field; IBM inclusion body myositis; IMNM immune-mediated necrotizing myopathy; r2 coefficient of determination; RT-qPCR real-time quantitative polymerase chain reaction
Single-nuclei RNA sequencing deconvolutes distinct cell populations and allocates senescence in IBM muscle mainly to fibro-adipogenic progenitorsFor this purpose, we performed snRNA-seq of three IBM patients and three NDCs. We chose snRNA-seq as an alternative to single-cell RNA-seq due to the large size of myofibers that restricts the latter’s use for studying skeletal muscle [30, 50]. For snRNA-seq, all muscle specimens were obtained from the quadriceps muscle, specifically the vastus medialis, approximately 3 cm proximal to the knee joint. IBM patients were 65, 68, and 71 years old with two male and one female subject. NDCs were age- and sex-matched. All IBM patients and all NDCs were treatment naïve.
After quality control, ~ 30,000 nuclei of which ~ 13,000 were obtained from IBM muscle and ~ 17,000 from NDC were integrated into a batch-corrected expression matrix for downstream analysis. Using graph-based clustering of uniform manifold approximation and projection (UMAP), we observed nine major cell types or subtypes based on differential marker expression (Fig. 2a, b). Cell types were assigned according to the expression of canonical markers (a full list of all marker genes is given in Supplemental File 1) based on previous transcriptomic studies of skeletal muscle [9, 30, 50, 52]. While non-myogenic cells were separated based on their transcriptomic profiles, the classification of myogenic cells was more challenging. Briefly, human skeletal muscle may be classified into slow-twitch (type 1) and fast-twitch (type 2A and type 2X) myofibers based on the presence or absence of specific myosin heavy chains (MYH) [42]. For this study, we annotated the myogenic compartment based on this classification, although it should be noted that some myofibers are considered hybrids falling between canonical subtypes [58]. First, we annotated type 1 myonuclei based on the expression of canonical markers such as MYH7 or MYH7B (Fig. 2a, b) [50, 58]. Second, a subgroup of fast-twitch (type 2X) myonuclei were identified based on the expression of MYH1 and the absence of MYH7 [50, 58]. As previously described by Murgia et al., specific markers, except MYH2, for the type 2A subgroup of fast-twitch myofibers are currently lacking [42]. Following this line of argumentation, we annotated the final myonuclei cluster as type 2A given the absence of MYH7 and MYH1 expression specific for type 1 and type 2X fibers, respectively.
Fig. 2
Single-nuclei RNA sequencing of IBM and NDC muscle. A total of 6 frozen muscle specimens were processed for single nuclei-RNAseq (3 samples per group). A total of ~ 30,000 nuclei were included for downstream processing and clustering after quality control. a UMAP embedding demonstrating distinct clusters of cell types and subtypes. b Clustered dot plot visualization of top-regulated marker genes. The mean expression for each cluster is indicated by colour code. The dot size indicates the percent of expressing cells. Clusters were annotated based on marker genes. c Expression of CKDN1A (coding for p21) across the UMAP embedding. The mean expression for each cell is indicated by the colour code. d Frequency of CDKN1A+ cells for each cell cluster as indicated for IBM patients and NDC. Differences between groups were analysed by the Kruskal–Wallis test followed by post hoc testing. e Gene set enrichment analysis (GSEA) for the SenMayo dataset. Differentially expressed genes were determined by the FindMarkers function using Wilcox testing and a fold-change threshold of 0.25. The Bonferroni correction was used for correction for multiple testing. DEGs specific to the IBM dataset were entered into the GSEA. The Kolmogorov–Smirnov test, followed by post hoc correction, was used to determine the significance. **p < 0.01. ACTA2 actin alpha 2; CDKN1A cyclin dependent kinase inhibitor 1A; CDH5 cadherin 5; COL collagen; EMCN endomucin; FBN1 fibrillin-1; ITGAL integrin subunit alpha L; LILRB5 leukocyte immunoglobulin like receptor B5; MRC1 mannose receptor C-type 1; MYBPC2 myosin binding protein C2; MYL9 myosin light chain 9; NDC non-diseased control; IBM inclusion body myositis; SIGLEC1 sialic acid binding Ig like lectin 1; TPM3 tropomyosin 3; PECAM1 platelet and endothelial cell adhesion molecule 1; PAX7 paired box 7; PTPRC protein tyrosine phosphatase type C (CD45); UMAP uniform manifold approximation and projection
To understand the distribution of senescence in myogenic and non-myogenic cells, we determined the expression of CDKN1A across the dataset (Fig. 2c). To compare the cluster-specific frequencies, we calculated the number of CDKN1A expressing cells as percentage of all cells in a cluster for IBM and NDC (Fig. 2d). As described in the previous section, the relative frequencies of CDKN1A+ nuclei were comparable between IBM and NDC for myonuclei. Intriguingly, the frequencies of CDKN1A expressing FAPs and monocytes/macrophages were strongly increased in IBM compared to NDC. However, it should be noted that the expression of a single gene is unlikely to capture the heterogeneity of cellular senescence across tissues. To address this caveat and to further corroborate the engagement of senescence pathways, we determined the differentially expressed genes (DEGs) between IBM and NDC for all cell clusters. Next, we employed the SenMayo gene set for enrichment analysis [56]. Briefly, the SenMayo gene set is a panel composed of 125 key genes associated with senescence signalling pathways. We chose SenMayo as this gene set has been benchmarked against existing senescence or SASP gene sets and outperformed the latter in the detection of senescent cells [56]. DEG lists of all clusters were entered into GSEA for the SenMayo gene set (Fig. 2e). Only the FAPs cell cluster was enriched for SenMayo in IBM compared to NDC. SnRNA-seq demonstrates the capability of discerning distinct cellular subtypes and suggests that non-myogenic cells assume a senescent phenotype in IBM.
Single-nuclei RNA sequencing identifies a novel population of senescent FAPs that resides in IBM muscleNext, we focused on the FAP population and extracted this cell cluster for in-depth analysis (Fig. 3a). A total of ~ 3200 FAP nuclei were analysed. FAPs are the lineage precursors of specialized non-myogenic cells, including activated fibroblasts, adipocytes, and osteogenic cells [8]. We performed subclustering on these cells and observed 4 subpopulations of FAPs (Fig. 3b, c). We determined marker genes for all FAP subtypes and compared these with previous studies [9, 55]. Although there currently exists no consensus regarding canonical marker genes of human FAPs, Perez et al. previously reported subtypes of FAPs associated with ageing based on the expression of the ryanodine receptor 1 (RYR1) and triadin (TRDN) [50]. In our dataset, the clusters FAPs2 and FAPs3 were also characterized by RYR1 and TRDN expression. Given the advanced age of IBM patients and NDCs in our cohort, we suspect that these FAPs are reminiscent of these previously reported FAP phenotypes. In contrast, we also determined two clusters of FAPs only found in IBM patients, but not in NDCs. The first cluster was defined by the expression of lumican (LUM) and fibrillin-1 (FBN1). LUM+/FBN1+ FAPs were previously described [55] and are thought to resemble neprilysin (MME) expressing FAPs associated with fatty infiltration of skeletal muscle. Intriguingly, we also investigated the expression of CDKN1A across FAP subtypes and found that the expression of this senescence marker is largely restricted to the LUM+/FBN+ FAP population. Consequently, we termed these FAPs CDKN1A+ to underline their senescent phenotype and association with the p21 pathway. This FAP phenotype is found in IBM but not in NDCs (Fig. 3e). The identity of the fourth FAP subtype (FAPs3) is characterized by the expression of XIAP-associated factor 1 (XAF1) and dynamin-1 (DNM1). These markers were previously described in FAPs [19], however, their role is currently unknown.
Fig. 3
A novel population of senescent FAPs resides in IBM muscle. a UMAP embedding of the full dataset. FAPs are highlighted in green. All FAPs were extracted for downstream analysis and subclustering. b Subcluster analysis of the FAP population. Four FAP populations are identified based on their marker genes. c UMAP embedding displaying the origin for each nucleus. d Clustered dot plot visualization of top-regulated marker genes. The mean expression for each cluster is indicated by colour code. The dot size indicates the percent of expressing cells. Cluster were annotated based on marker genes. e Expression of CKDN1A (coding for p21) across the UMAP embedding split into the IBM (left) and NDC (right) datasets. The mean expression for each cell is indicated by the colour code. f Gene set enrichment analysis (GSEA) for the GO-BP dataset for the CDKN1A+ FAP cluster. Differentially expressed genes were determined by the FindMarkers function using Wilcox testing and a fold-change threshold of 0.25. The Bonferroni correction was used for correction for multiple testing. DEGs specific to the IBM dataset were entered into the GSEA. The Kolmogorov–Smirnov test, followed by a post hoc correction, was used to determine the significance. g GSEA analysis for the SenMayo dataset for the DEGs obtained from the CDKN1A+ FAP cluster. The running-sum statistic is in red, with the position in the ranked DEG list in black. Genes were sorted by fold change. The Kolmogorov–Smirnov test, followed by a post hoc correction, was used to determine the significance. h Violin plots displaying the normalized gene expression of the indicated genes for each FAP cluster. CDKN1A cyclin dependent kinase inhibitor 1A; DNM1 dynamin-1; FBN1 fibrillin-1; GO-BP gene ontology biological processes; LUM lumican; NDC non-diseased control; IBM inclusion body myositis; RYR1 ryanodine receptor 1; TRDN triadin; UMAP uniform manifold approximation and projection; XAF1 XIAP-associated factor 1
Given the scope of this study, we focused our analysis on the CDKN1A+ FAP population. To understand whether these FAPs exhibit senescence features, we determined the marker genes for this cell cluster and performed GSEA for the biological processes (BP) database (Fig. 3f). Here, the humoral immune response was the most enriched term for the CDKN1A+ FAP population. This observation is consistent with current knowledge on the senescent phenotype, as these cells are known to engage a pro-inflammatory secretome (e.g. SASP). To further corroborate a senescent phenotype for these FAPs, we performed GSEA for the SenMayo gene set. Here, marker genes of CDKN1A+ FAPs were enriched for SenMayo indicating the engagement of senescence pathways in these cells (Fig. 3g). We manually screened the marker genes of CDKN1A+ FAPs and observed that these cells express endosialin (CD248), a glycoprotein and key regulator of tissue fibrosis [48, 51, 59]. CD248 expression was only detected in CDKN1A+ FAPs but not in other FAP subtypes (Fig. 3h). Besides CD248, CDKN1A+ FAPs also engage the Jun/JunB signalling pathway [37, 56]. This pathway has been reported to govern fibroblast senescence by inhibition of insulin growth factor-1 (IGF-1) [37]. Surprisingly, CDKN1A+ FAPs also demonstrate upregulation of complement factors such as complement factor 3 (C3), complement factor H (CFH) or complement factor D (CFD). In respect to signalling, CDKN1A+ FAPs express CD44, a pro-inflammatory cell-to-cell signalling receptor, as well as receptors for transforming growth factor beta (TGF-β, TGFBR2, and TGFBR3). To corroborate that the p21+ cells in the perimysium/endomysium are indeed the FAP phenotype detected in the transcriptomic dataset, we performed IF staining of IBM biopsy specimens (Suppl. Figure 1). Here, p21+ cells located in the perimysium were identified by the canonical FAP marker platelet-derived growth factor receptor α (PDGRA).
To further cross-validate the engagement of senescence in these cells, we additionally investigated the activity of the senescence-associated β-galactosidase (SA-β-Gal) [38, 60]. To enable intracellular staining in tissue sections, we employed SPiDER-β-Gal which exerts higher cell permeability than traditional SA-β-Gal [29]. Indeed, p21 (CDKN1A)+ FAPs were detected in the perimysium of IBM patients and stained positive for SA-β-Gal as an additional biomarker for cellular senescence (Suppl. Fig. 2a).
Succinctly, CDKN1A + FAPs demonstrate key features of cellular senescence including expression of senescence markers, engagement of a pro-inflammatory secretory phenotype and pro-fibrotic surface molecules, the activity of SA-β-gal and a senescence-associated transcriptomic signature.
IBM demonstrates a pronounced loss of type 2A muscle fibersNext, we analysed the myonuclear compartment of IBM and compared it to NDCs (Fig. 4a). Consistent with the current knowledge on IBM histopathology [17], the immune cell clusters of monocytes/macrophages and T, B, and NK cells were expanded in IBM compared to NDC (Fig. 4a, b). Further, we also observed that the number of type 2A and to a lesser extent type 2X myofibers were strongly reduced in IBM compared to NDC.
Fig. 4
IBM demonstrates a pronounced loss of type 2A muscle fibers. a UMAP embedding of the full dataset split into IBM (left) and NDC (right). Cell populations are indicated by their colour code. b Relative frequency of each cell type or subtype in the IBM and the NDC dataset as a stacked bar plot. c UMAP embedding of the full dataset. Myonuclei are highlighted in dark red. These nuclei were extracted for downstream analysis d UMAP embedding of the myonuclei subclusters. A total of five populations were obtained from subclustering. e Clustered dot plot visualization of top-regulated marker genes. The mean expression for each cluster is indicated by colour code. The dot size indicates the percent of expressing cells. Clusters were annotated based on marker genes. f UMAP embedding for the myonuclei subcluster split into the IBM (left) and NDC (right) datasets. Subclusters are colour coded. g Exemplary ATPase staining for muscle specimens obtained from NDC, IBM, and IMNM patients. 8 patients were analysed by ATPase staining for each group. Muscle slices were incubated at a pH of 4.6, inactivating the myosin-ATPase of specific muscle fiber types. Type 1 muscle fibers are dark brown, type 2A is light brown, and type 2X are of an intermediate colour. The contrast and intensity vary between muscle specimens. A total of 10 high-power fields were counted. The corresponding statistical analysis is displayed in Suppl. Fig. 1B. ACHE acetylcholine esterase; CHRNA1 cholinergic receptor nicotinic alpha 1 subunit; FAP fibro-adipogenic progenitor; HLA human leukocyte antigen; IMNM immune-mediated necrotizing myopathy; MYH myosin heavy chain; MuSC muscle stem cell; NDC non-diseased control; IBM inclusion body myositis; TNFAIP2 TNF Alpha Induced Protein 2; UMAP uniform manifold approximation and projection
To gain further insight into the phenotype of myogenic cells in IBM, we extracted the myonuclei from the full dataset (Fig. 4c) and performed subclustering on these nuclei (Fig. 4d). ~ 20,000 myonuclei were analysed by this approach. Subclustering revealed five distinct populations of myonuclei. Briefly, we detected type 1 myonuclei defined by MYH7 and MYH7B expression as well as type 2X myonuclei expressing MYH1 (Fig. 4e). Type 2A myonuclei were defined, as above, by the lack of MYH1 and MYH7 while expressing MYH2. This subclustering revealed two additional clusters of myonuclei. First, we detected a population of myonuclei that were defined by the expression of the acetylcholine receptor (CHRNA1), the acetylcholine esterase (ACHE) and the muscle associated receptor tyrosine kinase (MUSK). Given their unique expression profile of NMJ proteins, these nuclei are likely to belong to myonuclei constituting the neuromuscular synapse (NMJ). Second, a cluster of myonuclei emerged that expressed high levels of pro-inflammatory molecules, such as HLA-A, HLA-B or HLA-C constituting the major histocompatibility complex (MHC) class 1. Further, these myonuclei displayed TNF alpha-induced protein 2 (TNFAIP2) and complement protein 3 (C3) as marker genes. Given their unique expression profile of pro-inflammatory genes, we termed these myonuclei as inflammatory. Phenotypically, these myonuclei express MYH7 and MYH7B suggesting that they resemble type 1 myofibers. Comparing IBM and NDC, there was a strong reduction in the number of type 2A myonuclei (Fig. 4f). Concurrently, CHRNA1+ myonuclei were also strongly reduced, while type 1 and type 2X myonuclei appeared largely unaltered.
For cross-validation of the specific loss of type 2A myofibers, we determined the frequency of myofiber types based on their ATPase staining after incubation at pH 4.6 [58]. We chose this approach to demonstrate the reduction in type 2A myofibers on the protein level and in a method independent of the MYH classification. Here, type 2A myofibers were markedly reduced in IBM compared to NDCs or IMNM patients (Fig. 4g, Suppl. Fig. 2b). In line, the relative frequency of type 1 myofibers was higher in IBM compared to the other groups. As such, a selective loss of type 2A myofibers appears to characterize the pathomorphology of IBM.
Skeletal muscle cells assume an inflammatory reprogramming in IBMNext, we focused on the subpopulation of inflammatory myonuclei. Intriguingly, while this population was detected in IBM and NDC, their phenotype was altered depending on their origin (Fig. 5a). These myonuclei demonstrated high expression of marker genes such as C3 or HLA-A only in IBM, but not in NDC. Notably, these inflammatory myonuclei were also the primary source of transforming growth factor beta (TGFB1). Further, we sought to cross-validate the presence of these myonuclei in muscle. For this purpose, we performed IF staining for intracellular C3 as expression for this gene was only detected in inflammatory myonuclei from IBM patients, but not in other subtypes of myonuclei in either NDC or IBM suggesting sufficient specificity to serve as a marker (Fig. 5b). Indeed, myofibers with intracellular C3 staining were abundant in IBM compared to NDC or IMNM muscle (Fig. 5c, d). To further characterize the phenotype of these myofibers, we computed the DEGs comparing inflammatory myonuclei between IBM and NDC. GSEA analysis of these DEGs for the GO-BP database indicated engagement of pro-inflammatory pathways, including the immunoglobulin mediated immune response, adaptive immune response, innate immune response and, interestingly, the B cell mediated immune response (Fig. 5e).
Fig. 5
Skeletal muscle cells assume an inflammatory reprogramming in IBM. a UMAP embedding of the myonuclei split into IBM (left) and NDC (right). The expression of each gene indicated on the right is colour coded. b Violin plot displaying the expression of complement factor 3 (C3) for each myonuclei subset for IBM and NDC. Only inflammatory myonuclei obtained from IBM patients express C3. c Exemplary staining for C3 (red) laminin-β1 (green) and DAPI (blue) for NDC, IBM, and IMNM patients. 16 patients were analysed for each group by immunofluorescence. d C3+ myofibers were counted in randomly distributed 10 HPF (≙ 0.16 mm2). The biopsies were blinded for quantification, making the diagnosis impossible to identify from the label. e Visualization of the gene set enrichment analysis (GSEA) for the GO-BP dataset as a gene concept network. GSEA was performed from the DEGs comparing inflammatory myonuclei from IBM patients and NDC. The Kolmogorov–Smirnov test followed by post hoc correction was used to determine the significance. The top five GO terms for the BP dataset are colour coded. A line connects the corresponding genes constituting each term. The fold change for each gene comprising the GO term comparing IBM and NDC is indicated in red. The number of genes for each GO term is indicated as a dot size. CHRNA1 cholinergic receptor nicotinic alpha 1 subunit; HLA human leukocyte antigen; HPF high-power field; MYH myosin heavy chain; NDC non-diseased control; IBM inclusion body myositis; TGFB1 transforming growth factor beta 1; UMAP uniform manifold approximation and projection
IBM myofibers lose their potential for endplate formationTo further characterize the changes to the myogenic compartment in IBM, we aimed to validate the reduction in AChR (CHRNA1) expressing muscle fibers (Fig. 6a). On the transcriptomic level, cells concurrently expressing the AChR as well as the acetylcholine esterase (ACHE) were reduced in IBM (Fig. 6b). Similarly, the expression of CHRNA1 in myonuclei was detected in NDC, but not in IBM (Fig. 6c). Formation of the NMJ is required for nerve-muscle communication. To visualize the neuromuscular endplate, we performed IF for α-bungarotoxin binding the AChR and counted the number of NMJs. Here, the number of NMJs was strongly reduced in IBM compared to NDCs or IMNM patients (Fig. 6d, e). NMJs were defined by the concurrent binding of α-bungarotoxin and their characteristic topography. These data suggest that endplate formation is impaired in IBM muscle potentially affecting nerve-muscle communication.
Fig. 6
IBM myofibers lose their potential for endplate formation. a UMAP embedding of the myonuclei split into IBM (left) and NDC (right). The myonuclei cluster expressing the acetylcholine receptor (CHRNA1) is marked in orange. b Density plot generated with the Nebulosa package of cells expressing acetylcholine receptor and acetylcholine esterase (ACHE). Areas of high cellular density are indicated in orange. c Violin plot for the CHRNA1 expression across the dataset. CHRNA1-expressing nuclei are largely absent in IBM muscle. d Exemplary staining of a NMJ in NDC, IBM, and IMNM patients, respectively. α-bungarotoxin was used to label the acetylcholine receptors of the NMJ in green. 12 patients were analysed for each group. e While NMJ was detected in all muscle samples, their frequency was strongly reduced in IBM. NMJ was defined by its characteristic topography and expression of the acetylcholine receptor. NMJ was counted in randomly distributed 10 HPF (≙ 0.16 mm2). The biopsies were blinded for quantification, with the diagnosis impossible to identify from the label. 12 patients were analysed by immunofluorescence for each group. f Frequencies of NMJ in NDC, IBM, and IMNM patients. Differences between groups were analysed by Kruskal–Wallis test followed by post hoc testing. ***p < 0.001. ACHE acetylcholine esterase; CHRNA1 cholinergic receptor nicotinic alpha 1 subunit; HPF high-power field; NDC non-diseased control; IBM inclusion body myositis; IMNM immune-mediated necrotizing myopathy; UMAP uniform manifold approximation and projection
Conclusively, single nuclei analysis suggests that the myogenic compartment of IBM is characterized by the loss of type 2A myonuclei and of myonuclei that constitute the NMJ. Conversely, C3 expression identifies a distinct pro-inflammatory subpopulation of myonuclei residing in IBM muscle.
FAPs demonstrate a shifted collagen homeostasis with potential consequences for muscle health in IBMFinally, we aimed to determine whether senescence of FAPs may be linked to changes to the myogenic compartment. FAPs and their fibroblast lineage are the primary sources of extracellular matrix proteins required for skeletal muscle homeostasis [6]. Manual screening of the top dysregulated genes in CDKN1A+ FAPs revealed a shift in the expression of collagens, specifically of COL15A1, an isoform coding for collagen type XV, as well as COL1A1 and COL1A2, coding for collagen type I. Expression of all three collagen coding genes is allocated to the FAP cluster in both NDC and IBM (Fig. 7a). However, further analysis of the FAP subcluster indicates a shift of collagen expression between IBM and NDCs with CDKN1A+ FAPs demonstrating a sharp downregulation of COL15A1 (p = 5 × 10–32), while engaging COL1A1 (p = 1 × 10–87) as well as COL1A2 (p = 1 × 10–70) expression (Fig. 7b, c). Both types of collagens are required to stabilize skeletal muscle cells and their differentiation. However, they vary in their biological functio
留言 (0)