
記住我
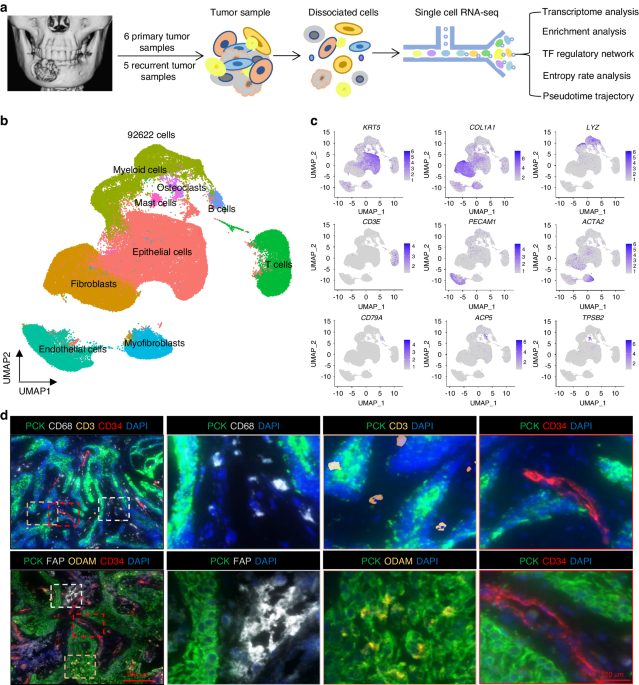

To explore the cellular landscape of PA, we generated single-cell RNA-seq profiles using 1 normal parotid gland (PG) and 3 PA samples (Fig. 1a). As shown in Fig. S1a, H&E staining showed that the pathological structure of PA varied in different samples, reflecting pleomorphic architecture features. After removing low-quality cells and performing gene expression normalization, a total of 35662 single cells were processed for further analysis and 8 cell clusters were observed according to graph-based clustering and dimensional reduction with UMAP (Fig. S1b, c). As shown in Fig. S1d, e, the UMAP displayed that the cell distribution was similar in different PA samples, but dramatically different in PA compared with the PG. This finding indicated that PA might have a unified cellular landscape despite the variable morphological architectures. Then, 7 major cell types were annotated based on the expression of canonical gene markers and assessment using the SingleR package (Fig. 1b–d, Fig. S2 and Supplementary Table 1), including epithelial cells expressing KRT8, KRT14, KRT5, EPCAM, KRT18 and AQP5; endothelial cells expressing PECAM1, ENG and CDH5; fibroblasts expressing COL3A1 and DCN; NK/T cells expressing CD3D, CD3E, CD8A, NKG7 and GNLY; B cells expressing CD79A and CD79B; plasma cells expressing MZB1; and myeloid cells expressing CD68, CD74, CLEC9A and CD163. Of note, we observed that each of the 7 clusters contained cells from different samples despite differing cell type proportions, indicating that the major cell types are largely consistent across the PA and PG (Fig. 1e).
Fig. 1
A single-cell atlas of PA and PG. a The workflow of single-cell RNA sequencing. b UMAP plot of 35 662 single cells from scRNA-seq labelled by cell type. c A heatmap of marker genes for each cell type. d StackedVlnPlot of classic genes of each cell type. e The cell numbers and proportions of PA cell types in different samples and tissue types
Molecular characteristics of PA and PG epithelial cellsAs shown in Fig. 2a, the UMAP showed a substantial difference in the distribution of epithelial cells from PG and PA. To characterize the PG and PA epithelial cells, we inferred copy-number variations (CNVs) in epithelial cells of each sample based on smoothed expression profiles across chromosomal intervals.11 We found that PA epithelial cells exhibited remarkably higher CNV levels than PG epithelial cells (Fig. 2b). The inferred CNV data analysis revealed significant copy number amplification on chromosomes 1, 9, 19, 22, but significant deletions along chromosomes 4, 16, 18 and 20 were observed (Fig. 2c). Of note, dramatic alterations were observed on chromosome 12. Similar genomic alterations were also observed in previous studies12,13,14 and several other adenogenic tumours, such as breast cancer and pancreatic ductal adenocarcinoma,15,16 indicating that adenogenic tumours might share some common genomic alterations. Subsequently, a panel of marker genes were identified to be upregulated in PA and PG epithelia cells. As expected, high expression of marker genes related to the secretion of salivary gland and saliva enzymes was observed in PG epithelial cells, such as PRB1, CLDN3, PRB3, SMR3B, HTN1 and PIGR,17,18 while several oncogenes that have been confirmed to promote PA development were increased in PA cells, including PLAG1, WIF1, S100B, CDK4, LIFR and NFIB (Fig. 2d, e and Fig. S3a–c).14,19,20,21,22,23 Gene ontology (GO) enrichment analysis was performed based on the differentially expressed genes (DEGs) and revealed that matrix formation-related pathways were involved in the tumour epithelium, such as extracellular matrix organization and skeletal system development, suggesting that abnormal matrix formation occurred in the PA epithelium (Fig. 2f). In contrast, several pathways related to the physiological function of salivary glands were mainly enriched in the PG epithelium, including salivary secretion and detection of chemical stimuli involved in sensory perception of bitter taste (Fig. 2g)
Fig. 2
Molecular characteristics of PA and PG epithelial cells. a The UMAP distribution of 27 084 epithelial cells in different tissue types and samples. b Boxplot displaying the CNV score of epithelial cells in the four samples. c Chromosomal copy number variation values in epithelial cells of four samples, blue indicates deletion and red indicates amplification. d Boxplots showing the high differential expression of the representative genes PRB1 and CLDN3 in the PG sample (P < 2.2e-16). e Boxplots showing the high differential expression of the representative genes PLAG1 and WIF1 in the PA samples (P < 2.2e-16). f GO analysis of genes in PA epithelial cells (P < 0.05, log2FC > 1). g GO analysis of genes in PG epithelial cells (P < 0.05, log2FC > 1)
PA-specific epithelial cell subpopulationsAfter reclustering PG epithelial cells, three major cell types were identified in the PG, including acinar cells expressing AQP5, ductal cells expressing KRT18, WFDC2, KRT8, and KRT7 and basal cells/myoepithelial cells expressing KRT14 and ACTA2, which were consistent with the known functional cells within the salivary gland.24 Similarly, reclustering of PA cells produced 5 major cell types and three of them were also observed in PG, including acinar cells (AQP5), ductal cells (KRT18, KRT8, KRT7, WFDC2) and basal/myoepithelial cells (KRT14, ACTA2), suggesting that PA tumour cells broadly recapitulated the PG cell subpopulations with shared several common marker genes across normal PG and PA (Fig. 3a). Interestingly, two distinguished epithelial cell clusters specific to PA were discovered, which were named the PA-specific epithelial cell (PASE) subpopulations and exhibited high expression of MUCL1 (PASE1) and COMP (PASE2) (Fig. 3b). Strikingly, PASE subpopulations accounted for 86.5% of tumour cells in PA.
Fig. 3
PA-specific epithelial cell subpopulations. a The UMAP distribution of epithelial cells labelled by samples (left) and the expression of acinar cells, ductal cells, basal/myoepithelial cell genes (middle) as well as the expression of tumour-specific genes (right) between PG and PA epithelial cells. b UMAP distribution showing the cell types shared with PG and PA samples and PA-specific cells. c The UMAP distribution of PA-specific epithelial cell subsets. d EMT score based on the HALLMARK_EPITHELIAL_MESENCHYMAL_TRANSITION gene set from GSEA datasets in different PA-specific epithelial cell subsets.32P < 2.22e-16 by pairwise Wilcoxon rank-sum tests. e Dotplot showing EMT-related genes. f Heatmap showing the EMT-related transcription factors ZEB1, TWIST1, SOX4 and SIX1
To further investigate the heterogeneity and molecular characteristics of PASE cells, we performed analysis of 19360 PASE cells at higher resolution, which yielded 6 prominent cell subpopulations with different transcriptional profiles (C0-C5), reflecting the heterogeneity of PASE cells (Fig. 3c). It has been suggested that epithelial-mesenchymal transition (EMT) represents the basic principle of tissue heterogeneity in PA.7,8,9 Importantly, EMT has been suggested to be responsible for generating tumor-initiating cells in many tumors.25,26,27 Then, we first detected the EMT state in these six PASE cell populations and found that C0, C1, C2, C4 and C5 cells all exhibited high EMT scores (n = 200 genes, P < 2.2 × 10⁻¹⁶) (Fig. 3d). Notably, C4 cells had the highest EMT score but C3 cells had the lowest EMT score. These results indicated C4 cells were the undifferentiated cells, C3 cells were highly differentiated, and C0, C1, C2 and C5 cells showed the transition or intermediate states. Furthermore, all PASE subpopulations except C3 cells expressed high levels of EMT-related genes, such as COL1A1, COL1A2, COMP, MMP2 and EMP3 (Fig. 3e). Interestingly, several master transcription factors of EMT were also increased in C0, C1, C2 and C4 cells, including SOX4, SIX1, ZEB1 and TWIST1 (Fig. 3f). These results suggest that EMT occurs widely and plays a critical role in PA development, which may contribute to the generation of TICs and the formation of stromal-like components, such as myxoid-like and chondroid-like components.
Then, the transcription states of PASE subpopulations were annotated according to well-known marker genes and functional enrichment analysis. As shown in Fig. 4a, b and Supplementary Table 2, we observed that C0 cells expressed acinar cell markers (AQP5, AQP1) and basal cell markers (KRT5, KRT14)28,29 with properties of epithelium development and fluid secretion, indicating that C0 cells demonstrated a hybrid state. C1 cells showed high expression of SFRP2 and CTGF, which have been reported to enhance osteogenic differentiation.30,31 Functional enrichment showed that C1 cells were correlated with extracellular matrix organization, bone development and cartilage development, implying that C1 cells were chondroid-like components. C2 cells expressed IGLC2 and exhibited immune and inflammation signatures, implying that these cells might trigger immune reactions and inflammatory responses. Based on the features mentioned above, we defined C0, C1 and C2 cells as mesenchymal-like cells due to high EMT scores and the characteristics of stromal cells. In addition, C3 cells expressed MUCL1 and the canonical ductal cell markers KRT7, KRT18 and KRT19 (Fig. 4c). Functional enrichment showed that C3 cells were characterized by metabolic reprogramming. C5 cells expressed high levels of proliferation-related genes (such as MKI67 and TOP2A) and had the highest cell cycle score, which were also correlated with the cell cycle gene signatures (Fig. 4d, e). Notably, we observed that C4 cells exhibited high expression levels of myoepithelial cell markers (ACTA2),24 myogenesis-related genes (CASQ2, IGFBP7, MYL9),32,33,34 angiogenesis-related genes (SPARCL1, ITGA7, CALD1)35,36,37 and stemness-related genes (CD36, THY1, ITGA7).38,39,40,41,42,43 Functional enrichment showed that C4 cells were correlated with blood vessel development and muscle structure development, implying that C4 cells might have multidifferentiation potentials. However, C4 cells lacked expression of the classic stemness-related transcription factors, including SOX2, BMI1, GLI1, NANOG, and OCT4 (Fig. 4f). Therefore, we performed single-cell regulatory network inference and clustering (SCENIC), which nominated MAFB, LEF1 and TBX2 as master TFs potentially controlling C4 cells (Fig. 4g), which have been confirmed to be associated with stemness and EMT.44,45,46 These findings indicated that the C4 subpopulation was a unique myoepithelial cell population with tumour-initiating potential in PA. Collectively, we then defined C0-C5 cells as hybrid, chondroid, immune modulatory, MUCL1+ ductal, progenitor and cycling PASE cells, respectively (Fig. 4h).
Fig. 4
Transcriptional landscape heterogeneity of PA-specific epithelial cell subsets. a Heatmap of marker genes for PA-specific epithelial cell subsets. b GO enrichment analysis of PA specific epithelial cell subsets. c UMAP feature plots of expressed genes in tumour-specific ductal cells. d UMAP feature plots of expressed genes in cell cycle cells. e Cell cycle scores of PA specific epithelial cell subsets. f Heatmap showing stemness-related genes SOX2, BMI1, NANOG, OCT4, GLI1 and GLI2. g Heatmap showing the top regulon of each cell cluster inferred by SCENIC. h The UMAP distribution of PA-specific epithelial cell subsets
Tumour-initiating cells in PAHistologically, PA is characterized by a biphasic architecture with both “epithelial” and “stromal” regions.47 Currently, several studies have indicated that the epithelial and stromal elements are monoclonal and derived from the same precursor cells.5,6 However, it is still not clear which cell is responsible for tumour initiation and produces the epithelial and stromal components in PA. We showed that C4 PASE cells might have tumour-initiating potential in PA, as mentioned above. To further investigate the origins and developmental trajectory of PA cells, we performed trajectory analysis using the top 100 DEGs of PASE cells. This unsupervised approach identified a continuum of cell states and showed two distinct trajectories beginning at state 2 (pre-branch) and gradually branching to state 1 and state 3 corresponding two distinct cell fates (cell-fate 1 and cell-fate 2), revealing a common origin with divergent fates (Fig. 5a, b). In the pseudotime trajectory, we investigated the distribution pattern of the six PASE subtypes. As shown in Fig. 5c and Fig. S4a, C4 cells were predominantly observed in the end of state 2 with the lowest pseudo-time position and C3 cells were mostly found in the end of state 1 with the highest pseudo-time position, supporting our previous notion that C4 cells were the progenitor cells of PA and C3 cells were the highly differentiated ductal cells. C0, C1, C2 and C5 cells were scattered along the trajectories, reflecting their transition or intermediate states. Notably, the highly expressed gene markers of C4 (ACTA2, IGFBP7, THY1) were located at the low pseudotime position, further indicating that C4 cells were the progenitor cells in PA. The markers that represented the differentiated epithelial cells (KRT19, EPCAM, KRT18) and mesenchymal-like cells (CNMD, COMP, SOX9) were also located at the appropriate pseudotime position (Fig. S4b–d). Moreover, C4 cells exhibited high expression of the stemness-related gene signature and tumorigenesis-related gene signature by referring to gene sets that have been reported and included in GSEA48,49,50 (Fig. 5d–f). Taken together, these results suggested that C4 cells were the tumor-initiating cells in PA.
Fig. 5
Tumour-initiating cells in PA. a The pseudotime trajectory is shown coloured by cell state designation. b Pseudotime is shown coloured in a gradient from dark to light blue and the start of pseudotime is indicated. c The pseudotime trajectory is shown coloured by cell subset designation. d The violin plot of stem cell score based on the published article50 (Supplementary Table 4) in different PA specific epithelial cell subsets (log2FC > 0.5). P < 2.22e-16 by pairwise Wilcoxon rank-sum tests. e Violin plot of stem cell score based on the CROMER_TUMORIGENESIS_UP gene set from GSEA datasets in different PA-specific epithelial cell subsets.48P < 2.22e-16 by pairwise Wilcoxon rank-sum tests. f Violin plot of stem cell scores based on the LEE_NEURAL_CREST_STEM_CELL_UP gene set from GSEA datasets in different PA specific epithelial cell subsets.49P < 2.22e-16 by pairwise Wilcoxon rank-sum tests. g Heatmap showing the ordering gene expression dynamics during the cellular-fate transition process and expression dynamics
To study potential changes in global expression dynamics along the trajectory, we ordered the genes expression by pseudotime and conducted the enrichment analysis to investigate the precise impact of the alterations in cell fate. We found that there were 6 gene expression patterns (P1-P6) accounting for the distinctions (Fig. 5g, Supplementary Table 3). Cells undergoing cell-fate1 expressed highly homeostatic associated molecules enriched for the salivary gland function, including salivary secretion and monocarboxylic acid metabolic process (P1, P3). Cells undergoing cell-fate2 expressed high level of genes enriched for skeletal system development, extracellular matrix organization, inflammatory response and cytokine signaling in immune system (P2, P6), which were consistent with the signatures of mesenchymal-like cells mentioned above (Fig. 5g, Fig. S5). These functional enrichments reflected the cell components of PA in the two developmental routes, supporting the notion that TICs of PA could develop into the highly differentiated epithelial cells to form the duct structures and the mesenchymal-like cells with transitional states to form the stroma, including myxoid, chondroid or myxochondroid.
CD36+ was a functional surface marker of tumour-initiating cells in PATo further identify and isolate TICs of PA, C4 cell-specific markers were screened. Notably, we observed that CD36, a cell surface marker, was specifically expressed in PA epithelial cells (Fig. 6a, b) and involved in the regulation of stemness,39,40 indicating that CD36 might be a functional cell surface marker for the enrichment of TICs in PA. As shown in Fig. 6c, we further confirmed that CD36 was mainly expressed in myoepithelial tumour cells in PA tissue by using Pan-Keratin (PCK), ACTA2 and CD36 multiple immunostainings. Then, primary PA epithelial cells from different patients were freshly isolated and cultured, which were further confirmed using PCK staining (Fig. 6d). Next, CD36+ and CD36− PA epithelial cells were sorted using fluorescence-activated cell sorting (FACS) (Fig. 6e). To evaluate the tumorigenic potential of sorted cells, a tumour sphere formation assay was performed using the collected CD36+ and CD36− PA cells. As shown in Fig. 6f, CD36+ PA epithelial cells were able to form more and larger spheres than those generated from CD36− PA epithelial cells. More importantly, we performed RNA-seq by using CD36+ and CD36− cells isolated from primary PA cells. GSEA results showed that the genes upregulated in CD36+ cells were enriched for the regulation of stemness, supporting that CD36 was a cell surface marker for the enrichment of TICs in PA (Fig. S6a, b).
Fig. 6
CD36+ is a functional surface marker of tumour-initiating cells in PA. a High expression genes of the C4 cluster (P < 0.05, avg_ log2FC > 2.5). b The UMAP distribution of CD36 gene expression in PA epithelial cell subsets. c Representative images of multicolor immunostaining showing the expression of PCK, ACTA2, CD36 in PA sections; scale bar = 50 μm. d Immunofluorescence of PCK in PA epithelial cells after two passages culture; scale bar = 50 μm. e Flow cytometry analysis of CD36+ PA cells and CD36− PA cells. f Spheroids cultured from CD36+ PA cells and CD36− PA cells, scale bar = 50 μm (left). Quantification results are shown. **P < 0.01 and ***P < 0.001 by Student’s t test (right)
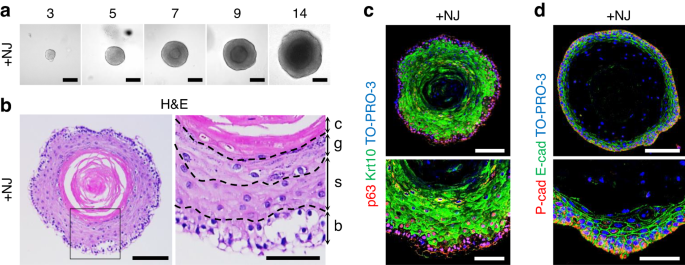
Targeting the PI3K-AKT pathway eliminated tumour-initiating cells and suppressed tumour growth in PANext, to clarify the key signalling pathway controlling TICs in PA, we performed Kyoto Encyclopedia of Genes and Genomes (KEGG) analysis based on our scRNA-seq data, which indicated that PI3K-AKT signalling pathway was activated in C4 cells (Fig. 7a). Similar results were also observed in our RNA-seq data generated from CD36+ and CD36− PA cells (Fig. 7b). Then, two small molecular inhibitors MK2206 and GDC0068 were used to validate the functional role of the PI3K-AKT pathway in PA tumorigenesis. As shown in Fig. S7a, inactivation of the PI3K-AKT pathway with MK2206 and GDC0068 dramatically inhibited sphere formation generated from CD36+ PA cells. These findings suggested that targeting the PI3K-AKT pathway may be an effective therapeutic strategy for the treatment of PA. To further evaluate the therapeutic value of targeting the PI3K-AKT pathway in PA, PA patient-derived organoids (PPDOs) were cultured and confirmed by H&E staining and double staining of PCK and CD36 (Fig. 7c, d). As expected, we observed that pharmacological inhibition of the PI3K-AKT pathway significantly impaired the formation and growth of PPDOs (Fig. 7e).
Fig. 7
Targeting the PI3K-AKT pathway eliminated tumour-initiating cells and suppressed tumour growth in PA. a KEGG enrichment scatter plot of C4. The y-axis represents the name of the pathway, and the x-axis represents the rich factor, and the degree of KEGG pathway enrichment. The dot size represents the number of genes and the colour indicates the q-value. b GSEA showing that the PI3K-AKT pathway signatures were significantly enriched in CD36+ cells compared with CD36− cells. The top DEGs (log2FC > 1) of these GSEA terms are presented in the heatmap. c Representative images showing patient organoids derived from different patient pleomorphic adenomas; scale bar = 100 μm. d Haematoxylin and eosin (H&E) staining of organoid sections; scale bar = 100 μm (left). Representative immunostaining images showing the expression of PCK and CD36 in PA organoids; scale bar = 100 μm (right). e The suppressive effect of AKT inhibitors (MK2206, 10 μmol·L−1 and GDC0068, 2.5 μmol·L−1) in the organoid assay, scale bar = 100 μm (left). Quantification results are shown. *P < 0.05, **P < 0.01 and ***P < 0.001 by one-way ANOVA (right)
留言 (0)