
記住我
We generated a comprehensive atlas of core and linker histone gene mutations in cancer by interrogating publicly available whole genome/exome sequencing data from three studies1: The Cancer Genome Atlas (TCGA) (n = 10,131 subjects)22, (2) the International Cancer Genome Consortium Pan-Cancer Analysis of Whole Genomes (ICGC PCAWG) (n = 1798 subjects)23, and (3) the Pediatric Brain Tumor Atlas (PBTA) (n = 814 subjects)24 (Table 1). In total, we analyzed paired tumor-germline genomes from 12,743 subjects representing >30 solid and hematological malignancies for all age groups (pediatric: 0–14 years, n = 856; adolescent/young adult (AYA): 15–39 years, n = 1302; adult: 40+ years, n = 10,441; age NA, n = 144). Nonsynonymous mutations were queried across 88 histone protein-encoding genes (n = 10 linker, 78 core), representing the most updated list of histone genes from the HUGO Gene Nomenclature Committee (HGNC) at the time of analysis.
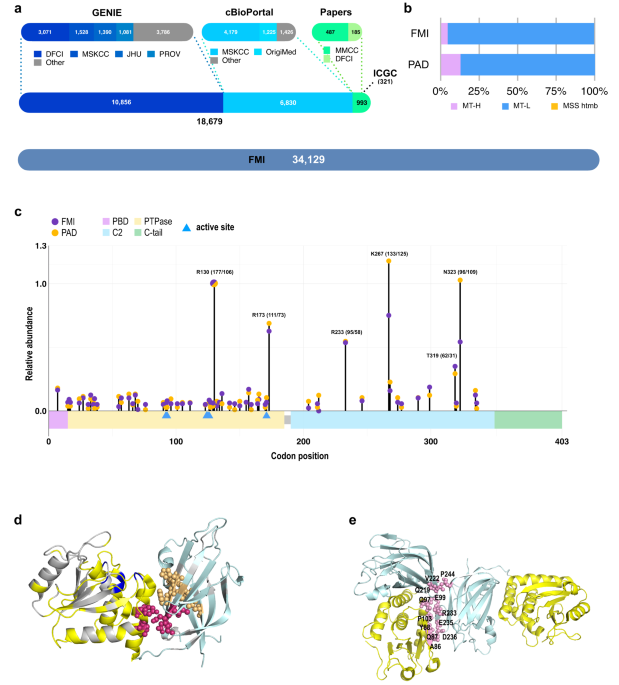
Table 1 Patient cohort for analysis.Atlas of core and linker histone mutations in pediatric, AYA, and adult cancersHistone protein-altering somatic mutations were identified in a striking 11.5% of subjects (n = 1466), with 1787 mutation events affecting 80 histone-encoding genes (Fig. 1a, Supplementary Data File 1). Core histone mutations were distributed evenly between the four core histone families, while H1 mutations comprised 17% of all mutation events (Fig. 1b). H1 genes exhibited the highest percentage of putative loss-of-protein-function mutations (e.g., disruptive frameshifts and truncating mutations) out of all histone families (Fig. 1c). The topmost recurrently mutated histone genes at pan-cancer level were H3-encoding genes H3-3A and H3C2, and H1-encoding genes H1-2/4/5 (Fig. 1a). When accounting for gene length, H3-3A and H3C2 were still amongst the top ten histone genes with the highest mutation rates (mutation rate = log10(n + 1)/CDS, with n = mutation count and CDS = coding sequence length), whereas H1 genes were not, suggesting that the high H1 mutation count could be partially attributed to the longer length of these genes. Most (76%) H3-3A mutations were H3 K27M (n = 52/83, 63%) and H3 G34R/V/W mutations (n = 11/83, 13%; Fig. 1d). These hotspot events accounted for only 12% of H3C2 mutations (H3 K27M, n = 6/49). Among H1 genes, both missense and disruptive/frameshift mutations were distributed broadly across the globular and C-terminal domains of the protein rather than concentrated in a specific region (Fig. 1e). This pan-cancer mutational pattern aligns with previous reports of H1 mutations in lymphomas20,21.
Fig. 1: Pan-cancer genomic landscape of core and linker histone mutations.
a Oncoplot showing the top 20 most recurrently mutated histone genes across cancers. Linker histone genes are denoted with a yellow asterisk. b Distribution of histone mutation events (n = 1787) across histone families. c Mutation types affecting genes of each histone family. Y-axis shows the percentage of each mutation type (variant classification, color key in a) out of the total mutations affecting that histone family. d Lollipop plots showing mutations affecting the topmost recurrently mutated core histone genes H3-3A and H3C2. e Lollipop plots showing mutations affecting the topmost mutated H1 genes H1-2/4/5. Boxplots showing VAF distributions of the topmost recurrently mutated histone genes (f) and of histone genes with the highest average VAFs (g). Boxplots show the upper and lower quartiles and the median VAF. H3-3A and H1-2 are shown in color in g to highlight that they are both the most mutated, and have the highest average VAFs, of all histone genes. Abbreviations: FS frameshift, del deletion, ins insertion, TSS transcription start site, IF in frame, VAF variant allele frequency.
Clonality of histone gene mutations identifies putative driver histone genesWe queried mutation VAF across histone genes to identify putative clonal driver genes with somatic VAFs near 50%, consistent with clonal cancer mutations (assuming diploid genomes and high tumor purity25). VAFs across all mutated histone genes ranged between 14–46% (average = 26%, median = 25%). There were no significant differences in average VAF (VAFavg) between core versus linker histone genes (Mann–Whitney test, p = 0.18, Supplementary Fig. 1A), or between each individual histone family (H1, H2A, H2B, H3, H4; Supplementary Fig. 1B), indicating that clonality was gene-specific, rather than histone family-specific. Among histone genes exhibiting the highest mutation burdens (i.e., top 10 most mutated histone genes, Fig. 1f), H3–3A and H1–2 also exhibited the highest VAFavg (30–40%), indicating clonality of mutations affecting these genes. We also identified genes with the highest VAFavg across all histone genes, which again included the known oncogene H3-3A as well as H1-2, highlighting H1-2 as a potential driver gene (Fig. 1g). When considering clonality at both the gene and the mutation level, there were several established oncohistone mutations with VAFs above 30–40%, including H3-3A K27M (n = 52, VAFavg = 43%), H3C2 K27M (n = 6, VAFavg = 46%), H3-3A G34R (n = 8, VAFavg = 43%), and H3-3B K36M (n = 6, VAFavg = 32%). H1 mutations also emerged as clonal and recurrent in at least two patients, including H1-4 L42V (n = 2, VAFavg = 40%), H1-5 K187N (n = 2, VAFavg = 34%), and H1-2 P146S (n = 2, VAFavg = 31%).
The relatively lower VAFavg of mutations affecting other histone genes suggested that, with some exceptions (Fig. 1g), most histone mutations were potentially sub-clonal events. This finding aligns with studies of recently reported oncohistones (e.g., nucleosome destabilizing H2B E76K, which similarly occurred at a VAF consistent with sub-clonality, approx. 20%) suggesting that these events may increase cancer development and/or progression without being the primary driver mutation12.
Spectrum and prevalence of core and linker histone mutation rates across cancer types and agesWe investigated the prevalence of histone mutations across cancers and ages (Fig. 2), resulting in redefined histone mutation rates. Core histone mutations affected 10% of all subjects (9% core histone mutant only and ~1% co-occurring core and H1 mutant, Fig. 2a), and were most common among pediatric high-grade glioma/astrocytoma (pHGG, including diffuse midline glioma (DMG), n = 63, 61%), chondrosarcoma (n = 6, 67%), head and neck squamous cell carcinoma (HNSC, n = 103, 20%), and bladder carcinoma (BLCA, n = 77, 19%). Core histone mutations were also prevalent among B cell non-Hodgkin’s lymphoma (BNHL, n = 55 subjects, 24%). These BNHL cases included a subset harboring co-occurring core and H1 mutations (n = 20, 9% of entire BNHL cohort), indicating a larger-than-recognized role for histone alterations in lymphomas, beyond the established role for H1 mutations20,21. Across other cancers, H1 mutations were relatively rare, found in only 2% of subjects (Fig. 2a). H1 mutations occurred at the highest rates in BNHL (in addition to the previously mentioned 9% co-occurring core and linker histone mutants, another 7% of the BNHL cohort harbored linker histone mutations but no core histone mutations), esophageal carcinoma (ESO, n = 15, 5%), HNSC (n = 23, 4%) and BLCA (n = 18, 4%). With the exception of BNHL, <1.5% of subjects from any other cancer type harbored co-occurring core and linker histone mutations.
Fig. 2: Histone mutation rates and clinical implications across cancers.
a Summary characteristics of subjects harboring core, co-occurring core and linker, or linker histone mutations. The number and percentage of affected cases (out of n = 12,743 total; top row), sex and age distribution (rows 2-3), and the most affected cancer types (bottom row) are shown. For most affected cancer types, only those with ≥5 (core; linker) or ≥3 (co-occurring core and linker) mutant subjects are shown. b Histone mutation rates across age groups (pediatric, AYA, adult). Bracketed numbers = number of mutant subjects. Percent of mutant subjects from each cohort is indicated in colored boxes (core = blue, co-occurring core and linker mutant = green, linker = yellow). AYA and adults: the top 15 cancers with the highest mutation rates, and with ≥5 mutant subjects, are shown (except for AYA medulloblastoma, 3 mutant subjects). Gray italics: tissue representing the cancer type is not shown in the diagram. Significantly shorter PFS (left) and OS (right) outcomes in core histone mutant adrenocortical carcinoma (c) and uterine carcinosarcoma (d) relative to histone WT subjects, and among linker histone mutant mesothelioma (e) relative to histone wildtype mesothelioma subjects. P-values were determined by log-rank (Mantel–Cox) tests. Abbreviations: pHGG pediatric high-grade glioma (hem. hemispheric, mid. midline), LIHC liver hepatocellular carcinoma, COAD colon adenocarcinoma, STAD stomach adenocarcinoma, CESC cervical squamous cell carcinoma and endocervical adenocarcinoma, NSCLC non-small cell lung cancer, UCEC uterine corpus endometrial carcinoma, NF neurofibroma, READ rectum adenocarcinoma, BLCA urothelial bladder carcinoma, HNSC head and neck squamous cell carcinoma, ESO esophageal carcinoma, BNHL B cell non-Hodgkin’s lymphoma, OV ovarian adenocarcinoma, CS chondrosarcoma, BRCA breast carcinoma, LGG low-grade glioma, ATRT atypical teratoid/rhabdoid tumor, GBM glioblastoma multiforme, THCA thyroid carcinoma, ACC adrenocortical carcinoma, TGCT testicular germ cell tumor, MESO mesothelioma, PFS progression free survival, OS overall survival, WT wildtype. Created with BioRender.com.
We also considered histone mutation rates in the context of patient age (pediatric, AYA, adult; Fig. 2b). Among the pediatric cancer population, histone mutations affected CNS tumors (primary CNS lymphoma, n = 1, 100%; HGG/astrocytoma, n = 55, 64%; neurofibroma/plexiform, n = 1, 17%; atypical teratoid/rhabdoid tumors (ATRT), n = 3, 12%; medulloblastoma, n = 6, 3%; ependymoma, n = 1, 3%; and low-grade glioma/astrocytoma (LGG), n = 5, 2%) and BNHL (n = 2, 12%). Among AYA subjects, in addition to CNS tumors (germinoma, n = 1, 100%; HGG, n = 9, 50%; GBM, n = 3, 10%; medulloblastoma, n = 3, 6%; LGG, n = 10, 3%) and BNHL (n = 6, 46%), histone mutations affected cancers including cervical squamous cell carcinoma and endocervical adenocarcinoma (CESC, n = 18, 22%), breast invasive carcinoma (BRCA, n = 15, 17%), HNSC (n = 3, 15%) and adrenocortical carcinoma (ACC, 3, 9%) (Fig. 2b). In adult cancers, histone mutation rates were generally higher when compared to pediatric and AYA, consistent with ageing-associated somatic mutagenesis26,27. Among adults, histone mutation rates were most elevated in BNHL (n = 64, 32%), HNSC (n = 123, 25%), BLCA (n = 94, 24%), ESO (n = 61, 22%), and CESC (n = 41, 20%). Histone mutations were less prevalent in adult CNS tumors (GBM, n = 23, 6%; LGG, n = 17, 6%) compared to pediatric entities.
Clinical implications of core and linker histone mutations within cancer typesWe investigated the clinical implications of histone mutations by performing Kaplan–Meier survival comparisons stratifying patients into histone mutant subtypes (e.g., core histone mutant, linker histone mutant, histone wildtype). Among patients diagnosed with ACC or uterine carcinosarcoma (UCS), the presence of a core histone mutation predicted a significantly shorter progression free survival (PFS) and overall survival (OS) when compared to histone wildtype patients (Fig. 2c, d). Among patients diagnosed with mesothelioma, H1 mutant cases exhibited significantly shorter PFS and OS outcomes (Fig. 2e). These data represent the first potential association of these cancer types with prognostic histone mutations. To understand whether histone mutations associated with previously defined prognostic subtypes, we compared histone mutation frequencies in molecular subtypes of ACC28, UCS29, and mesothelioma30 in the TCGA cohort. Among the three main ACC subtypes, the poor prognosis CoC3 subtype28 was enriched for core histone mutations (Chi-square, p = 0.0394, Supplementary Fig. 2, Supplementary Data File 2). Among UCS and mesothelioma, there were no significant enrichments of histone mutation frequencies among prognostic subtypes.
Discovery of histone mutations in pediatric and AYA CNS tumorsGiven the established oncogenic role for H3 tail alterations in pHGGs, the lack of previous investigations into non-H3 K27/G34 histone mutations in these cancers, and the relatively small number of somatic mutations in pediatric compared to adult solid tumors26,27, we closely examined the histone mutation landscape across pediatric and adolescent CNS tumors. We identified non-H3 K27/G34 core and linker histone mutations in cancers including ATRT, DMG, HGG, ependymoma and medulloblastoma (Fig. 3a). Notably, two cases of H3-3A K27M mutant DMG harbored core histone (H2B) mutations (a clonal and sub-clonal), both of which were subsequently validated by Sanger sequencing of the corresponding primary tumor-derived cell lines (Fig. 3b). In one of these cases, the mutated H2B-encoding gene (H2BC6) was among those histone genes harboring the highest average VAFs at pan-cancer level, consistent with clonality (Fig. 1g).
Fig. 3: Expanded landscape of core and linker histone mutations in pediatric and adolescent CNS tumors.
a Oncoplot showing histone gene alterations in children (0–14 years) and AYA (ages 14–39 years) diagnosed with CNS tumors. b Sanger sequencing validation of H2B mutations identified in H3.3 K27M mutant DMG patients (top = H2BC6 A58 mutation; bottom = H2BC7 A111 mutation). Gene names, amino acid changes, VAFs (detected by tumor whole genome sequencing), chromosome positions and nucleotide changes are listed for each mutation. Mutated bases are labeled and indicated by yellow arrows. c Left: Enrichment of all histone mutations (including H3 K27M and H3 G34R/V) in pediatric HGG and adolescent HGG/GBM, relative to adult GBM (Chi-square tests with Bonferroni correction). Right: Enrichment of additional (non-H3 K27 or H3 G34) histone mutations in pediatric HGG relative to AYA and adult HGG/GBM (Chi-square tests with Bonferroni correction; Fisher’s exact test used to compare AYA group given small [<5] sample size). d Left: Enrichment of histone mutation rate among high-grade (HGG, GBM) relative to low-grade (LGG) gliomas across the ages, excluding H3 K27M/H3 G34 mutant subjects (Chi-square test). Right: Comparison of histone mutation rates between pediatric HGG and LGG (Fisher’s exact test). e Left: Age at diagnosis of core histone mutant (H2A/H2B/H4 mutant, n = 4), H3 G34R mutant (n = 4) and histone wildtype (n = 40) pHGG. P < 0.05, Mann–Whitney test with Bonferroni correction. Right: Younger age at diagnosis of H3.1 K27M mutant (n = 5) relative to H3.3 K27M mutant (n = 47) DMG patients (p < 0.005, Mann–Whitney test with Bonferroni correction). Two subjects harboring co-occurring H2B/H3.3K27M mutations presented at a slightly younger age when compared to H3.3K27M-only DMG (n.s.). Abbreviations: VAF variant allele frequency, FS del frameshift deletion, DMG diffuse midline glioma, HGG high-grade glioma, LGG low-grade glioma, ATRT atypical teratoid/rhabdoid tumor, GBM glioblastoma multiforme.
We did not identify additional histone gene alterations in H3 G34 mutant HGGs, however, the cohort size was limited (n = 8 cases). Among H3WT HGG, core histone mutations (H2A, H2B, and H4) were discovered in four subjects (hemispheric, n = 3; posterior fossa, n = 1). Intriguingly, a subset of rare pediatric brain tumors also harbored H1 mutations. This subset included the only pediatric primary CNS lymphoma case included in the study; one DMG, H3 K27-wildtype; medulloblastoma (n = 2); and ATRT (n = 2), representing the earliest report of H1 mutations in pediatric CNS tumors. Notably, the primary CNS lymphoma, DMG, and one medulloblastoma case each harbored H1 frameshift mutations, consistent with the high occurrence of this mutation type affecting the H1 family at pan-cancer level and in adult lymphomas (Fig. 1c). Our findings establish an expanded landscape of core and linker histone alterations in pHGGs and other pediatric CNS tumors, extending beyond the classical oncohistone mutations.
Histone mutation rate in pediatric, AYA, and adult gliomasGiven the observed prevalence of histone mutations among pediatric and adolescent CNS tumors, in contrast to the relative rarity of these events in adult CNS tumors (Fig. 2b), we sought to define age and tumor type-specific enrichments for histone mutations. First, we compared histone mutation rates between pediatric, AYA, and adults diagnosed with HGG/GBM (histone mutation rate was defined as the percentage of histone mutant subjects divided by the total number of mutant and wildtype subjects). When considering all histone mutations, including H3 K27M and H3 G34R/V, there was a significant difference in histone mutation rate between each of these three age groups (p = 0.0003, Chi-square tests with Bonferroni multiple testing correction, Fig. 3c, left, Table 2). Given our interest in dissecting the prevalence non-H3 K27/G34 histone mutations across cancers and ages, we subsequently filtered out any subjects harboring only H3 K27M or H3 G34R/V histone mutations. Importantly, there remained a significantly higher histone mutation rate in pediatric relative to AYA (p = 0.0015, Chi-square test with Bonferroni correction), and in pediatric relative to adult HGG/GBM (p = 0.0417, Chi-square test with Bonferroni correction) when excluding these oncohistone H3 mutations (Fig. 3c, right, Table 2). We further compared histone mutation rates between high-grade (HGG, GBM) and low-grade gliomas (LGG) across all ages, again excluding H3 K27/G34 mutant subjects. Here, we observed a significantly higher rate of histone mutations in high- relative to low-grade gliomas (p = 0.0036, Chi-square test, Fig. 3d, left). When considering only pediatric subjects, this enrichment was even more pronounced (p < 0.0001, Fisher’s exact test, Fig. 3d, right).
Table 2 Comparison of histone mutation rates across ages and tumor grades among glioma patients.Given the known associations between H3 K27M/G34 mutations and patient age at diagnosis, we next considered patient age in the context of histone mutation subtypes (e.g., non-H3 K27/G34 histone mutant pHGG/DMG). In alignment with published data4, H3 G34 mutations affected significantly older children/adolescents (median 16.8 years, n = 4) when compared to histone wildtype HGG (median 7.6 years, n = 40; p = 0.043, Mann–Whitney test with Bonferroni multiple testing correction, Fig. 3e, left). HGGs harboring core histone mutations beyond H3 K27/G34 (H2A, H2B, H4; n = 4) presented at a younger age (median 6.3 years, n = 4) than H3 G34 mutants (n.s., p = 0.086, Mann–Whitney test with Bonferroni multiple testing correction). Among patients diagnosed as H3 K27M mutant DMG, those harboring H3.1K27M mutation (median 5.5 years, n = 5) presented at a younger age than H3.3 K27M mutants (median 9.0 years, n = 47; p = 0.0051, Mann–Whitney test with Bonferroni multiple testing correction, Fig. 3e, right), again consistent with previous findings4. The two DMG cases harboring co-occurring H3.3 K27M and H2B mutations presented at a median age of 7.5 years. These two patients also trended towards a slightly shorter overall survival (OS) outcome relative to H3 K27M mutant DMGs that did not harbor additional histone mutations (median OS 7.2 months vs. 11.9 months, respectively; p = 0.079, log-rank Mantel–Cox test, Supplementary Fig. 3). While these double histone mutant DMG cases were rare, our findings warrant expansion to a larger cohort of pHGG/DMG patients to define whether those harboring additional core histone mutations may represent a distinct molecular/clinical subtype.
Mutual exclusivity and co-occurrence of histone gene mutationsWe next assessed mutual exclusivity and co-occurrence of histone mutations using Fisher’s exact tests to identify histone genes, and histone gene families, that were co-mutated more or less frequently than expected by chance. Grouping together all histone genes belonging to a single histone family (i.e., all H1-encoding genes were classified as a single group, ‘H1’) revealed that mutations affecting each histone family (H1, H2A, H2B, H3) tended towards mutual exclusivity (Fig. 4a). H1 mutations were mutually exclusive with H2A, H2B, and H3 mutations; H2A and H2B mutations were mutually exclusive with one another; and both H2A and H2B were mutually exclusive with H3 mutations. When considering individual genes, the analysis was restricted to the top 25 most mutated histone genes. Intriguingly, H3-3A and H1-4 mutations were mutually exclusive across cancers, whereas H2BC8 and H2AC15 significantly co-occurred (Fig. 4b).
Fig. 4: Mutual exclusivity and co-occurrence of histone family and histone gene mutations.
Results of Fisher’s Exact test for mutual exclusivity or co-occurrence of mutations in histone gene families (a) and in pairs of histone genes (b). Significant, p < 0.05.
Histone gene mutation bias and proliferation-associated codon usageNext, we investigated why certain histone genes (e.g., H3-3A) were highly mutated across cancers while other genes harboring the same or similar protein sequences were rarely mutated. This mutational bias might be explained by differential codon usage across histone genes. Genes that are highly expressed in proliferating, but not in differentiated, cells exhibit a proliferation-associated codon signature (i.e., their mRNA sequence consists of codons optimal for rapid translation in proliferating cells, with corresponding tRNAs abundant in the cytosol of dividing cells; accordingly, these genes can be rapidly and accurately translated into proteins31). Previous work has shown that recurrently mutated cancer driver genes harbor proliferation-associated codon signatures31,32. A comparison between H3-3A and H3-3B, which encode identical protein sequences with different 5’ untranslated regions33, revealed that H3-3A harbors a more proliferation-associated codon signature when compared to H3-3B34, in keeping with their different somatic mutation burdens as confirmed by our study (Fig. 1a).
We built upon these existing data by investigating mRNA codon usage across all histone genes. We computed the percentage of codons ending in A or T(U) (‘%A/T-ending’), a signature associated with highly expressed genes in proliferating cells31,32. H3-3A emerged as having the most proliferation-associated codon signature of all histone genes (i.e., highest %A/T-ending codons, 2.3-fold compared to median across all histone genes [55% for H3-3A relative to median of 23.5%], Fig. 5a). Other highly mutated histone genes (e.g., H3C2 and several H1-encoding genes) similarly exhibited a proliferation-associated codon bias. In fact, the %A/T-ending codons of the top 5% most mutated histone genes (H3-3A, H3C2, H1-2, H1-3, H1-4) were significantly higher when compared to other histone genes (p = 0.0047, Mann–Whitney test, Fig. 5b). Moreover, we correlated %A/T-ending codons to somatic mutation rates (log10(n + 1)/CDS, with n = mutation count and CDS = gene coding sequence length). Among H3/H4 genes, there was a significant correlation between %A/T-ending codons and somatic mutation rates (p = 0.0157, Spearman’s correlation, Fig. 5c). In contrast, only a weak trend existed between %A/T-ending codons and mutation rate among H1 genes (perhaps due to the smaller number of H1 genes included for analysis, n = 10; p = 0.166), and there was no correlation among H2A/H2B genes. Our findings point to distinctions in mutation selection between histone families and suggest that cancer cells preferentially mutate histone H3/H4 genes that are efficiently synthesized in proliferating cells, thus potentially resulting in rapid incorporation of oncohistones into chromatin.
Fig. 5: Histone gene codon usage associates with somatic mutation rate.
a The percentage of A/T-ending codons (%A/T-ending, y-axis) in the coding sequence of each histone gene (n = 88). Genes with higher %A/T-ending codons=proliferation-associated (‘Prolif’); genes with lower %=differentiation-associated (‘Dif’). Histone genes are divided by family (H1, H2A/H2B, and H3/H4), and the top five histone genes with the highest mutation burdens are labeled. The dotted line (y-axis) represents the median %A/T-ending codons across all histone genes (23.5%). b Higher %A/T-ending codons in the top five most mutated histone genes (labeled in a) relative to all other histone genes, p = 0.0047, Mann–Whitney test. Box plots show the upper and lower quartiles and the median. c Correlation between %A/T-ending codons (y-axis) and somatic mutation rate (log10(n + 1)/CDS, x-axis), in the H1, H2A/H2B, and H3/H4 histone families. H3/H4, p = 0.0157, Spearman correlations.
Pan-cancer recurrent mutation hotspots affected evolutionarily conserved and functional histone residuesWe identified the 5% most recurrently mutated histone residues (i.e., altered in ≥6 samples), and designated these residues as “histone mutation hotspots”. Our analyses revealed 41 recurrent hotspots (Fig. 6a). The greatest number of unique hotspots affected H3 histone genes (n = 14 hotspot mutations), whereas only one hotspot was present among H1 histone genes (K22del). Mutation hotspots included both known oncohistones (H3 K27M, H3 K36M), and yet-uncharacterized N terminal tail-altering mutations across all four core histone families, several of which altered epigenetically modified sites (Fig. 6a). Other mutation hotspots (H3 E94, H3 R131, H4 D68) affected key functional residues including histone-histone binding interfaces, suggesting that these mutations disrupt nucleosome binding and structural integrity, consistent with recently reported oncohistones12,13.
Fig. 6: Pan-cancer recurrent mutation hotspots affect functional and highly conserved positions of the histone protein.
a Lollipop diagrams show the position along the protein sequence of mutations affecting genes of each histone family (H1, H2A, H2B, H3, H4). Hotspot mutations (mutated in ≥6 cancer genomes) are labeled. Horizontal line indicates threshold of 5 mutation events. PTM at each residue is indicated by colored circles. Histone-histone binding interfaces are marked with green diamonds. Protein length is indicated (e.g., 213AA). Bottom right: bar graph shows the number of unique hotspots affecting each histone family. b Examples of MSA showing mutation hotspots that affect the most conserved positions of the histone protein, including functional residues (high sequence conservation and position exposed at protein surface). c Comparison of the amino acid (AA) conservation frequency (MSA) across species (‘%AA conservation’, y-axis), of histone residues mutated in 3+ genomes (n = 80) versus those mutated in only 1 genome (n = 191; p = 0.0155, Mann–Whitney test). Box plots show upper and lower quartiles and the median. d Distribution of hotspot mutations across cancers. Colors indicate the number of subjects belonging to each cancer type that harbor a mutation at the indicated mutation hotspot. Abbreviations: PTM post-translational modification, AA amino acid, VAF variant allele frequency, MSA multiple sequence alignment.
We evaluated whether mutation hotspots affected more evolutionarily variable, or conserved, positions of the histone protein using multiple sequence alignment (MSA). Several hotspots affected the most evolutionarily conserved positions of the histone protein, including functional residues (examples are shown in Fig. 6b). There was a significant association between histone residue mutation frequency and evolutionary conservation (percentage conservation across species): recurrently mutated residues (mutated in three or more cancer genomes) were more conserved across species when compared to residues that were mutated in only one genome (p = 0.0155, Mann–Whitney test, Fig. 6c). This finding provides support that recurrent mutations targeted highly conserved, functionally or structurally important residues, rather than randomly affecting variable positions of the histone protein.
We next assessed the occurrence of mutation hotspots across cancers, to identify whether these events were specific to a given tumor type or occurred more broadly across cancers. Hotspots exhibited known cancer type specificity such as H3 K27M (DMG), H3 G34R/V (pHGG), H3 K36M (HNSC, bone and cartilage tumors), and associations including H2B E76 (breast cancer, bladder cancer), H2B E35 (non-small cell lung cancer), and H3 E97 (bladder cancer) (Fig. 6d). However, many hotspots were distributed broadly across cancers, and even those associated with a given cancer type (e.g., H3 G34 to HGGs) were found to occur at a lower frequency in several other cancers. For example, H3 G34 mutations were found in ACC and uterine cancers, and H3 K27 mutations were found in breast (H3 K27R) and AML (H3 K27M) subjects (Fig. 6d). Thus, while hotspot histone mutations may be prominent features of a certain cancer type, they can also be found in rare cases of other tumor types35, providing a common link between cancers.
Core histone mutations largely resulted in loss of charged amino acidsSubsequently, we investigated amino acid changes resulting from histone mutations to define patterns of biochemical changes affecting mutant histones. Missense mutations largely resulted in loss of charged amino acids (lysine, arginine, glutamic acid) and introduction of neutrally charged residues (e.g., asparagine, cysteine, methionine) into the mutant histone protein (Fig. 7a). Indeed, the most frequently occurring amino acid changes were non-conservative substitutions (Supplementary Fig. 4A). This pattern was especially pronounced among hotspot histone mutations, which included a higher percentage of non-conservative mutations when compared to all missense mutations (i.e., including non-hotspots; Supplementary Fig. 4B, Fig. 7b). To define this trend more closely and within individual core histone families (H2A, H2B, H3, H4), we compared the ‘expected’ versus ‘observed’ mutation rate affecting each amino acid, within each histone family. We calculated the frequency at which each amino acid occurred in histone protein coding sequences among each histone family and considered this value to be the ‘expected’ mutational frequency if all amino acids were mutated equally and randomly. We compared the expected to the observed frequency (the actual number of missense mutations affecting each amino acid, divided by the total number of missense mutations affecting all amino acids). Kolmogorov-Smirnov tests for equality of distributions were used to compare the expected to the observed mutational frequencies.
Fig. 7: Enrichment of missense mutations resulting in loss of charged residues among core histone proteins.
a Number of missense mutation events resulting in substitution out (black) and substitution in (tan) of each amino acid into the mutant histone protein. b Charge changes resulting from all missense mutation (left) and from hotspot mutations (right). Solid = conservative change, striped = nonconservative change. c Comparison between observed (black) and expected (gray) mutational frequencies affecting each amino acid among core histone families. d Table summarizing the significant results from a, showing a difference in the observed versus expected mutation frequencies affecting amino acids in each core histone family. Adjusted (adj.) p-values were adjusted to account for the number of amino acids tested in the analysis. Amino acids for analysis were chosen based on visual observation of different expected versus observed frequencies. Conclusions are based on adj. p-values. Conclusion ‘Obs>Exp’ = observed frequency of mutations is significantly greater than the expected frequency; Obs<Exp = observed is significantly lower than expected frequency. Abbreviations: AA amino acid, pos positively charged, neg negatively charged amino acid.
This analysis revealed a significantly higher than expected frequency of missense mutations altering glutamic acid (E) residues in H3 histones, arginine (R) mutations in H2A and H4 histones, and lysine (K) mutations in H2B and H3 histones (Fig. 7c, d). The statistical over-representation of these mutations suggested selection for mutations altering E, R, and K histone residues in cancer genomes. This finding, together with the observation that missense mutations largely substituted in neutrally charged amino acids (Fig.
留言 (0)