Patients and controls
A total of 32 pregnant women who underwent complete curettage of the uterine cavity in Jiangxi Maternal and Child Health Hospital from January 2020 to December 2020 were enrolled in the case group, and 32 healthy women who voluntarily requested induced abortion due to unintended pregnancy during the corresponding gestational period were enrolled in the control group. In the diagnosis of missed abortion, transvaginal ultrasonography is primarily relied upon to detect empty gestational sacs or embryos/fetuses without cardiovascular beats. All included pregnant women had been screened for fetal chromosomal abnormalities, endocrine diseases, anatomical abnormalities, infections, immune diseases, trauma and medical diseases. All participants were also within 6–10 weeks of gestation and had no history of adverse pregnancy. The embryonic villous tissue and maternal decidual tissue were collected respectively during vacuum aspiration under intravenous anesthesia. All samples were immediately processed in liquid nitrogen and then stored in a -80 °C refrigerator. Ten villus and decidual samples in the EMA group and the control group were selected for PRM-based targeted proteomic analysis (see Table 1 for clinical baseline characteristics of the two groups). Based on the PRM results, Western blotting and immunohistochemistry were performed on another 22 villus samples from the EMA group and the control group. Compared with those of the control group, the clinical parameters of another 22 cases also showed no significant differences in maternal age, BMI, pregnancy duration, gravidity, parity and induced abortion. This study was supported by the Ethics Committee of Jiangxi Maternal and Child Health Hospital. All the studies provided informed consent.
Table 1 Comparison of clinical parameters of 10 patients with EMA and 10 controls that underwent HSP expression profilingProtein extraction and enzymatic hydrolysis
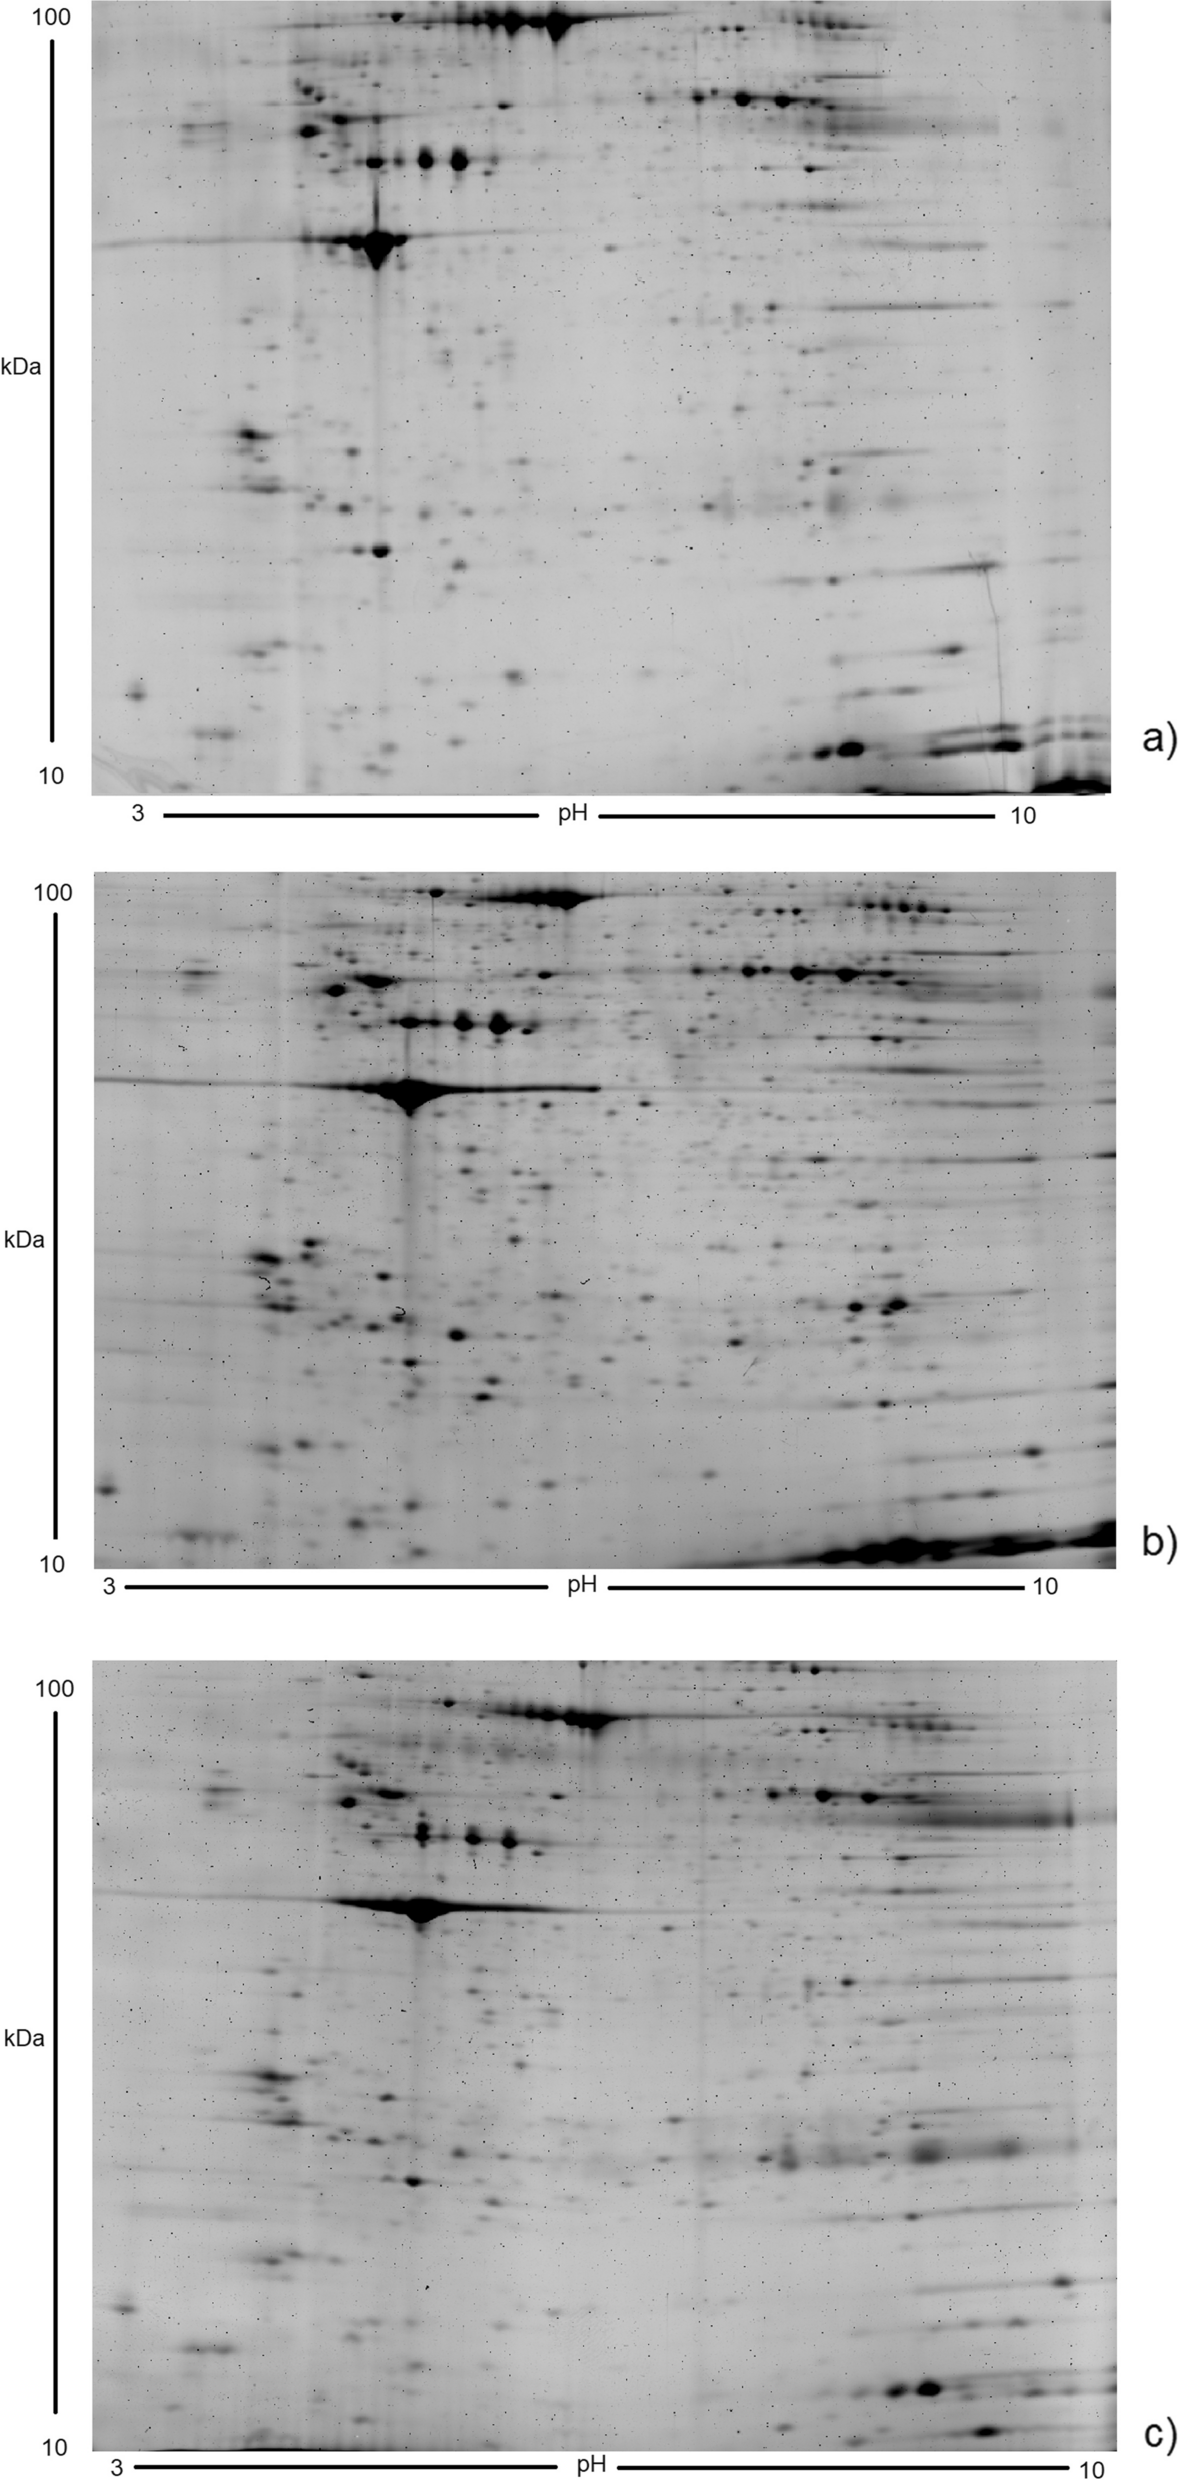
After an appropriate amount of SDT lysis solution was added, the sample was transferred to a 2 ml centrifuge tube preloaded with arenaceous quartz and a 1/4-inch ceramic bead MP 6540–424. Homogenization processing was performed using an MP homogenizer (24 × 2, 6.0 M/S, 60 s, twice). In the subsequent steps, the samples underwent an ultrasonic treatment (180 W for 10 s with intervals of 10 s for a total of ten cycles) and were boiled in a water bath for ten minutes. The supernatant was collected by centrifugation at 12,000 × g for 30 min and filtered through a 0.22 µm membrane to obtain the filtrate. Protein quantification was performed using the bicinchoninic acid (BCA) method, and 20 μg of protein from each sample was used for SDS‒PAGE electrophoresis. The areas of degradation were observed as distinct bands against a blue-stained background after Coomassie Brilliant Blue R-250 protein staining. The sample was subpackaged and stored at -80 °C for preservation.
Following enzymatic hydrolysis with FASP, the resulting peptide was subjected to C18 cartridge desalting. The lyophilized peptides were then reconstituted in a 40 µl solution of 0.1% formic acid and quantified using an enzyme-labeled assay.
Mass spectrometry analysis
A peptide mixture from the sample was prepared, and 1 μg was subjected to chromatographic separation using an HPLC system. Buffer solution A consisted of a 0.1% formic acid aqueous solution, while solution B comprised a 0.1% formic acid acetonitrile aqueous solution (84% acetonitrile). The column was equilibrated with 95% solvent A. The samples were separated via a gradient chromatography column. After high-performance liquid chromatography was conducted, a Q-Exactive HF mass spectrometer (Thermo Scientific) was utilized to perform qualitative analysis via mass spectrometry. The analysis duration was 60 min, and the positive ion detection method was utilized. The scanning range of the parent ion was set at 300–1800 m/z. The primary mass spectrometry resolution reached 60,000 atm/z200. The AGC target was set to 3e6, and the primary maximum IT was limited to 50 ms. The collection of peptides' secondary mass spectrometry was conducted using the following methods: 20 MS2 scans were triggered after each full scan, with a resolution of 15,000 at m/z200 and an AGC target of 1e5. The maximum IT for secondary mass spectrometry was set to 50 ms. HCD was used as the MS2 activation type, with an isolation window of 1.6Th and normalized collision energy set to 27.
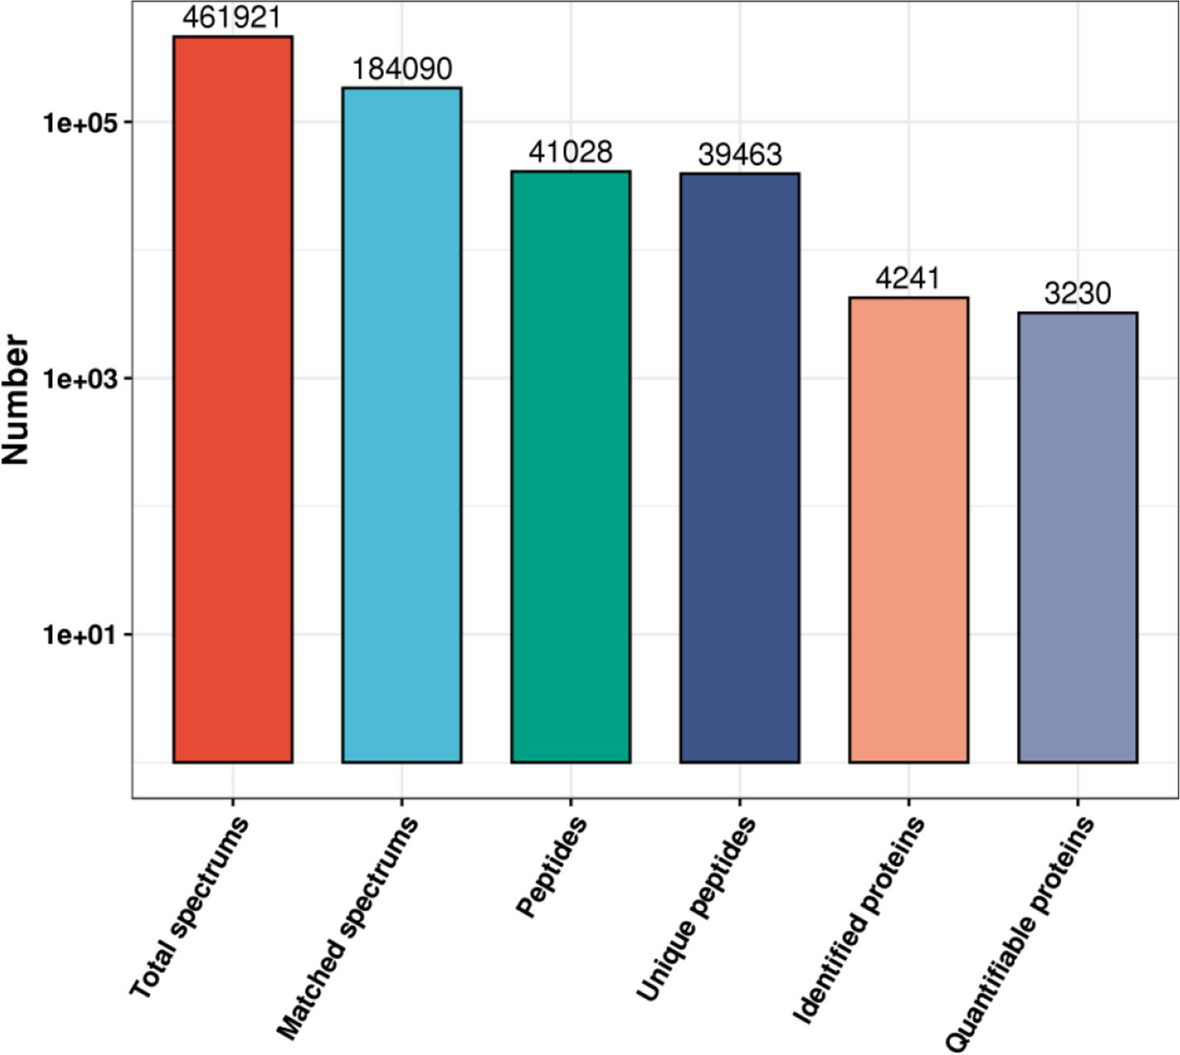
The original mass spectrum data were obtained using Proteome Discoverer v.2.2, with database search parameters set to trypsin/P enzyme and 0 missed cleavages. Peptides scoring above 40 were considered reliable, and 1–3 unique peptides were selected for each protein.
Based on the results of protein qualitative analysis, trusted peptides suitable for PRM analysis were imported into Xcalibur mass spectrometry software for PRM method setting. The peptide mixture of 10 µg was subjected to quantitative analysis using both "full scan" and "PRM" modes. The chromatographic separation and full scanning conditions were consistent with those described above. Subsequently, the mass spectrum data were analyzed utilizing Skyline software to determine the availability of selected peptides based on their repeatability and stability.
PRM detection analysis
The peptide information suitable for PRM analysis mentioned above was imported into Xcalibur software to set up the PRM method. For detection, approximately 1 µg of peptide was taken from each sample, and 20 fmol standard peptide (PRTC: ELGQSGVDTYLQTK) was added. LC-PRM/MS was used with the aforementioned PRM method to detect the target protein in each sample. The original PRM files were analyzed using Skyline 3.5.0, and after a correction was performed for the internal standard peptide signal, the expression level of the target protein in each sample was determined.
Western blotting validation
Twenty micrograms of the extracted villus protein sample was separated by SDS‒PAGE, transferred to a polyvinylidene fluoride (PVDF) membrane and sealed with 5% defatted milk powder for 1 h. The membrane was incubated with diluted primary antibodies overnight at 4 °C. The membrane was incubated with secondary antibodies for 1 h. The horseradish peroxidase (HRP) signal was detected using hypersensitive enhanced chemical luminescence (ECL) chemical reagent. The target protein bands were analyzed in ImageJ.
Human HSP90AB1 antibody (Boster, Wuhan, China, no. BM4191, 1:2000 dilution), human HSPD1 antibody (Boster, Wuhan, China, no. M01280-3, 1:2000 dilution) and human HSPA13 antibody (Proteintech, Wuhan, China, no. 12667–2-AP, 1:2000 dilution) were used as the primary antibodies for Western blot analysis. The membranes were also incubated with anti-GAPDH antibody (ZSGB-Bio, no. TA-08, 1:10,000 dilution) to verify equal protein loading.
Immunohistochemistry validation
The paraffin-embedded villus tissue sections were dewaxed and dehydrated as per routine practice. Citric acid antigen repair buffer was used for antigen repair. For blocking of endogenous peroxidase, the slices were incubated in 3% hydrogen peroxide (H2O2) at room temperature for 25 min. The tissue sections were sealed with 3% BSA at room temperature for 30 min and then incubated with 50 μl of diluted primary antibodies overnight at 4 °C. The primary antibody was anti-HSP90AB1 (Boster, Wuhan, China, no. BM4191, 1:200 dilution), anti-HSPD1 (Boster, Wuhan, China, no. M012803, 1:200 dilution) and anti-HSPA13 (Proteintech, Wuhan, China, no. 12667–2-AP, 1:200 dilution). The slices were incubated with the secondary antibodies of the corresponding species of the primary antibody at room temperature for 50 min. Finally, fresh DAB display solution was added to the slices, the color development time was controlled under the microscope, and the positive color was brownish yellow. All sections were analyzed through a modified H-score scoring system [(percentage of weak intensity area × 1) + (percentage of moderate intensity area × 2) + (percentage of strong intensity area × 3)] by two pathologists blinded to the clinical and molecular data. The H-score is a value between 0 and 300, and the larger the value is, the stronger the comprehensive positive intensity [12].
Statistical analysis
SPSS 20.0 (SPSS, Inc., Chicago, IL, USA) software was used for statistical analysis, and all data are expressed as the mean ± standard deviation (SD). Student's t test was used for comparison of quantitative data between the two groups, and P < 0.05 was considered statistically significant. Enumeration data is chi-square test. All experiments were repeated three times.


留言 (0)