
記住我
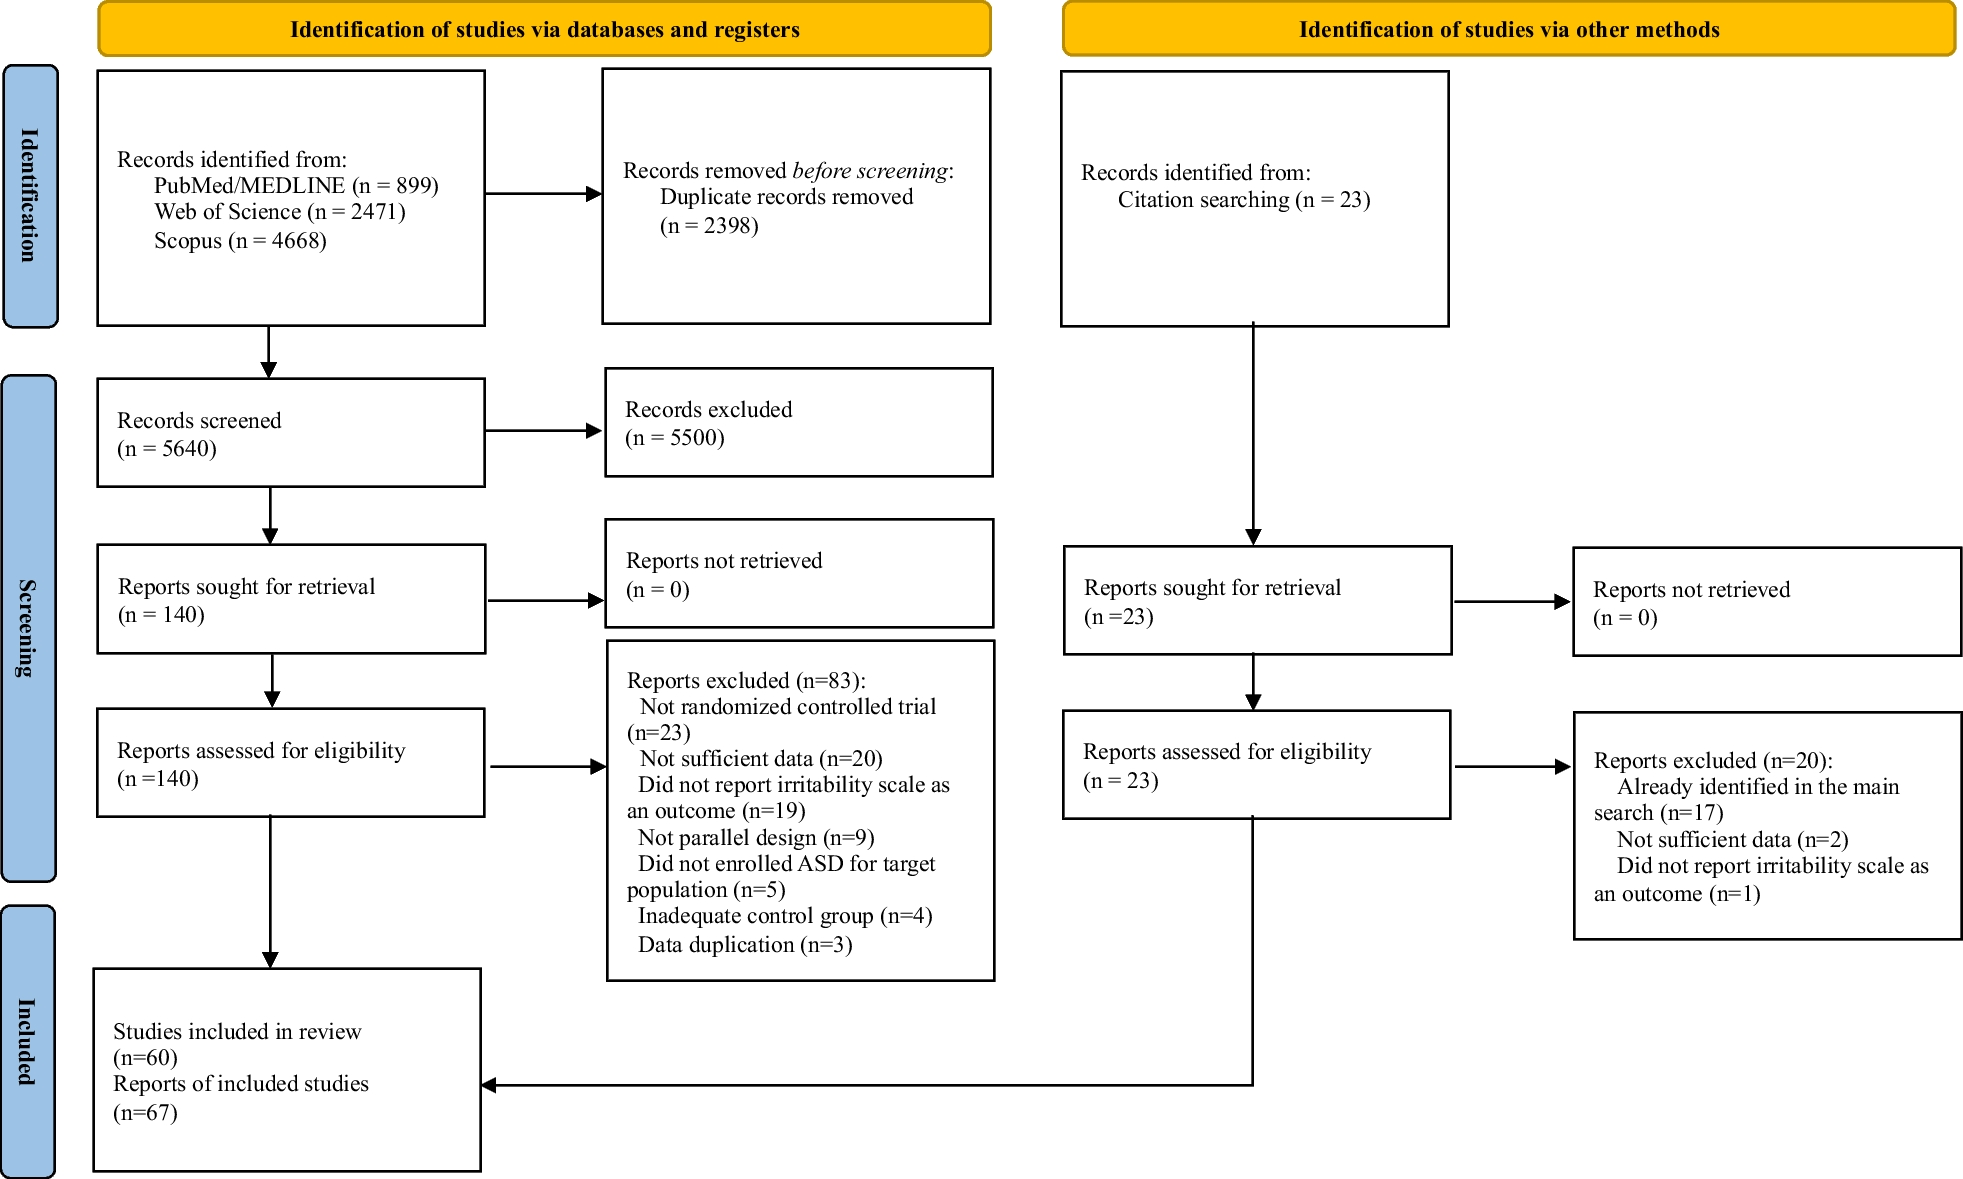


Figure 1 details the study retrieval, selection, and inclusion results in a PRISMA flow diagram. In total, the search resulted in 2132 unique records. Two hundred and fifteen articles were assessed for eligibility. Following full-text review against the inclusion and exclusion criteria, 20 articles were included.
Fig. 1
PRISMA flowchart of search strategy
Characteristics of included studiesEight of the twenty studies reported SOD/SOD-plus patients within their study samples; the majority of studies (N = 12) reported samples of only patients with ONH. However, the diagnoses of all but one [15] of these 12 studies may be contested either due to reports of endocrine deficiencies and neuroanatomical abnormalities in their samples, which suggests they met the criteria for SOD (N = 8), or due to the lack of such reports (N = 3; see Table 1). For example, Dahl et al. [16] classified their sample as ONH; however, no endocrine or neuroimaging data were reported; therefore, it is unknown whether these children experienced the additional clinical features of SOD.
Optic nerve involvement was reported across all included studies. These reports were varied, with one study reporting the proportion of participants with ONH as a feature of SOD [18]. Some studies identified the proportion of bilateral (affecting both branches of the optic nerve) and unilateral ONH within their sample [6, 15,16,17, 19,20,21,22,23,24,25,26,27,28, 30,] and other studies reported severity of visual impairment using: best corrected visual acuity (BCVA) [16]; visual acuity in relation to level of light perception (i.e. no light perception, light perception only) [6, 25, 29]; or visual impairment as mild-moderate, severe-profound, or near-to-total visual loss [15, 23, 27, 30,31,32,33].
Varied tools were used to assess neurodevelopmental impairments and ASD outcomes across the 20 included studies reported in Table 2. Most studies (14 of 20 studies) assessed cognitive-developmental outcomes, including intellectual disability and developmental delay. Intellectual disability was defined as an intelligence quotient of less than 70. The assessment of developmental outcomes varied across the studies but mainly included social-emotional, adaptive (i.e. personal self-help behaviours), motor, communication, and cognitive domains. Some authors assessed the presence of global developmental delay as a binary score of delayed versus not delayed; a developmental quotient of less than 70 was commonly used to indicate delay. Only five studies formally assessed behavioural, emotional, or social outcomes [15, 28, 31,32,33], and five studies provided a formal assessment of ASD [16, 29,30,31, 33]. The same sample was used for Jutley-Neilson et al. [31] and Jutley-Neilson et al. [32]; therefore, only unique results are discussed. Below, we summarise the main results from each of these three domains in turn.
Table 2 Prevalence of cognitive-developmental; behavioural, social, or emotional, and ASD in 20 included studiesCognitive-developmental impairmentsIntellectual disability or developmental problems were reported in 175 of 336 (52%) patients with available data (Table 2). One study [20] was not included in the grouped prevalence as insufficient information was reported to accurately estimate global developmental delay in their sample. Nevertheless, within their study, 51% of the sample displayed motor skill impairments and 43% presented perception problems [20]. One case study assessing specific spatial deficits in a 13-year-old girl with SOD and absent septum pellucidum found that she showed significant deficits in learning a floor maze and tracing lines (using kinaesthetic aids) compared to a blind-matched control [22]. Below, we discuss optic nerve involvement and neuroanatomical deficits as potential moderating factors in the association between SOD spectrum conditions and cognitive-developmental impairments.
Currently, the evidence regarding the association of optic nerve involvement or visual impairment and cognitive-developmental outcomes in SOD spectrum conditions is limited and mixed. Two studies [19, 25] observed a greater proportion of worsened developmental outcomes in participants with greater visual impairment. However, due to limited analyses, it is unclear how these findings may have been confounded by additional neuroanatomical or endocrine associations. Specifically, Signorini et al. [25] included a sample of predominantly bilateral ONH (16 of 17), and therefore, it is unknown how these results may be influenced by laterality of optic nerve involvement. Across three studies, it was consistently found that participants with bilateral ONH presented with greater impairments compared to those with unilateral ONH in relation to developmental dysfunction [20, 21] and intellectual disability [16]. These differences were likely contributed to, but not independently explained, by severity of visual impairment. Dahl et al. [16] found that the association between bilateral ONH and intellectual disability was the same for those with blindness to severe visual impairment (BCVA < 0.1) and those with moderate-to-mild visual impairment (BCVA > than 0.1) suggesting that visual impairment may not have contributed to intellectual disability and instead other clinical associations may have had greater effect. Similarly, Garcia-Filion et al. [21] found that worse visual acuity was associated with delay in adaptive and cognitive domains of the Battelle Developmental Inventory (BDI), but not overall developmental status, when adjusting for presence of corpus callosum hypoplasia. Therefore, while existing evidence suggests that bilateral (compared to unilateral) ONH is associated with greater cognitive-developmental impairment, it is uncertain yet if this association is linked with degree of visual impairment.
The presence of specific neuroanatomical and endocrine abnormalities have been associated with cognitive-developmental impairment in some, but not all, studies. Rivkees et al. [24] found a significantly higher prevalence of developmental delay in children with abnormal sleep–wake rhythmicity (100%) compared to those with normal rhythmicity (15%). Of those with sleep–wake rhythm disturbances, 66% had corpus callosum hypoplasia compared to 30% of those with normal sleep–wake rhythmicity [24]. Similarly, Garcia-Filion et al. [21] found that corpus callosum hypoplasia, but not absent septum pellucidum or pituitary gland malformations, was associated with increased developmental delay. In this study, it was also found that hypothyroidism was associated with delay in all domains of development, independent of corpus callosum hypoplasia [21]. Moreover, Severino et al. [18] reported a significant association between brain stem abnormalities and worsened developmental delay. Unexpectedly, Alt et al. [19] and Signorini et al. [25] found a high proportion of normal cognitive development in their participants diagnosed as SOD-plus (additional cortical malformations). Specifically, it was found that three of seven children with SOD-plus presented with normal cognitive development, while only two presented subnormal development and the other two borderline. Together, these findings suggest that specific neuroanatomical and endocrine deficits may be implicated in cognitive-developmental outcomes.
Behavioural, emotional, and social impairmentsForty-eight percent (88 of 184) of children presented deficits within behavioural, emotional, or social domains (Table 2). Only three studies explored associations between the clinical features of SOD spectrum and neurobehavioural outcomes, and thus firm conclusions on the role of neuroanatomical, endocrine, and optic nerve involvement in the neurobehavioural phenotype remain to be clarified.
Two studies discussed how these neurobehavioural outcomes may have been moderated by visual impairment. Children with profound visual impairment were significantly more likely to present one of social communication, repetitive, or restrictive behavioural difficulties as well as presenting all three dysfunctions together, than children with severe visual impairment [33]. Jutley-Neilson et al. [32] similarly found a trend towards greater sensory processing difficulties in children with greater visual impairment. However, for both studies [32, 33], the distributions of additional neurological and hormone abnormalities across the visual impairment groups were unknown, and therefore may have confounded the pattern of results.
Controlling for visual loss, Webb et al. [15] recruited participants with no to mild-moderate visual impairment and normal cognition, and reported greater dysfunction on the anxious/depressed, withdrawn, thought problems, attention, aggressive, internalising, and externalising subscales of the CBCL, in addition to the global score, for the ONH group compared to age and sex-matched controls. Within the ONH group, four of 11 (36%) children had global CBCL scores within the range indicating presence of a clinical diagnosis. Importantly, the association of behavioural and emotional symptoms and ONH was independent of intellectual ability and visual impairment. It was also found that significantly reduced ventral cingulum fractional anisotropy (i.e. an index of white matter integrity) was associated with greater levels of behavioural problems [15]. Given that neurobehavioural impairments arise in the absence of visual loss, specific brain mechanisms may better explain the occurrence of these problems.
Autism spectrum disorderAutism spectrum disorder was measured using screening tools, validated questionnaires, and formal clinician diagnosis. Across five studies, 65 of 187 (35%) children presented a diagnosis of ASD or clinical level of symptoms (Table 2). Evidence for the aetiology underlying this prevalence, and the limitations of drawing firm conclusions, are discussed below.
Three studies assessed whether the prevalence of ASD symptoms depended on severity of visual impairment or optic nerve involvement. Parr et al. [33] found that the prevalence of ASD was numerically higher in children with profound visual impairment (36%) compared to those with severe visual impairment (27%), but this difference was not statistically significant. Jutley-Neilson et al. [31] found that children with greater visual loss had greater mean rank scores above the SCQ clinical cut-off for ASD than those with lesser visual impairment. However, it should be noted that the SCQ is not sensitive to the origin of abnormalities in social, communication, and restrictive behaviours in children with greater visual impairment, which may be specific adaptations following visual loss [31]. Dahl et al. [16] stratified ASD diagnosis in their sample by ONH type (i.e. bilateral or unilateral); five of 21 (24%) children with bilateral ONH and two of 21 (10%) children with unilateral ONH received a clinical diagnosis of ASD. This difference was not significant, and importantly, no association between visual acuity and ASD was reported in this sample [16]. Currently, the evidence regarding the association of ASD symptoms and visual impairment is mixed at best.
Ambiguity on the contribution of visual impairment to ASD may be partly limited by available measures. Williams et al. [29] compared ASD diagnoses across four methods of assessment: clinician, and adapted versions (for visual loss) of the Autism Diagnostic Observation Scale (ADOS) [34], the Autism Diagnostic Interview-Revised (ADI-R) [35], and ADI-R current behaviour (ADI-Rcb) subscale. Consistent diagnoses were only reached in three of seven children and the remaining four children had mixed diagnoses across each measure. One child was diagnosed with pervasive developmental disorder (PDD) by a clinician, autism by the ADOS, and no ASD by the ADI-R and ADI-Rcb [29]. The remaining three children were not diagnosed with ASD by the clinician, ADOS, or ADI-Rcb; however, received diagnoses of autism or PDD on the ADI-R [29]. Measures sensitive to visual impairment therefore remain to be developed and thus may limit conclusions on the prevalence and aetiology of ASD in these populations.
留言 (0)