
Remember me


Five healthy male beagle dogs (13 ± 0.6 months-of-age; mean weight: 12 ± 2 kg) were used in this study (Shaanxi Junxing Biotechnology Co., Ltd.). The experimental protocol was approved by the Institutional Animal Care and Use Review Committee of the School of Stomatology, Fourth Military Medical University (approval code: 2021kq-003). This study was performed in accordance with ARRIVE guidelines for preclinical animal studies. Adequate measures were taken to minimize pain or discomfort for the animals.
Surgical procedureThe beagles were kept in individually cages at an ambient temperature of 25 °C and a relative humidity of 50 ± 10%, with a soft diet to minimize damage to orthodontic appliances. Researchers monitored beagles twice a day to determine their health status by monitoring their weight, food, and water intake. The dogs were fasted for 12 h prior to anesthesia. The dogs were sedated by an intramuscular injection of 0.1 ml/kg xylazine hydrochloride (Sumianxin, Fourth Military Medical University Laboratory, China). Anesthesia was induced with an intravenous bolus of 3–5 ml thiopental (Shanghai Xinya Co., Ltd.) followed by intubation and maintenance of anaesthesia by inhalation of 1.5% isoflurane (Rayward, China). 4 mg/kg Carprofen (Rimadyl®, Brazil) was injected subcutaneously into beagles for 5 days following invasive surgery to provide postoperative analgesia. Local anesthesia (2–4 ml lidocaine 2% with epinephrine 1:100 000) was used at the surgical site. All dogs were intramuscularly injected with penicillin (30,000 U/kg) three days after the operation and were fed liquid food for one week.
Defect creationPrior to tooth extraction, 1% iodophor was used for oral disinfection. Bilateral first maxillary premolar extractions were performed on all dogs (Fig. 1A). Following a two-month healing period, the bone height in the area left by extraction of the first premolars was reduced. Full-thickness flaps were raised on the buccal side. Defects were created in the extraction region using diamond burs and saline irrigation. Bone defects (Fig. 1B) were created 2 mm from the second premolar’s mesial root and were approximately 5 mm in height (apico-coronally), 4 mm in depth (bucco-lingually) and 3 mm in width (mesio-distally). Then, the mucosa was adjusted and sutured. The healing of surgical defects took two months.
Tooth movement and tooth extractionThe experimental and control sides were randomly assigned to the right or left. The experimental side was chosen with the use of an electronically generated random number table.
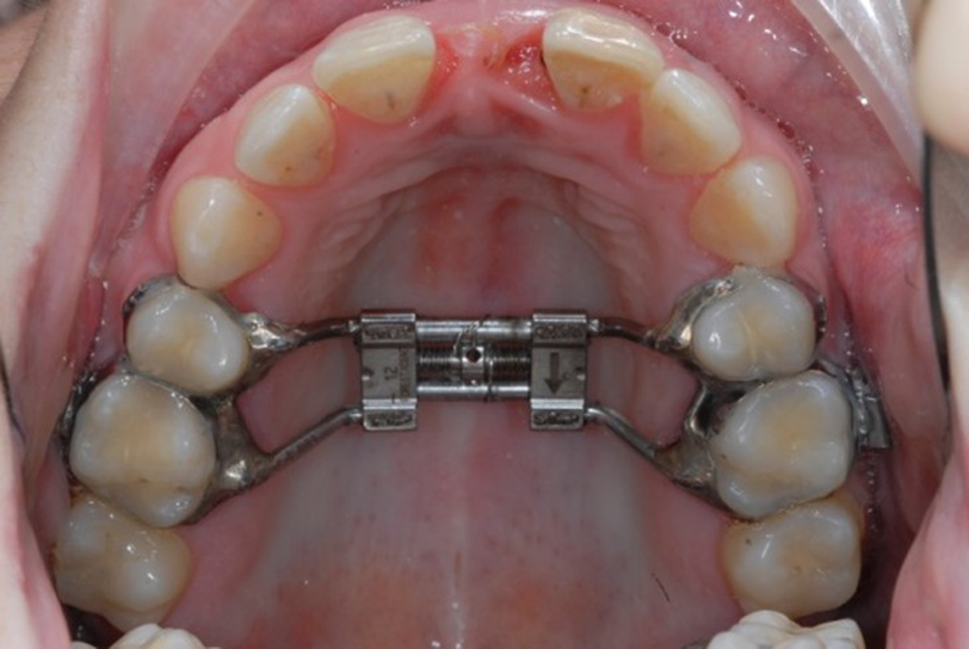
In the experimental group, the maxillary second premolar was mesially moved into the position of the missing first premolar and formed a new edentulous area. The maxillary canine and the second premolar were etched with 37% phosphoric acid. Following the sealant was applied, brackets (0.022 in) were bonded to the buccal surfaces of the two teeth with Transbond X (3 M Unitek). A stainless-steel wire (0.018 × 0.025 in) was installed through the brackets of the second premolar and the canine. A nickel-titanium spring was then used to induce movement of the second premolar mesial with a force of 150 g. The appliances and oral hygiene were checked once a week, and the force magnitude was adjusted once a month (Fig. 1C, D). This will create a new edentulous area at the original second premolar of the experimental group.
At the same time, the maxillary second premolar was extracted in the control group. In theory, the alveolar bone condition following minimally invasive tooth extraction should be better than that following periodontal disease and even better than that following the traumatic loss of teeth. Therefore, this research aimed to compare the condition of alveolar bone in the newly formed edentulous area following orthodontic tooth movement with the best-case scenario of tooth loss. If the condition of alveolar bone in the newly formed edentulous area is better than the condition of alveolar bone after the healing of the extraction socket, it can be considered that the newly formed edentulous area can meet the requirements of implant placement.
Fig. 1
Intraoral images were taken at the main stages of the experiment. (A) Extraction of the maxillary first premolar; (B) The bone level was reduced in height in the area left by the extraction of the maxillary first premolars; (C) Orthodontic protraction of the second premolar into the defect using a canine as anchorage; (D) Final position of the second premolar
Retrieval of specimensAfter six months of orthodontic treatment in the experimental group and six months of second premolar extraction healing time in the control group, all dogs were euthanized with an intravenous injection of an overdose of sodium pentobarbital (50 mg/kg). Maxillary specimens from the canine to the third premolar, were fixed in 10% formalin for one week.
Micro-computed tomography (CT): reconstruction and analysisMicro-CT (Inveon, Siemens, Erlangen, Germany) was used to scan all samples at 30 μm resolution and with a source voltage of 80 kV and a current of 500 µA. Micro-CT software (Inveon Research Workplace) was used to reconstruct three-dimensional images for all specimens and analyze the key structural parameters of bone tissue. In both the experimental group and the control group, we selected a cuboid region of 1.5 mm (bucco-lingually) × 1.5 mm (mesio-distally) × 4 mm (apico-coronally) as the region of interest (ROI). And we selected an ROI that was 5 mm away from the mesial cementoenamel junction (CEJ) of the third premolar to ensure that both sets of ROIs were located in the same range of neogenesis on the left and right sides. The ROI in the experimental group was located on the alveolar bone in the new edentulous area, while the ROI in the control group was located on the tooth extraction socket (Fig. 2). The key measurement parameters included bone volume fraction (bone volume/total volume, BV/TV), trabecular thickness of new bone (Tb.N), trabecular number (Tb.N), trabecular separation (Tb.Sp) and trabecular bone pattern factor (Tb.Pf).
Fig. 2
Regions of interest in the experimental group and the control group (red rectangular area). (A) Sagittal image of the experimental group; (B) Coronal image of the experimental group; (C) Axial image of the experimental group; (D) Sagittal image of the control group; (E) Coronal image of the control group; (F) Axial image of the control group
The change of alveolar bone height of the second premolarWe measured the changes in the alveolar bone height of the second premolar before and after orthodontic treatment to see if periodontal support can be maintained when the second premolar is moved into a bony defect. Micro-CT scanning images were exported in DICOM format and imported into Mimics Research software (version 21.0; Materialise, Leuven, Belgium). As shown in Fig. 3A, a green line was drawn across the sagittal and axial images and used to indicate the exact location of the coronal image. The orange line indicates the exact location of the sagittal image. We reoriented all images with the canine and third premolar as benchmarks to ensure that the two groups of data were measured at the same positions before and after orthodontic treatment. The green line was rotated through the canine’s distal CEJ and the third premolar’s mesial CEJ (Fig. 3C, D), followed by the orange line through the center of the canine root and the center of the third premolar’s mesial root (Fig. 3B). This determined the placement of the three images. We took the vertical distance from the lowest point A of the mesial alveolar bone of the second premolar to the green line as the height of the alveolar bone. The greater the value, the more alveolar bone loss.
Fig. 3
Measurement of the mesial alveolar bone height of the second premolar before and after orthodontic treatment. (A) Reference planes for the current position in the three-dimensional (3D) view; (B) The orange line through the center of the canine root (red arrow) and the center of the third premolar’s mesial root (blue arrow); (C) The mesial alveolar bone height (the distance between point A and point B) of the second premolar before orthodontic treatment. The green line was rotated through the canine’s distal cementoenamel junction (CEJ) and the third premolar’s mesial CEJ; (D) The mesial alveolar bone height (the distance between point A and point B) of the second premolar after orthodontic treatment
Measurement of alveolar bone height in the new edentulous areaWe reoriented all images with the canine and third premolar as benchmarks in the same way as above. On the green straight line, a point A was selected that was 5 mm from the third premolar’s mesial CEJ. A straight line perpendicular to the green line was drawn through point A to contact the top of the alveolar ridge at point B. The distance between point A and point B represented the bone height (Fig. 4A, B). The same procedure was used to determine the height of the alveolar bone (the distance between point C and point D) at point C which was 6 mm from the third premolar’s mesial CEJ (Fig. 4A, B). The alveolar bone height was recorded as a positive value when point B was at the crown of the green straight line. The alveolar bone height was recorded as a negative value when point B was at the root of the green line. The greater the value, the greater the alveolar bone height.
Measurement of alveolar bone width in the new edentulous areaPoint C was determined as described above (Fig. 4C). The straight green lines were moved 2 mm, 3 and 4 mm parallel to the root of point C. The alveolar bone width (the distance between point A and point B) was then measured on three coronal images (Fig. 4D).
Fig. 4
Measurement of alveolar bone height and width in the newly formed edentulous area. (A) Sagittal image from the experimental group. The green line was rotated through the canine’s distal cementoenamel junction (CEJ) and the third premolar’s mesial CEJ; (B) Sagittal image from the experimental group. The distance between point A and point B is the height of alveolar bone at a distance 5 mm from the mesial CEJ of the third premolar. The distance between point C and point D is the height of alveolar bone at a distance 6 mm from the mesial CEJ of the third premolar; (C) The green straight line was 2 mm, 3 and 4 mm away from point C; (D) Measurement of alveolar bone width on the coronal image (the distance between point A and point B)
Histological observationsThe maxilla was segmented following micro-CT scanning. We retained the new edentulous area from the experimental group and the second premolar extraction socket from the control group for histological analysis. Specimens were immersed in a 10% buffered formalin solution for one day. Then, the samples were fixed in graded series of alcohols for three weeks, embedded in a solution of methacrylate and dibutyl phthalate, cut into 200 μm sagittal sections and ground to 90 μm slices using an Exakt Cutting/Grinding System (Exakt Apparatebau, Norderstedt, Germany). Toluidine blue was used to stain the sections which were then scanned by microscopy (Leica DM6000B Upright Research Microscope, Leica Microsystems, Wetzlar, Germany) to evaluate bone trabecular morphology.
Statistical analysisIBM SPSS Statistics for Windows, Version 26.0 (Armonk, NY: IBM Corp.) was used to analyze the data. The difference of bone tissue parameters, alveolar bone height and alveolar bone width between the two groups was analyzed using nonparametric Wilcoxon signed rank tests. For each variable and group, data were pooled per animal and the respective medians and quartile ranges were computed. The level of significance was set at p ≤ 0.05.
Comments (0)