Human cell culture and characterization
Human Mb were purchased from Lonza (Walkersville, MD) and cultured in SkBMTM-2 Basal Medium with supplements (catalog #CC-3246 and #CC-3244, all from Lonza). Cells from quadriceps muscle from three different adult male donors (catalog #CC-2580, HSMM 33,406/Lot# 650,386, HSMM 30,551/Lot# 583,849, HSMM 33,607/Lot# 655,307) were passaged up to P6. Desmin immunofluorescence (ab8470, Abcam, Cambridge, UK) as described in detail under “Immunofluorescence” was used to confirm myogenic characteristics of the Mb. Human primary fibroblasts (HFIB-D, cryo, provitro AG, Berlin, Germany) in passage 9 (P9) served as negative control. To verify myotube formation capacity, Mb of P6 were stained for desmin after 7 days of myogenic differentiation induced by myogenic differentiation medium, containing DMEM/Ham’s F12 + 2% donor horse serum (DHS) + 1% L-Glutamin + 1% Penicillin/Streptomycin (P/S) (all from Biochrom GmbH, Berlin, Germany) + 0,4 µg/ml dexamethasone (Sigma Aldrich, St. Louis, Missouri, USA), 1 ng/ml basic fibroblast growth factor (bFGF) (Peprotech, Hamburg, Germany).
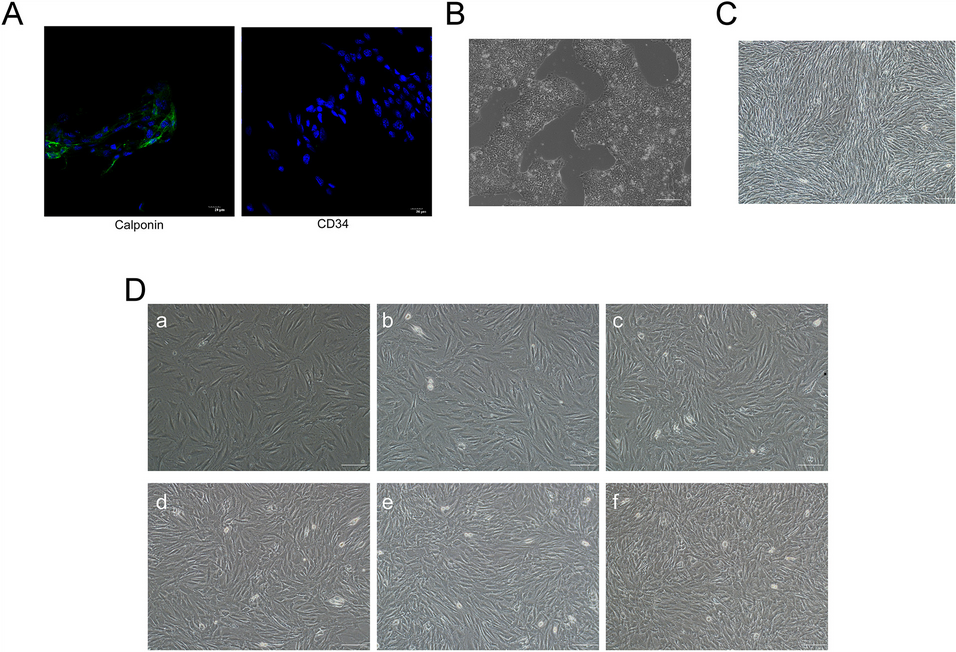
ADSC were isolated from human adipose tissue and characterized in P3 and in P6 as described previously [21]. Tissue collection was approved by the local Ethics Committee (approval number 424_18 B) in accordance with the World Medical Association Declaration of Helsinki and informed consent was obtained.
For each experiment, myoblasts from the three different donors were co-cultured with the ADSC in P6 at a ratio of 1:1 (n = 3). Since ADSC in P6 displayed the same characteristics as ADSC in P3 the higher passage of the both was used.
Determination of optimal GDF11 concentration
Co-cultures of Mb and ADSC (n = 3) were seeded as monolayers in a ratio of 1:1 in 6-well culture plates at a density of 3 × 10⁵ cells in expansion medium containing DMEM/Ham’s F 12, 10% FCS, 1% L-Glutamin, 1% P/S (all from Biochrom GmbH). After 48 h, medium was replaced by serum free differentiation medium, containing DMEM/Ham’s F12 + 0.2% Ultroser® G (Cytogen GmbH, Wetzlar, Germany) as previously described [4]. Three different concentrations of GDF11 (LifeSpan BioSciences, Seattle, WA) were added to the serum free differentiation medium: 25 ng/ml, 0.1 µg/ml, and 0.5 µg/ml. The choice for the different concentrations was based on concentrations used for in vitro experiments reported in the literature [15, 19, 45]. Medium including fresh GDF11 was changed every 2–3 days. After 3 and 7 days, CK activity was colorimetrically determined (Abcam) as previously described [4]. The amount of nicotinamide adenine dinucleotide (NADH) generated by CK was determined photometrically at 450 nm with Thermo Scientific ™ Multiskan™ GO during minute 16–20 of reaction time since after 20 min, the activity of the samples was found to have reached a plateau. For further experiments, GDF11 in a concentration of 25 ng/ml was used. To visualize myogenic potential of GDF11 in the chosen concentration, Mb and ADSC were differentiated with serum free differentiation medium + 25 ng/ml GDF11 for 7 days and immunostained for desmin as described in detail under „Immunofluorescence“. Myotube fusion index (MFI) was calculated semi-automatically via ImageJ 1.53e (National Institutes of Health, Bethesda, MD, USA) as described previously [21].
Electrospinning of PCL-collagen I-PEO-nanofibers and 3D cell culture
PCL-collagen I-PEO-nanofibers were produced by electrospinning [36]. Briefly, PCL (80.000 g/mol, Sigma Aldrich) was blended with bovine collagen type I (Symatese, Lyon, France) in a ratio of 2:1 at a 12% (w/v) solution, using acetic acid (90% v/v in dH2O, Carl Roth GmbH, Karlsruhe, Germany) as solvent. Parallel PCL-collagen I-nanofibers were electrospun on a standard electrospinning machine onto parallel metal rods on a custom-made rotating drum (15 kV, 15 cm, 1 ml/h, 50 rpm). PEO (concentration 10% (w/v), molecular weight: 900.000 g/mol, Sigma Aldrich) nanofibers were similarly spun (14 kV, 13 cm, 1 ml/h, 50 rpm). The single-fiber tensile test was performed on 5 different PCL-collagen I-PEO-fiber bundles as described by Munawar and Schubert [46]. The aligned PCL-collagen I and PEO-fibers were collected in alternate layers on plastic rings with 10 mm diameter (Minusheet carrier, Minucells and Minutissue Vertriebs GmbH, Bad Abbach, Germany). The area of the resulting scaffolds measured approximately 0,8 cm2. Scanning electron microscopy (SEM) images were taken as described below (“scanning electron microscopy”) and used for characterization of unseeded scaffolds. Fiber diameter was measured using ImageJ (National Institutes of Health, Bethesda, MD, USA, Version 1.53e). Fiber orientation was analyzed using the OrientationJ plugin (ImageJ) on 5 different images of the scaffolds taken in 10,000x magnification. This resulted in an orientation distribution histogram for each image. For cell seeding, scaffolds were sterilized in 70% ethanol, washed with PBS afterwards [36] and placed into 24 well-plates while they were soaked in DMEM/Ham’s F12 for approximately 1 h at 37 °C. ADSC and Mb were seeded with 100 µL thickened medium containing expansion medium and dissolved methyl cellulose (Sigma Aldrich) on PCL-collagen I-PEO-nanoscaffolds at 3 × 10⁵ cells in a ratio of 1:1. After 7 days of proliferation in expansion medium, differentiation was induced and continued for 28 days. As negative control for immunofluorescence staining, fibroblasts in P9 were seeded onto the nanoscaffolds as described above and allowed to proliferate in DMEM + 10% fetal calf serum (FCS) + 1% P/S (all from Biochrom GmbH) for 7 days.
Myogenic differentiation conditions
To confirm myogenic differentiation potential of Mb in P6, monolayers were seeded in 48-wells at a cell density of 20.000 and allowed to proliferate in expansion medium for 2 days until cells reached confluence. Afterwards, differentiation was induced by switching to standard differentiation medium, containing 2% donor horse serum (DHS, Biochrom GmbH) (Table 1). Co-cultures of ADSC and Mb were seeded similarly into 48-wells and were allowed to differentiate with serum free differentiation medium + 25 ng/ml GDF11 (Table 1) for 7 days. Differentiation was continued for 7 days prior to desmin staining as described in detail under “Immunofluorescence”.
For three-dimensional (3D) co-cultures, ADSC and Mb were seeded onto PCL-collagen I-PEO-scaffolds and allowed to proliferate for 7 days as described above. After proliferation, co-cultures were myogenically differentiated under three different conditions: (1) DMEM/Ham’s F12 + 0.2% Ultroser® G + 1% L-Glutamin + 1% P/S + 0.4 µg/ml dexamethason + 1 ng/ml bFGF (Peprotech, Hamburg, Germany) (serum-free medium), (2) serum-free medium + 25 ng/ml GDF11, (3) DMEM/Ham’s F12 + 2% DHS + 1% L-Glutamin + 1% P/S + 0.4 µg/ml dexamethason + 1 ng/ml bFGF (standard differentiation medium, containing serum). For every experiment, 3 scaffolds per group were analyzed (n = 3). Mb from one donor (out of 3 in total) were seeded in co-culture with the ADSC onto one scaffold per group.
Table 1 Myogenic differentiation media
Cell viability and creatine kinase activity on PCL-collagen I-PEO-nanoscaffolds
3D co-cultures (n = 3) were allowed to proliferate for 7 days and subsequently to myogenically differentiate for 7, 14, and 28 days. After each time period, water-soluble tetrazolium salt (wst)-8-assay (Promokine, Promocell GmbH, Heidelberg, Germany) of the seeded scaffolds was performed as described previously [4]. Absorbance was measured at 450 nm with Photometer Thermo Scientific™ Multiskan™ GO to assess cell viability. Percentage of viability was shown after normalization of absorbance of each differentiation period to control (proliferation only). Afterwards, CK activity was determined as described above (n = 3).
RNA isolation and quantitative PCR analysis
In 3D co-cultures (n = 3), the gene expression rate of the late myogenic markers MYH2 (myosin heavy chain 2) and ACTA1 (skeletal alpha actin) was analyzed as previously described [4]. As housekeeping gene, GAPDH (glyceraldehyde-3-phosphate dehydrogenase) was used as internal control. RNA of the samples was extracted using Trizol (Life Technologies, Carlsbad, CA, USA) and chloroform [21]. RNA was reverse-transcribed into cDNA using a QuantiTect Reverse Transcription Kit and a Sensiscript Reverse Transcription Kit (both from Qiagen GmbH). cDNA was amplified through quantitative real-time PCR using SsoAdvanced Universal SYBR Green PCR Supermix (Bio-Rad, Hercules, CA, USA) and Light Cycler (Bio-Rad CFX96 Touch™). Evaluation of gene expression was performed using the 2−ΔΔCt method. RNA from human muscle tissue served as control sample. The primer sequences used are given in Table 2.
Immunofluorescence
Mb in P6, myogenically differentiated Mb in P6, as well as differentiated co-cultures of ADSC and Mb were desmin-stained as previously described [4]. Briefly, cells were fixed with formaldehyde (Carl Roth GmbH), washed, and blocked in PBS with 1.5% FCS and 0.25% TritonX (Carl Roth GmbH) for one hour at room temperature. Cells were incubated with desmin primary antibody (ab8470, Abcam) at 0.5 µg/ml for one hour at room temperature.
ADSC and Mb were 3D co-cultured on PCL-collagen I-PEO-nanoscaffolds (n = 3) for 7 days before expansion medium was switched to differentiation medium (serum-free, serum-free + GDF11, standard). After 4 weeks, scaffolds were fixed, washed, blocked, and stained with anti-fast myosin skeletal heavy chain (MHC) antibody (ab91506, Abcam) at 5 µg/ml for one hour at room temperature.
Alexa Fluor 594 goat anti-mouse IgG1 cross-adsorbed secondary antibody (A-21,125, Thermofisher Scientific Inc.) was used as secondary antibody at 4 µg/ml for 30 min at room temperature for desmin stained cells and Alexa fluor 594 goat anti-rabbit IgG (H + L) (Thermofisher Scientific Inc.) was used as secondary antibody for MHC stained cells at the same conditions. After counterstaining with DAPI 1 µg/ml (Thermofisher Scientific Inc.) for 5 min, cells were subsequently analyzed and digitally photographed with a fluorescence microscope (IX83, cellSens, software, Olympus, Hamburg, Germany).
Human primary fibroblasts in P9 served as negative control.
Fluorescent intensity of MHC stained seeded nanoscaffolds was determined as a ratio of mean grey area of inverted blue channel and mean grey area of inverted red channel via ImageJ 1.53e (National Institutes of Health, Bethesda, MD, USA).
Scanning electron microscopy
After immunofluorescence analysis of the seeded scaffolds after 28 days of myogenic differentiation, microstructural analysis of the scaffolds was performed using an Auriga Fib-scanning electron microscope (SEM) (Zeiss, Oberkochen, Germany) as described previously [4]. Probes were sputter-coated with gold using a Q150T Turbo-pumped Sputter Coater (Quorum Technologies Inc., Guelph, Canada).
Statistical analysis
Shapiro-Wilk test was used to test data normality. Statistical analysis was performed with one-way analysis of variance (ANOVA) with Tukey’s multiple comparisons test or Kruskal-Wallis test with Dunn’s correction for multiple comparisons, as appropriate. Repeated measures ANOVA with Tukey’s multiple comparisons test was used for comparisons between matched variables at different time points for normally distributed data, otherwise Friedman test with Dunn’s correction for multiple comparisons was used. Pairwise comparison was done using paired t-test or Mann-Whitney test, as appropriate. Statistical analysis was performed using GraphPad Prism version 8.3 (La Jolla, CA, USA). A p-value ≤ 0.05 was considered statistically significant.


留言 (0)