
記住我
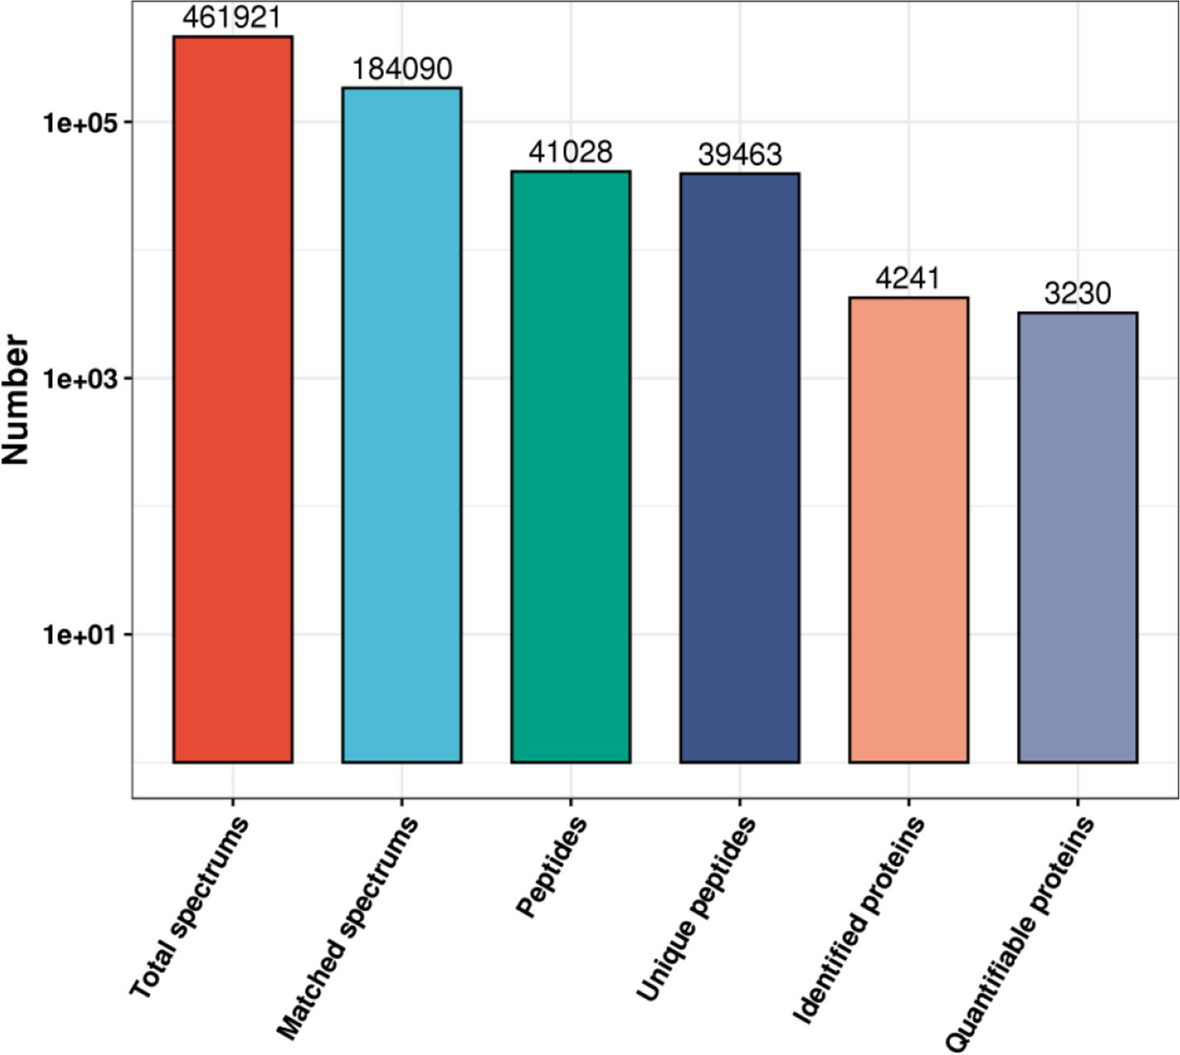


The tissue homogenates of the surgically removed PTC from 10 patients diagnosed were pooled as the carcinoma-tumor specimen (Ca-T) and the normal thyroid tissues adjacent to the lesion from the same patients were pooled as the carcinoma-normal samples (Ca-N). The extracted acetylated proteins from tumor and normal tissues were nominated as Ca-T-A and Ca-N-A. The quality of extracted proteins, quantitative accuracy of proteins, trypsin hydrolysis efficiency, mass spectral mass deviation, mass spectrometry acquisition intensity and data volume fulfilled the requirements of the quality control for proteomic assays (Suppl Fig. 1).
For global proteomics profiling, 33,726 matched spectra were achieved, and 3,214 proteins, elicited from 11,350 unique peptides, were identified with 95% confidence interval by the Peptide Prophet Algorithm. Totally 1,923 proteins were identified both in the samples of Ca-T and Ca-N. The general pattern of DEPs and non-differential expressed proteins were showed in the Volcano plot (Fig. 1A). One hundred forty-seven proteins in Ca-T were considered as DEPs in comparison with Ca-N when utilizing the standard of 1.2-fold changed and p < 0.05, among them 78 DEPs were up-regulated and 69 DEPs were down-regulated, respectively. Thirty-nine DEPs showed ≥ 1.5-fold changed, including 27 up- and 12 down-regulated ones. Nine DEPs were ≥ 2.0-fold changed, including 8 up- and 1 down-regulated ones (Fig. 1B).
Fig. 1
Volcano plots and numbers of DEPs identified in global proteomics and DEAPs in acetylated proteomics in comparison of Ca-T with Ca-N. Volcano plots of DEPs in global proteomics (A) and DEAPs in acetylated proteomics (C). Green dots represent the down-regulated proteins and red dots represent up-regulated ones. Gray dots are non-significantly changed proteins. The numbers of DEPs (B) and DEAPs (D). The changed folds of the up- and down-regulated DEPs and DEAPs are indicated on X-axis. The numbers of the changed proteins are indicated above the columns
For acetylated proteomics profiling, 5,628 matched spectra were achieved, and 636 proteins, elicited from 1,722 unique peptides, were identified with 95% confidence interval by the Peptide Prophet Algorithm. Totally 311 proteins were identified both in the samples of Ca-N-A and Ca-T-A. The general pattern of DEAPs and non-differential ones were illustrated in the Volcano plot (Fig. 1C). Total 57 DEAPs in the sample of Ca-T-A were obtained in comparison with Ca-N-A, showing ≥ 1.2-fold changed (32 up- and 25 down-regulated ones). 23 DEAPs were 1.5-fold changed (17 up- and 6 down-regulated ones) and 7 DEAPs were ≥ 2.0-fold changed (6 up- and 1 down-regulated ones) (Fig. 1D).
In the context of global proteomics, 7.6% (147) out of 1923 identified proteins showed differentially expressed between Ca-T and Ca-N, while in the context of acetylated proteomics, 18.3% (57) out of 311 identified proteins were differentially expressed. Among 147 DEPs, only 30 proteins (20.4%) were also identifiable in acetylated proteomics, whereas 43 out of 57 DEAPs (75.4%) were also detectable in global proteomics (Fig. 2A). Among 13 up-regulated and 17 down-regulated DEPs, the up-regulated (1.2-fold), unchanged (< 1.2- to > 0.83-fold) and down-regulated (< 0.83-fold) proteins in acetylated proteomics were 5, 6, 2 and 1, 5, 11 (Fig. 2A). Among 25 up-regulated and 18 down-regulated DEAPs, the up-regulated, unchanged and down-regulated proteins in global proteomics were 4, 20, 1 and 1, 11, 6, respectively (Fig. 2B).
Fig. 2
The numbers and statuses of the DEPs identifiable in acetylated proteomics (A) and the DEAPs identifiable in global proteomics (B). Yellow graphic: unfound; green graphic: downregulated < 0.83 fold; grey graphic: insignificantly changed between < 1.2 and > 0.83 fold; red graphic: upregulated > 1.2 fold. The numbers of DEPs and DEAPs identifiable in the opposite proteomic assays are separately showed on the bottom tables
Top 20 up- and down-regulated DEPs and DEAPsThe top 20 up- and down-regulated DEPs and DEAPs were summarized in Tables 1 and 2. Three of the most increased DEPs were cDNA FLJ53365 highly similar to Homo sapiens fibronectin 1, fibronectin 1 (FN1), KRT1B protein (KRT1), while three most decreased DEPs were adhesion G-protein-coupled receptor G1 (ADGRG1), cDNA FLJ53570 highly similar to Keratin, type I cytoskeletal 16 (KRT16), A-gamma globin Osilo variant, respectively (Table 1). Three up-regulated DPEs (fibronectin 1, TNC protein and epididymis secretory sperm binding protein) and five down-regulated DEPs (trefoil factor 3, hemoglobin alpha-2 globin mutant, carbonic anhydrase 1, hemoglobin subunit alpha and creatine kinase B-type) were also identifiable in acetylated proteomics. Three of the most upregulated DEAPs were ribosomal protein L18a-like protein, alpha-1-acid glycoprotein 2, eukaryotic peptide chain release factor GTP-binding subunit ERF3A, while three most downregulated ones were trefoil factor 3, thyroglobulin, histone H2B, respectively (Table 2). Among the top 20 DEAPs, 14 up- and down-regulated proteins were also detectable in global proteomics.
Table 1 Top 20 changed DEPs in global proteomicsTable 2 Top 20 changed DEAPs in acetylated proteomicsHierarchical clustering heat mapTotally 221 proteins from Ca-T and Ca-N samples were identified both in global and acetylated proteomics. To see the general profile of those proteins in global and acetylated proteomics between the groups of Ca-T and Ca-N, hierarchical clustering was performed. As shown in Fig. 3, the profile of acetylated proteomics between the groups of Ca-T and Ca-N revealed a more pronounced change than that of global proteomics. More proteins displayed increased acetylated profiling in Ca-T and decreased acetylated profiling in Ca-N.
Fig. 3
Hierarchical clustering analysis for the proteins identified in global and acetylated proteomics
Validation of the selected DEPs and DEAPs by Western blotsTo validate the screening results for DEPs and DEAPs based on MS/MS, the expressions of four proteins, including fibronectin 1 (Fib), carbonic anhydrase 1 (CA1), chitinase 3 like protein 1 (CHI3L1) and metalloproteinase inhibitor 1 (TIMP1), in the samples of Ca-T and Ca-N were evaluated by the Western blots. The changed states of those four proteins of Ca-T vs Ca-N in global proteomics and acetylated proteomics were 3.181 and 1.853 (Fib), 0.67 and 0.65 (CA1), 2.666 and undetectable (CHI3L1), 2.23 and undetectable (TIMP1), respectively (Fig. 4A). Western blots revealed that the signals of Fib, CHI3L1 and TIMP1 in the samples of Ca-T were stronger than that of Ca-N, while the band of CA1 in Ca-T sample was much weaker (Fig. 4B). Further, the acetylated extracts from Ca-T and Ca-N were prepared and subjected into the Western blots with individual specific antibodies. As shown in Fig. 4B, the signal of acetylated Fib in Ca-T was stronger than that of Ca-N. Acetylated CA1 band was observed only in Ca-N. No specific acetylated CHI3L1 and TIMP1 signal was identified both in Ca-T and Ca-N tissues. Those data validate, at least partially, the results of the proteomic assays.
Fig. 4
Western blot validation of four selected proteins (Fib, CA1, CHI3L1, TIMP1) identified in omic assays. A The changed folds or statuses of the four selected proteins in omics assays. B Western blots. Upper blots each panel: the extracts from Ca-T and Ca-N samples blotted with the specific antibodies against individual target proteins. Middle blots each panel: the extracts from Ca-T and Ca-N samples blotted with the antibody to β-actin. Lower blots each panel: the acetylated extracts from Ca-T and Ca-N samples blotted with the specific antibodies against individual target proteins
Involvement of the significant pathwaysTo analyze the involved metabolic and signaling pathways by DEPs or DEAPs in tumor tissues, Kyoto Encycloppedia of Genes and Genomes (KEGG) pathway analyses were conducted using software of KOBAS2.0. In global proteomics, 78 pathways were involved but only 4 pathways were significantly changed (P < 0.05), including mineral absorption, protein digestion and absorption, nicotinate and nicotinamide metabolism and relax in signaling pathway (Table 3). In acetylated proteomics, 37 pathways were identified, among them 3 pathways showed significance (P < 0.05), including proteoglycans in cancer, viral carcinogenesis and tight junction (Table 3).
Table 3 KEGG pathways based on DEPs and DEAPsGO ontology descriptionTo characterize the distributions of DEPs and DEAPs in cellular processes, GO analysis was conducted and the significantly affected processes (P < 0.05) were counted. In the categories of cellular component, biological process and molecular function, the numbers of the affected processes based on global proteomics were 67, 400 and 73, while those based on acetylated proteomics were 28, 121 and 3, respectively.
The top ten affected biological processes each category based on the P values and the involved protein numbers in global and acetylated proteomics were separately calculated. In the category of cellular component (Fig. 5A), they were extracellular region, extracellular matrix, extracellular region part, collagen-containing extracellular matrix, hemoglobin complex, intermediate filament, extracellular matrix component, supramolecular fiber, supramolecular complex and supramolecular polymer in global proteomics, while DNA packaging complex, protein-DNA complex, nucleosome, chromosomal part, chromatin, intracellular organelle, organelle, extracellular space, extracellular region and extracellular region part in acetylated proteomics. Two processes (extracellular region and extracellular region part) were identified in both global and acetylated proteomics.
Fig. 5
Top 10 affected processes in GO analysis based on the DEPs and DEAPs in Ca-T compared to Ca-N samples. A Category of cellular component. B Category of biological process. C Category of molecular function. The numbers of the significantly changed proteins each process are indicated on the columns
In the category of biological process (Fig. 5B), the top ten affected functions were collagen fibril organization, biological adhesion, cell adhesion, skin development, peptide cross-linking, positive regulation of T cell activation, regulation of biological quality, positive regulation of leukocyte cell-cell adhesion, T cell co-stimulation and lymphocyte co-stimulation in global proteomics, while inflammatory response, negative regulation of phosphorus metabolic process, negative regulation of protein modification process, negative regulation of phosphorylation, negative regulation of protein phosphorylation, negative regulation of phosphate metabolic process, cytokine production, response to bacterium, positive regulation of cytokine production and defense response in acetylated proteomics. These top 10 processes were not overlap between two omics assays.
In the category of molecular function (Fig. 5C), the top ten affected functions were structural molecule activity, extracellular matrix structural constituent, oxygen binding, oxygen carrier activity, metal ion binding, calcium ion binding, cation binding, molecular carrier activity, heme binding, tetrapyrrole binding in global proteomics, while protein binding, extracellular matrix structural constituent conferring compression resistance, protein N-terminus binding, kinase binding, protein kinase binding, protein heterodimerization activity, ribonuclease activity, phosphoglycerate kinase activity, G-protein coupled receptor binding and Ran GTPase binding in acetylated proteomics. None of the top 10 processes overlapped in two omics assays.
留言 (0)