
Remember me
Sepsis is life-threatening organ dysfunction caused by a dysregulated host response to infection. Similar to poly trauma, acute myocardial infarction, or stroke, relative hypovolemia has been described in the setting of septic shock. However, only 50% of patients with hemodynamic instability are fluid responsive.1,2
Early identification and appropriate management in the initial hours after sepsis develops improves outcomes. In a patient with septic shock, a fluid challenge will cause an increase in stroke volume, according to the Frank-Starling curve.3
Currently, both static and dynamic parameters are utilized for prediction of fluid responsiveness. Static parameters (e.g., central venous pressure and pulmonary artery occlusion pressure) are much less reliable than dynamic parameters, which are based on respirophasic variation in stroke volume (e.g., pulse pressure variation and changes in aortic blood flow).4 Most common dynamic parameters are invasive (arterial and/or central venous cannulation is required) and expensive. Echocardiography is a well-established method for evaluating fluid responsiveness.2,5,6
Nevertheless, measurement of left ventricular outflow tract velocities for the estimation of stroke volume is labor intense, requires specific training for adequate performance, and is not easily reproducible or obtainable.5,7
Thus, alternative methods, including brachial or carotid artery velocity, have been examined as surrogates for stroke volume in the septic shock patient population.8 Moreover, most predictive indices for volume responsiveness are not validated in patients receiving lung protective ventilatory strategies.
2 Aim of the studyTo Study the diagnostic accuracy of respiratory variation of carotid peak systolic velocity in prediction of volume responsiveness in mechanically ventilated septic shock patients in comparison with other modalities of dynamic parameters.
3 Patients and methodsOur study is a prospective interventional study that was carried out on 40 adult patients presented to critical care department, Beni-Suef university hospital with septic shock and were connected to mechanical ventilation. Our study was held during the period from October 2017 to October 2018 and was approved by the ethical committee of faculty of medicine Beni-Suef University, informed consents taken from patients first degree relatives.
3.1 Inclusion criteriaOur study included controlled mechanically ventilated adult patients whom were diagnosed as severe sepsis and septic shock as defined by The Third International Consensus Definitions for Sepsis and Septic Shock (Feb. 2016).3
3.2 Excluded from the studyAge under 18 years, non-septic causes of shock.
Known heart failure, valvular disease or arrhythmias, intra-abdominal hypertension, known Common carotid artery stenosis greater than 50%, contradictions for fluid challenge as volume overload.
4 MethodsAll patients included in this study were subjected to the following: full clinical examination, APACHE II score was calculated for all patients on admission. SOFA score was done for all patients on daily basis. Before taking measurements and during the study period The patients were sedated using Propofol bolus dose with 1–2.5 mg/kg IV loading dose and Atracurium 0.4–0.5 mg/kg IV over 60 seconds, then 0.08–0.1 mg/kg 20–45 minutes after initial dose to maintain neuromuscular block and to overcome patient desynchrony.
All patients were mechanically ventilated using volume-controlled mode (tidal volume 6–8 mL/kg, respiratory frequency 12–15 breaths per minute, positive end-expiratory pressure (PEEP) 0–5 cmH2O, plateau pressure was kept below 30 cmH2O. Ventilator settings and dosage of inotropic and vasopressors drugs were kept constant during the whole study period to be sure that the hemodynamic changes were related to volume infusion.
Mean arterial pressure will be maintained above 65 mm Hg by adjusting the doses of vasopressors and inotropic drugs before starting the study
We used 500 mL isotonic saline 0.9% as fluid bolus. It was administered rapidly over 10 minutes. Two sets of measurements were performed before and immediately after volume expansion. Cardiac output (CO), stroke volume (SV), stroke volume index (SVI), IVC distensibility index (IVC di) were measured by transthoracic echocardiography and carotid systolic velocity index (CSVindex) was measured by carotid Doppler. Respiratory variation of pulse pressure (PPV) and central venous pressure (CVP) were recorded.
Patients were randomly segregated into 2 groups according to fluid responsiveness:
1. Responders: whom CO increases after IV fluids ≥15% 2. Non-responders: whom CO remains at the same level or increases <15%. 5 Cardiac output measurementCardiac output was measured by Echocardiography performed by trained echocardiographer who is blind to non-Echocardiographic data before and after fluid bolus to measure cardiac output which was calculated from measurements of aortic annulus measured from the parasternal long axis view and velocity time integral (VTI) measured on aortic blood flow recorded using pulsed Doppler at the level of the aortic annulus from an apical five-chamber view. Applying the equation:
(A)COP=π×R2×VTI
Where R = radius of the aortic annulus in cm. The stroke volume (SV) normal value is 45 ± 13 mL/m. With this parameter we can make several derived Calculations. Stroke volume index (SVI) = SV/Body Surface Area Cardiac Output = SV × heart rate, Cardiac index = CO/Body Surface Area.
6 Inferior vena cava dynamics (IVC)Inferior vena cava diameter was obtained from a subcostal view in a longitudinal section. The IVC diameter was measured in M-mode coupled to 2D mode 2 cm before the IVC joined the right atrium. The M-mode tracing was perpendicular to the IVC.
IVC distensibility index (IVC di) = (max diameter - min diameter) / (min diameter) × 100
6.1 Carotid systolic velocity index (CSV index)Before each fluid challenge, carotid peak systolic velocity was measured with a, using a 5–10-mHz linear array transducer. After procuring a longitudinal view of the common carotid artery, pulsed Doppler analysis at 2 cm from the bifurcation was performed. The sample volume was positioned at the center of the vessel, with angulation at no more than 60°. Maximum and minimum peak systolic velocities were obtained in a single respiratory cycle, and the CSVindex was calculated with the following formula: (MaxCSV – MinCSV) / [(MaxCSV + MinCSV) / 2] × 100, expressed as a percentage.
7 ResultsPatients were segregated into two groups:
1. Responder group (20 patients): whom CO increased after IV fluids ≥15% 2. Non-responders group (20 patients): whom CO remained the same or increased <15%. 7.1 Base line charactersGender, age, acute physiology, and chronic health evaluation (APACHE II system) and SOFA score were not significantly different between both groups (P > .05) (Table 1).
Table 1 - Patient's baseline characteristics Groups (N = 20 in each arm) Characteristics Non-responders Responders P Sex Female 15 (75%) 12 (60%) .311 Male 5 (25%) 8 (40%) Age (mean ± SD) 59.6 ± 16.7 55.3 ± 19.1 .994 Result of culture -Gram +ve organisms 3(15) 7 (35) -Gram -Ve organisms 16 (80) 11 (55) -Fungal 1 (5) 2 (10) APACHE II 23.5 ± 6.2 22.7 ± 6.1 .801 SOFA 10.5 ± 2.5 11.3 ± 2.7 .373 ICU stay: 7.9 ± 2.6 9.7 ± 3.5 .110 Mortality: Non-survivors 8 (40) 5 (25) .311 survivors 12 (60) 15 (75)Table 2 showed that the mean blood pressure was significantly higher in non-responder patients before fluid bolus (P-value = .027) and the PPV% was significantly higher in responder patients (P-value < .001). Also there was a statistically significant increase of (IVC-DI) in responder patients (P-value < .001) while the rest of IVC parameters, SV and CO did not differ significantly between both groups (Table 2).
Table 2 - hemodynamic parameters before IV fluid bolus Parameters before fluids Non-responders Responders P MBP: (mm Hg) Mean ± SD 61.5 ± 7.2 56.6 ± 6.2 .027∗ CVP: (cm H2O) Median (IQR) 8 (5) 8.5 (11) .677 PPV (%): Median (IQR) 8%(5) 18.5%(4.75) <.001∗∗ IVC di (%): Median (IQR) 7 (1.7) 20 (1.35) <.001∗∗ CO (L/min) 6.5 ± 1.6 6.5 ± 2 .993 CI% 3.9 ± 0.8 3.8 ± 1.4 .716Before fluid bolus the CSVindex was significantly higher in responder group compared to non-responders (P-value < .001) (Table 3).
Table 3 - carotid systolic velocity before IV fluid bolus Parameters before fluids Non-responders Responders P CSV max(cm/s) 122.6 ± 14 130.5 ± 11.9 .063 CSV min(cm/s) 116.6 ± 13.9 108.9 ± 12.4 .072 CSV index % 4.6 ± 1.9 18.3 ± 3.1 <.001∗∗Studying parameters after fluid bolus there was a statistically significant increase of systolic and mean blood pressure in responder patients (P-value = .004 and .035, respectively) the rest of parameters did not differ significantly between both groups. There was a statistical significant increase of (IVC-di) in responder patients after fluids (P-value = .023) but the rest of IVC parameters; SV and CO did not differ significantly between both groups (Table 4).
Table 4 - hemodynamic after IV fluid bolus Parameters after fluids Non-responders Responders P MBP: (mm Hg) 67.7 ± 5.8 72.8 ± 9.9 .035∗ CVP: (cm H2O) Median (IQR) 8.5(6) 10.5 (9) .420 PPV (%): Median (IQR) 5%(3) 7.5%(5) .091 IVC di (%): Median (IQR) 6.3 (1.7) 9 (1.35) .023∗ CO (L/min) 6.9 ± 1.6 7.8 ± 2.4 .567 SV (mL) 70.1 ± 15.7 79.6 ± 17.8 .121Regarding CSV parameters, there was no statistical significant difference between responders and non-responders after fluid challenge (P-value > .05) (Table 5).
Table 5 - CSV parameters after IV fluid bolus Parameters after fluids Non-responders Responders P CSV max (cm/s) 132.2 ± 16.9 133.4 ± 14.5 .812 CSV min (cm/s) 126.7 ± 16.3 126.1 ± 13.5 .916 CSV index (%) 4 ± 1.6 5.3 ± 2.6 .083ROC curve for prediction of fluid responsiveness using baseline hemodynamic variables (Table 6):
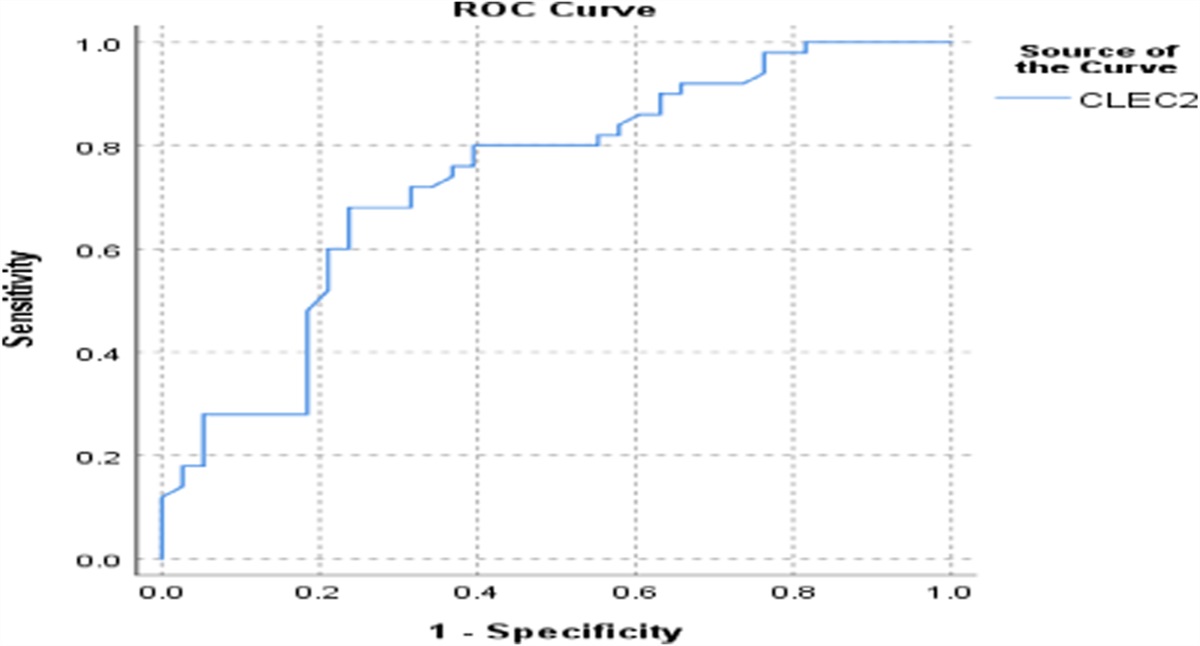
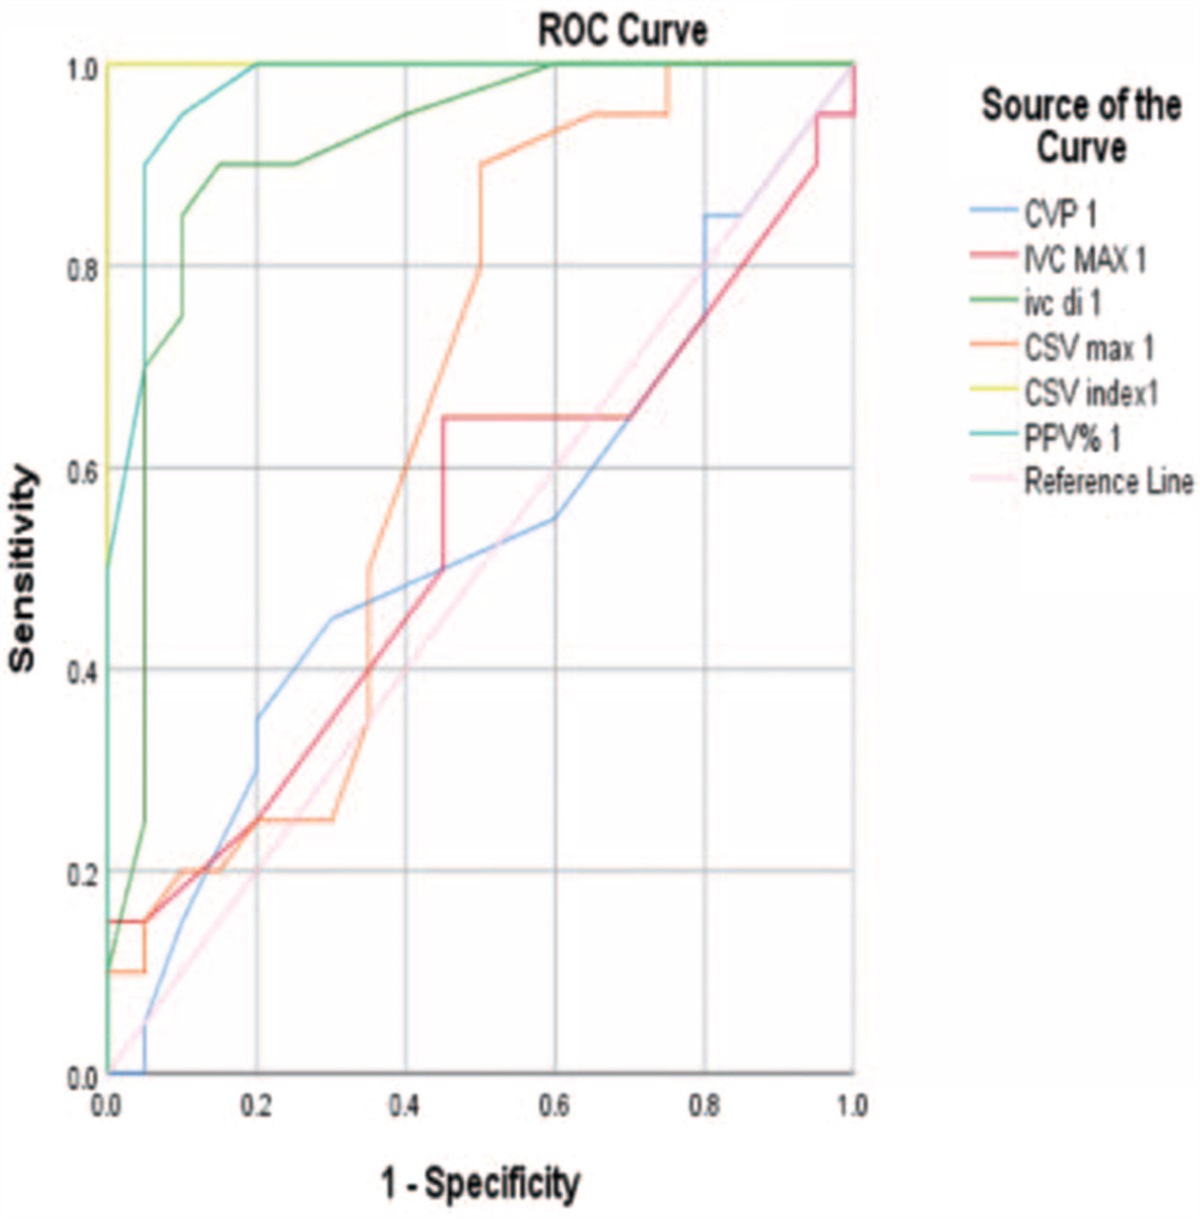
Table 6 - cut-off points for hemodynamic parameters Variable(s) AUC Cut-off Sensitivity (%) Specificity (%) CVP (cmH2O) 0.529 8.5 50 55 IVC MAX (cm) 0.535 1.65 65 55 IVC-di % 0.913 14.5 85 90 CSV max(cm/s) 0.656 121.5 90 50 CSV index (%) 1.000 10.5 95 95 PPV (%) 0.974 14 95 90ROC curve was calculated for the most important baseline parameters that called predict fluid responsiveness in mechanically ventilated patients with septic shock (Fig. 1).
 Figure 1:
 ROC curve of haemodynamic variables.
The AUC for baseline CSV index was 1.000 with 95% CI from 1 to 0.919, the cutoff point was 10.5% with sensitivity 95% and specificity was 95%.
For IVC dispensability index, the AUC was 0.913 with 95% CI from 0.813 to 1, the cutoff point 14.5% carried a sensitivity 85% and specificity 90%.
The area under the curve (AUC) for baseline PPV was 0.974 with 95% CI from 0.854 to 1, the cutoff point was 14% with sensitivity 95% and specificity was 90%.
Figure 2 showed that by following the CSV index of both groups:
The responders to fluid challenge show a significant decrease of CSV index after the fluid challenge For non-responders, did not show a significant decrease of CSV index after the fluid challenge Figure 2:
 Follow up CSV index.
8 DiscussionOur study is a prospective observational study on 40 adult patients presented to critical care department, Beni-Suef university hospital with septic shock and was connected to mechanical ventilation held during the period from October 2017 to October 2018 and was approved by the ethical committee of faculty of medicine Beni-Suef University.
Knowing whether a fluid challenge would augment cardiac output is of great importance as it would avoid unnecessary fluid administration.9
Dynamic indices have emerged based on the observation that respirophasic variations in stroke volume closely correlates with position on the Frank-Starling curve in mechanically ventilated patients. Among the dynamic indices, SVV and PPV derived from arterial waveform analysis are the two representative indices.10
Assessments of respirophasic changes in peak Doppler velocity (DV peak) at the aorta using the transoesophageal echocardiography, transthoracic echocardiography, or esophageal Doppler probe have gained interest as alternatives.11
Measuring DV peak of the carotid artery might be advantageous to measuring DV peak of the brachial artery, as the carotid artery is large and provides easy accessibility to Doppler flow acquisition due to its superficial location.12
Based on these theoretical advantages, this study aimed to study the diagnostic accuracy of bedside evaluation of respiratory variation of carotid peak systolic velocity in prediction of volume responsiveness and comparing the diagnostic performance of the diagnostic modality with some famous static and dynamic parameters in prediction of volume responsiveness in mechanically ventilated patients with septic shock.
Our study found no statistical significant difference between two groups as regarding the APACHE II score and SOFA score (P-value > .05). A significantly higher mean blood pressure was observed in non-responder patients before fluids (P-value = .027) similarly the PPV was significantly higher in responder patients before fluids (P-value < .001) but the blood pressure, heart rate, central venous pressure did not differ significantly between both groups.
This is in agreement with Song et al.8 study in which forty patients undergoing elective coronary artery bypass surgery were enrolled. Subjects were classified as responders if stroke volume index (SVI) increased ≥15% after volume expansion (6 mL/kg). The study found that before volume expansion, all parameters were lower in responders than in non-responders, except for CVP. After volume expansion, CVP, pulmonary artery occlusion pressure (PAOP), and PPV showed significant changes from the baseline in non-responders and responders.
This is in partial similarity with Ibarra-Estrada et al.13 study about “Respiratory variation in carotid peak systolic velocity predicts volume responsiveness in mechanically ventilated patients with septic shock” which included a total of 59 fluid challenges were performed in 19 patients, with a responsiveness rate of 51%. All characteristics and baseline parameters before all fluid challenges, between responders and non-responders were statistically insignificant except for SOFA score (P < .0001). There was no significant difference in PPV, IVC di and CVP between responders and non-responders with P-value: 0.08, 0.54, and 0.78, respectively.
In our study, there was a statistically significant increase of IVC di in responder patients before fluids (P-value < .001) but the rest of IVC parameters, SV and CO did not differ significantly between both groups. Also, there was a highly statistical significant increase of CSVindex in responder patients even before fluids (P-value < .001). While after fluids there was a statistical significant increase of systolic mean blood pressure in responder patients (P-value = .004 and .035) the rest of parameters did not differ significantly between both groups.
Vos et al.14 studied 49 patients who were mechanically ventilated (tidal volume <8 mL/kg of ideal weight) and had circulatory failure, but not cardiac arrhythmias. They measured hemodynamic variables before and after 100 mL of colloid infusion during 1 minute and then after the additional infusion of 400 mL during 14 minutes. They found that a reduction in PPV and SVV after the mini-fluid challenge predicted fluid responsiveness; a reduction of –2% in SVV and PPV predicted fluid responsiveness with a sensitivity of 86% and specificity of 89% and 85%, respectively.
The AUCs for PPV and SVV were excellent (0.91 and 0.92, respectively). Also, they found a small grey zone, which included between 8% and 12% of patients.
Our study found that the most important baseline patient parameters that could predict the fluid responsiveness of patient with septic shock are the CVS index followed by PPV% then IVC. For CSV index AUC was 1.000 the cut-off point was 10.5% with sensitivity 95% and specificity was 95%. For PPV, (AUC) was 0.974, the cut-off point was 14% with sensitivity 95% and specificity was 90%. For IVC distensability index, the AUC was 0.913 the cut-off point 14.5% carried a sensitivity 85% and specificity 90%.
In a recent meta-analysis, it was shown that delta systolic velocity of carotid artery, was also an accurate diagnostic value of fluid responsiveness with a pooled sensitivity of 0.85, a specificity of 0.86, and a summary area of receiver operating characteristic curve of 0.93.15
In agreement with Ibarra-Estrada et al.13 study which found that the delta carotid peak velocity following the PLR test, and PPV were significantly higher in responders than in non-responders. There was no significant difference in the IVC di or in any of the static parameters.
In our study, the baseline the CSV index, its sensitivity and specificity were 95% in prediction of fluid responsiveness at a cut off 11.5. The baseline PPV, its sensitivity was 95% and specificity was 90% in prediction of the fluid responsiveness at a cut off 14%. The baseline IVC di, it can predict the response to fluid by sensitivity 85% and specificity 90% at a cut off 14.5%.
In our study, the responders to fluid challenge show a significant decrease of CSV index after the fluid challenge.
In Ibarra-Estrada et al.13 study only delta carotid peak velocity (ΔCDPV) was positively correlated with a fluid challenge-induced change in the SVI, and ΔCDPV had the highest correlation coefficient (r = 0.84, P< .001, 95% CI 0.74–0.90). The correlation between SVV and SVI increase due to fluid challenge was low (r = 0.24, P = .058, 95% CI –0.009 to 0.47, r2 = 0.06). There was no significant correlation between the other indices and change in the SVI.
This study has some limitations. As a respirophasic dynamic index, ΔCDPV does not apply to patients with spontaneous breathing, arrhythmias, valvular disorders, significant heart failure, and common carotid stenosis. We performed carotid measurements on a single respiratory cycle; therefore, we do not know if the accuracy could have been improved with the average of three respiratory cycles.
9 Conclusions and recommendationsConclusion: Our study, showed that the most important baseline patient parameters that could predict the fluid responsiveness of patient with septic shock are; the CVS index followed by PPV% then IVC-DI.
Recommendations: further studies are needed to confirm diagnostic accuracy.
References [1]. Marik PE, Cavallazzi R, Vasu T, Hirani A. Dynamic changes in arterial waveform derived variables and fluid responsiveness in mechanically ventilated patients: A systematic review of the literature. Crit Care Med 2009;37:2642–2647. [2]. Levitov A, Marik PE. Echocardiographic assessment of preload responsiveness in critically ill patients. Cardiol Res Pract 2012;2012:819696. [3]. Hofer CK, Cannesson M. Monitoring fluid responsiveness. Acta Anaesthesiol Taiwan 2011;49:59–65. [4]. Teboul JL, Monnet X. Prediction of volume responsiveness in critically ill patients with spontaneous breathing activity. Curr Opin Crit Care 2008;14:334–339. [5]. Dinh VA, Ko HS, Rao R, Bansal RC, Smith DD, Kim TE, Nguyen HB. Measuring cardiac index with a focused cardiac ultrasound examination in the ED. Am J Emerg Med 2012;30:1845–1851. [6]. Mandeville JC, Colebourn CL. Can transthoracic echocardiography be used to predict fluid responsiveness in the critically ill patient? A systematic review. Crit Care Res Pract 2012;2012:513480. [7]. Huttemann E. Transoesophageal echocardiography in critical care. Minerva Anestesiol 2006;72:891–913. [8]. Song Y, Kwak YL, Song JW, Kim YJ, Shim JK. Respirophasic carotid artery peak velocity variation as a predictor of fluid responsiveness in mechanically ventilated patients with coronary artery disease. Br J Anaesth 2014;113:61–66. [9]. Guinot P-G, Bernard E, Levrard M, Dupont H, Lorne E. Dynamic arterial elastance predictsmeanarterial pressure decrease associatedwithdecreasing norepinephrine dosage in septic shock. Crit Care 2015;19(1):1–7. [10]. 13-Cecconi M, Monge García MI, Gracia Romero M. The use of pulse pressure variation and stroke volume variation in spontaneously breathing patients to assess dynamic arterial elastance and to predict arterial pressure response to fluid administration. Anesth Analg 2015;120(1):76–84. [11]. Monge García M, Gracia Romero M, Gil Cano A. Dynamic arterial elastance as a predictor of arterial pressure response to fluid administration: A validation study. Crit Care 2014;18(6):626. [12]. Xiao-Ting W, Hua Z, Da-Wei L. Changes in end-tidal CO2 could predict fluid responsiveness in the passive leg raising test but not in the mini-fluid challenge test: A prospective and observational study. J Crit Care 2015;30(5):1061–1066. [13]. Ibarra-Estrada, Miguel Á et al. Respiratory variation in carotid peak systolic velocity predicts volume responsiveness in mechanically ventilated patients with septic shock: A prospective cohort study. Crit Ultrasound J 7(1); (2015): 29. [14]. Vos, JJ, Kalmar, F, Struys, MMRF, Wietasch, JKG, Hendriks, HGD, Scheeren, TWL. Comparison of arterial pressure and plethysmographic waveform-based dynamic preload variables in assessing fluid responsiveness and dynamic arterial tone in patients. [15]. Yao Bo Y, Liu J, Sun Y. Respiratory variation in peripheral arterial blood flow peak velocity to predict fluid responsiveness in mechanically ventilated patients: A systematic review and meta-analysis. BMC Anesthesiol 2018;18(1):168.
Comments (0)