
記住我
Ventilator-associated pneumonia (VAP) is a hospital-acquired pneumonia that develops after more than 48 hours of mechanical ventilation (MV). It is associated with high disease burden and increased risk of mortality. Accurate diagnosis is paramount so that proper treatment can be initiated early while simultaneously avoiding antibiotic overuse and resources waste.
The clinical diagnosis of HAP and VAP is difficult in part because the clinical findings are nonspecific. The 2016 Infectious Diseases Society of America/American Thoracic Society guidelines for the management of HAP and VAP recommend a clinical diagnosis based upon a new lung infiltrate plus clinical evidence that the infiltrate is of infectious origin, which includes the new onset of fever, purulent sputum, leukocytosis, and decline in oxygenation.1
Bronchoalveolar lavage allows sampling of the lower respiratory tract fluids by the instillation and subsequent aspiration of fluid. Clinically, BAL has been helpful in the diagnosis and differentiation of different types of lung diseases. As a research tool, it is useful in the investigation of the cellular and humoral events occurring in lungs, especially in pulmonary diseases.2
The usefulness of bronchoalveolar lavage (BAL) fluid cellular analysis in pneumonia has not been adequately evaluated. This study investigated the ability of cellular analysis of BAL fluid to predict mortality and weaning failure in adult patients who are diagnosed with ventilator-associated pneumonia in comparison to clinical scoring systems.
Patients and methods Study subjectsThis was a prospective observational cohort study. It was conducted on sixty consecutive patients diagnosed as having ventilator-associated pneumonia according to IDSA 2016 guidelines.1 This study took place from March 2019 to February 2020. All patients were consented and fully informed before the procedure. Approval from the local ethics committee was obtained. All patients were admitted to the Critical care department, Cairo University.
Patients included in our study were ≥18 years old. They were intubated and mechanically ventilated ≥48 hours, irrespective of reasons for ventilation. They were diagnosed as having ventilator-associated pneumonia. Ventilator associated pneumonia (VAP) was defined as identification of a new or progressive lung infiltrate on imaging with clinical evidence that the infiltrate is of infectious origin, together with a positive pathogen identified on microbiologic respiratory sample according to the 2016 Infectious Diseases Society of America/American Thoracic Society guidelines.1
Exclusion criteria included patients younger than 18 years-old, those with refractory hypoxia on mechanical ventilation requiring high ventilatory settings (high risk patients), pregnants, patients having coagulopathy or high bleeding risk, patients with “Do not resuscitate” order or imminent death, patients with severe hemodynamic instability, and patients who refused to participate or who decided to refrain from study.
Study designAfter obtaining informed consent and detailed medical history and detailed physical examination, routine labs, and investigations. Clinical scores were calculated (CPIS, APACHE II, PSI/PORT, PIRO for VAP and IBMP-10 scores). Bronchoscopy was done, using Pentax FB-18 V fiber-optic bronchoscope. The bronchoalveolar lavage fluid was sent for microbiological assessment and cellular analysis. All patients were followed up for possible hypoxia, arrythmias or bleeding in the first 2 hours after bronchoscopy.
All patients initially received empirical antimicrobial treatment, and the regimen was adjusted according to microbiological results. In case of negative microbiological findings antimicrobial treatment was stopped.
Patients were followed-up for weaning from mechanical ventilation and mortality outcome during their ICU stay.
Statistical analysisData were coded and entered using the statistical package for the Social Sciences (SPSS) version 26 (IBM Corp, Armonk, NY). Data was summarized using mean and standard deviation. Frequency (count) and relative frequency (percentage) were mentioned for categorical data. Comparisons between quantitative variables were done using parametric t testing with Levene equation for equality of variance and if non-parametric measures, Mann-Whitney test was applied. For comparing categorical data, Chi square test was performed and McNemar test for cell counts less than 5. P value ≤ 5, was considered significant.
Sample size was calculated based on the following formula:
N=z2×p(1−p)e×prevalence
where N is number required, z is level of confidence where z = 1.96 at 95% confidence level, p is sensitivity we are trying to achieve and it was settled at 80% and e is level of margin of error which was set at 10%, incidence of VAP was estimated at 15%. And power of the study was 80%. N was calculated 41 patients, so we decided to recruit 60 patients.3
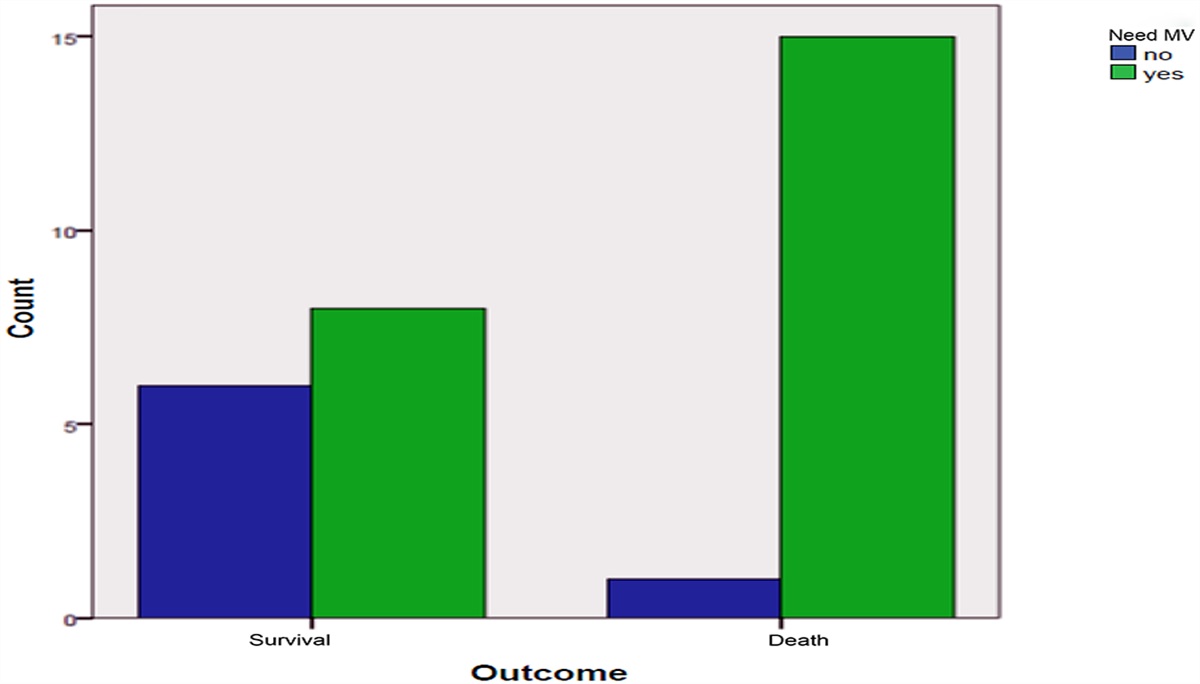
ResultsThis was a prospective observational study. Sixty patients were recruited. Our study comprised 31 males (51.7%). Average age was 59.6 ± 17.5 years old. Mortality in our study was 52 (86.7%) and failed weaning was recorded in 53 patients (88.3%). Bronchoscopic cultures revealed Gram negative growth in 53 isolates (88.3%) with no difference between those who could be weaned successfully and those who did not or between survivors and non-survivors.
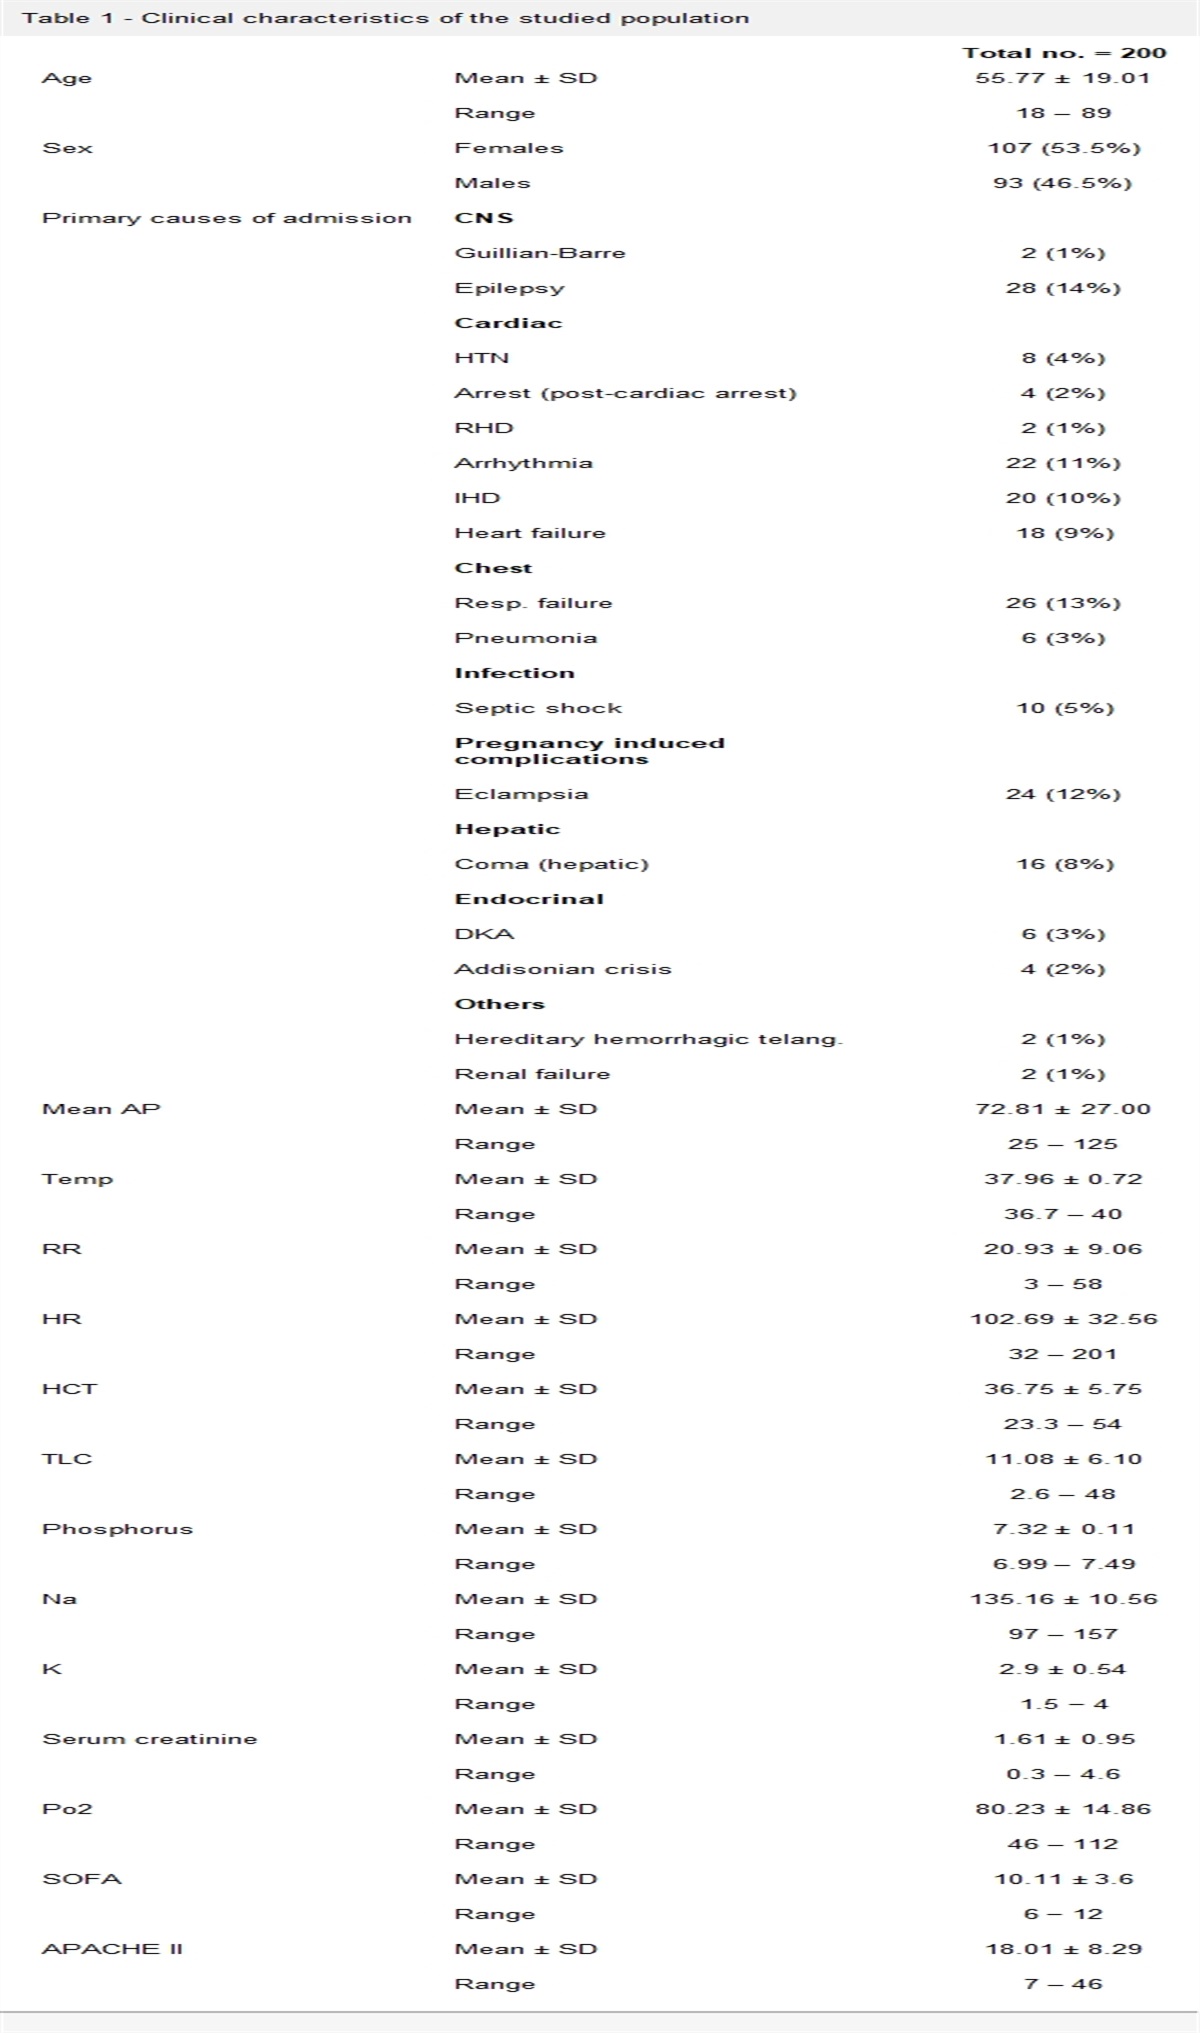
Patients were categorized according to mortality outcome into 2 groups, (those who survived and those who died). Baseline characteristics and comparisons between both groups were tabulated in Table 1. Both groups had no significant differences, apart from increased absolute and relative macrophages in BAL cellular analysis in those who died. PIRO scores were higher in those who died as well. Macrophages were excluded from analysis because macrophage data could be retrieved in only 20 patients which might have confounded our results.
Table 1 - Characteristics of demographic data, BALF cytology and clinical scores in all patients; non-survivors and survivors Survival All Survived Died P Age 59.6 ± 17.5 52.4 ± 16.7 60.8 ± 17.5 .211 Gender (Male) 31 (51.7%) 6 (75.0%) 25 (48.1%) .150 Smoking 35 (58.3%) 26 (50.0%) 5 (62.5%) .899 Diabetic 25 (41.7%) 26 (50.0%) 3 (50.0%) .936 Hypertensive 30 (50.0%) 26 (50.0%) 4 (50.0%) .917 IHD 31 (51.7%) 13 (25.0%) 4 (50.0%) .964 CVS 18 (30.0%) 20 (38.5%) 2 (25.0%0 .966 Renal 3 (5.0%) 7 (13.5%) 0 (0.0%) 1.000 PH 7.36 ± 0.07 7.37 ± 0.06 7.34 ± 0.09 .250 PO2 52.8 ± 12.1 55.1 ± 12.4 48.3 ± 10.5 .058 PCO2 49.9 ± 14.7 48.2 ± 13.7 53.4 ± 16.3 .242 HCO3 25.9 ± 3.6 26.0 ± 3.6 25.5 ± 3.6 .592 HR 115.9 ± 13.7 120.4 ± 13.1 107.2 ± 10.3 .001 MAP 92.5 ± 180.0 95.7 ± 19.5 86.3 ± 13.1 .079 MV stay 18.8 ± 14.3 14.4 ± 5.9 19.5 ± 15.1 .353 ICU stay 23.2 ± 11.8 17.1 ± 5.9 24.1 ± 12.2 .120 TLC 16.8 ± 7.7 17.8 ± 10.2 16.7 ± 7.4 .714 Neutrophil 13.9 ± 6.8 15.4 ± 9.4 13.6 ± 6.4 .507 Neutrophil% 82.3 ± 14.2 84.0 ± 5.3 82.0 ± 15.1 .708 Lymphocyte 1.5 ± 1.0 1.5 ± 0.9 1.5 ± 1.0 .929 Lymphocyte% 10.3 ± 10.7 9.1 ± 4.8 10.5 ± 11.4 .729 BAL TLC 1215.8 ± 2251.9 608.4 ± 797.7 1309.3 ± 2390.1 .417 BAL Neutrophil 1052.0 ± 2053.5 544.8 ± 724.7 1130.1 ± 2181.7 .458 BAL Neutrophil% 70.5 ± 29.6 77.5 ± 31.4 69.4 ± 29.5 .479 BAL Lymphocyte 146.1 ± 218.4 62.1 ± 74.1 159.0 ± 230.6 .246 BAL Lymphocyte% 19.4 ± 20.3 9.4 ± 4.4 21.0 ± 21.3 .001 BAL Macrophage 36.5 ± 55.7 3.5 ± 1.0 44.7 ± 59.7 .015 BAL Macrophage% 4.1 ± 3.2 1.3 ± 0.5 4.8 ± 3.2 .001 CRP 208.8 ± 116.7 270.4 ± 185.5 199.3 ± 101.7 .322 CPIS 6.2 ± 1.4 6.1 ± 2.0 6.2 ± 1.4 .877 PSI 133.2 ± 28.9 132.1 ± 27.4 133.4 ± 29.4 .911 APACHE II 18.4 ± 7.4 15.6 ± 11.4 18.8 ± 6.6 .256 PIRO 1.3 ± 1.1 0.5 ± 0.5 1.5 ± 1.1 .022 IBMP-10 2.2 ± 1.1 1.5 ± 0.5 2.3 ± 1.1 .054Patients were categorized according to weaning off mechanical ventilation into 2 group, (those who succeeded MV weaning and those who failed MV weaning). Comparisons between both groups were tabulated in Table 2. Both groups had no significant differences, except for BAL cellular analysis. Bronchoscopic fluid analysis showed higher TLC, neutrophils, lymphocytes, and macrophages in those who failed mechanical ventilation.
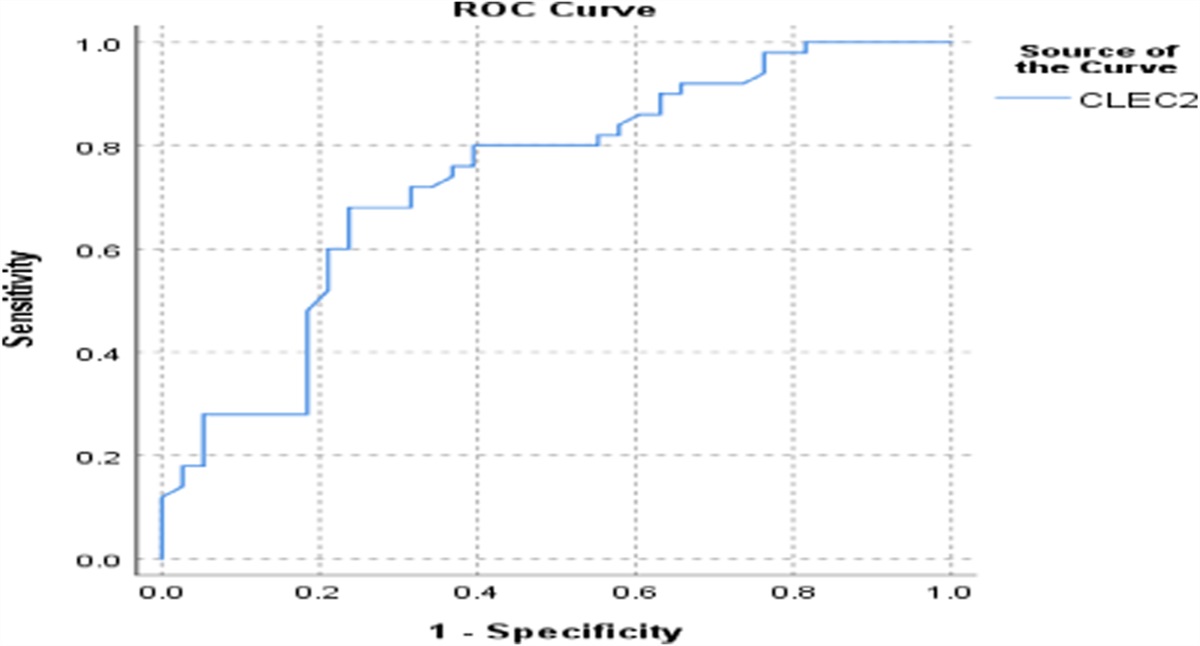
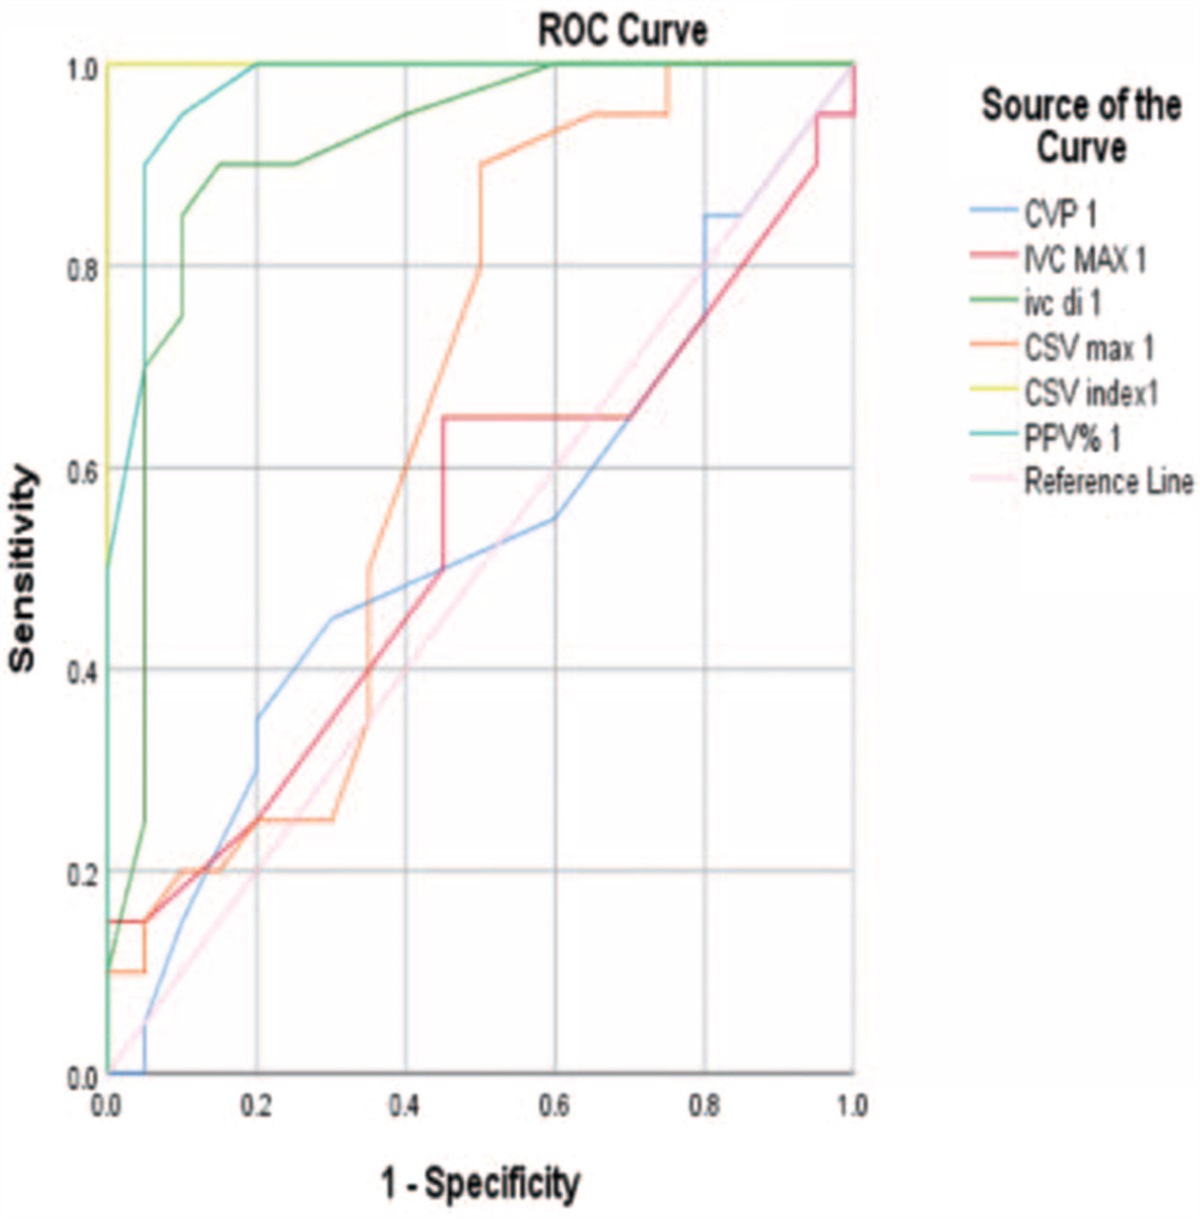
Table 2 - Characteristics of demographic data, BALF cytology and clinical scores in patients who were weaned successfully versus those who failed weaning MV weaning Successful weaning Failed weaning P Age 53.0 ± 17.2 60.5 ± 17.5 .867 Gender (Male) 4 (57.1%) 27 (50.9%) .538 Smoking 31 (58.5%) 4 (57.1%) .836 Diabetic 24 (45.3%) 1 (14.3%) .975 Hypertensive 27 (50.9%) 3 (42.9%) .893 IHD 28 (52.8%) 3 (42.9%) 1.000 CVS 15 (28.3%) 3 (42.9%) .950 Renal 2 (3.8%) 1 (14.3%) .893 PH 7.39 ± 0.06 7.34 ± 0.08 .032 PO2 55.5 ± 11.9 51.0 ± 12.1 .209 PCO2 46.2 ± 13.0 52.4 ± 15.4 .143 HCO3 26.0 ± 3.6 25.8 ± 3.6 .813 HR 122.3 ± 14.9 111.7 ± 11.1 .006 MAP 101.6 ± 17.7 86.5 ± 15.8 .003 MV stay 17.9 ± 9.9 18.9 ± 14.9 .865 ICU stay 22.0 ± 10.4 23.3 ± 12.1 .768 TLC 13.9 ± 3.8 17.2 ± 8.1 .150 Neutrophil 12.0 ± 3.8 14.1 ± 7.1 .254 Neutrophil% 84 ± 6% 82 ± 15% .415 Lymphocyte 1.1 ± 0.6 1.5 ± 1.0 .480 Lymphocyte% 9 ± 5% 11 ± 11% .748 BAL TLC 207.1 ± 129.8 1349.0 ± 2365.7 .037 BAL Neutrophil 169.0 ± 113.4 1168.7 ± 2159.7 .039 BAL Neutrophil% 69 ± 32% 71 ± 30% .757 BAL Lymphocyte 32.3 ± 19.9 161.1 ± 228.3 .027 BAL Lymphocyte% 14 ± 8% 20 ± 21% .078 BAL Macrophage 7.0 ± 6.0 49.1 ± 62.9 .027 BAL Macrophage% 3 ± 3% 4 ± 3% .527 CRP 236.0 ± 151.8 205.2 ± 112.6 .791 CPIS 5.6 ± 1.7 6.3 ± 1.4 .832 PSI 129.6 ± 29.4 133.7 ± 29.1 .707 APACHE II 12.0 ± 8.2 19.2 ± 6.9 .362 PIRO 0.7 ± 1.0 1.4 ± 1.1 .716 IBMP-10 1.6 ± 0.5 2.3 ± 1.1 .188Receiver operating curves were plotted for predicting mortality and weaning from mechanical ventilation. Analysis was performed for BAL neutrophils, lymphocytes. Blood cellular analysis provided modest cut-offs. These results were presented in Table 3 for predicting mortality and Table 4 for predicting MV weaning. Receiver Operating Curve (ROC) was plotted for predicting MV weaning in Figure 1.
Table 3 - ROC analysis for Mortality against BALF neutrophils and lymphocytes AUC Cut off Sensitivity (%) Specificity (%) BAL TLC 0.552 200/cc 61.5 50.0 BAL Neutrophil count 0.510 170/cc 57.7 50.0 BAL Lymphocyte count 0.603 45/cc 55.8 50.0 Figure 1:
 Receiver operating curve for mechanical ventilation prediction using BAL cellular analysis. Total leucocytic count (TLC) was plotted in solid line. Neutrophil count represented by stripped line. Lymphocytes were represented by dotted line.
Patients were categorized according to ROC findings into 2 groups according to their BAL neutrophil counts into group (1) those with BAL neutrophil count < 170/cc and group (2) those with BAL neutrophil count ≥ 170/cc. Group (2) had worse MV weaning rates (Log Rank 0.038). This was plotted in Figure 2.
 Figure 2:
 Kaplan Meier analysis. Weaning from mechanical ventilation was outcome of interest. Patients were categorized into 2 groups according to their BAL neutrophil counts into group (1) solid line that represented those with BAL neutrophil count < 170/cc and group (2) stripped line that represented those with BAL neutrophil count ≥ 170/cc, (Log Rank 0.038).
DiscussionIn our study, we examined alveolar infiltrates using bronchoalveolar lavage cellular analysis in VAP patients. Our work probed the prognostic ability of cellular analysis of BAL fluid to predict mortality and weaning failure. As far as our knowledge, there is no similar study that discussed mortality or weaning outcome in VAP patients, using BAL cellular analysis.
Our study exhibited a higher mortality rate in VAP patients who failed weaning from mechanical ventilation. Othman et al. investigated prevalence and complications of VAP. He stated that sepsis/septic shock, ARDS, atelectasis, and infection with MDR organisms were significantly higher in the VAP group.4
It is well-known that extubation failure increases odds of mortality in ICU, as demonstrated by previous studies. Thille et al. studied outcomes of extubation failure and concluded that failed planned or unplanned extubation was followed by marked clinical deterioration.5 Frutos-Vivar et al. reported similar findings.6
According to our data, ICU mortality in VAP patients was 86.7%. Other studies reported different mortality rates. Pugin et al. mentioned that the mortality among the population of VAP group was 54%, while Furtadom et al. stated that the overall mortality reached 25%.7,8 It was clear that we had higher than highest-reported mortality rate, this might be related to different baseline patient characteristics, worse clinical severity, different management protocols, or multiple comorbidities.
Our study showed that neither age nor gender influenced mortality outcome in VAP patients. Other authors supported this notion, Mirsaeidi et al. examined mortality in VAP patients and mentioned that neither age nor gender, had an impact on mortality in VAP patients.9 Zhou et al. and Furtado et al. confirmed same findings.8,10 However, contradictory data was presented by Lisboa et al. where he noted that old age showed worse prognosis.11 In our study, 52% of the population of the study were males with no significant difference between both genders regarding mortality. This was also echoed in other studies.8–10 Our study showed that neither age nor gender had a significant impact on MV weaning outcome in VAP patients. There was conflicting data, regarding age, on incidence of VAP. Surprisingly, male gender was considered an independent risk factor for VAP as supported by many authors.11–14
In our study, Clinical Pulmonary Infection Score, Pneumonia Severity Index and APACHE II did not have a statistically significant relation with mortality. Pneumonia severity index was derived and validated as part of the Pneumonia Patient Outcomes Research Team (PORT) prospective cohort study for the purpose of identifying patients with CAP at low risk for mortality. Several studies used CPIS and PSI to assess prognosis in non-CAP pneumonia.15,16 Other studies suggested that APACHE II score should be determined at the time of VAP diagnosis not ICU admission.8,17
While the PIRO score and IBMP-10 score had a statistically significant relation with mortality (P = .019 and 0.033, respectively). PIRO score had specificity of 100% and 50% sensitivity, while IBMP-10 had sensitivity of 84.6% and specificity of 50%. In a prospective observational cohort study including 441 patients with VAP in three multidisciplinary ICUs. Lisboa et al. concluded that high PIRO score for VAP was associated with higher mortality and medical resource use.15 Rosolem et al. concluded that it could be used to assess severity and health-care resources utilization and to improve prediction of ICU mortality in VAP patients.19 Mirsaeidi et al. and Abbasi et al. stated that the IBMP-10, was comparable to the APACHE II score in its ability to predict mortality in patients with VAP. They concluded that IBMP-10, compared to APACHE II, had greater sensitivity and specificity to predict mortality in patients with ventilator-associated pneumonia.9,20
In our study, blood markers of inflammation, including total and differential white cell count did not offer prognostic information, regarding mortality or liberation from mechanical ventilation. This was also documented by Kronberger et al.21 Previous works evaluated BALF analysis in different lung diseases and suggested using BALF cellular analysis in diagnosing VAP.22–27 A study conducted by Balthazar et al. showed that relative neutrophilic count increased in VAP patients.22 This was also demonstrated by Stolz et al. and Marquette et al.25,28 However, Papazian et al. found no differences in neutrophil numbers between VAP and non-VAP groups.29 The predictive role of BAL fluid cellular composition in the etiology of pneumonia in critically ill patients was examined and reported that both bacterial and viral pneumonia were associated with BAL fluid neutrophilia (significantly higher in the bacterial pneumonia).22 several studies speculated that neutrophilic infiltration of alveolar spaces associated VAP pathogenesis. Wilkinson et al. and Mikacenic et al. showed that neutrophil proteases and neutrophil extracellular traps were significantly elevated in VAP patients.30,31
Our study showed that neither total leucocytic count nor absolute neutrophil count in bronchoalveolar lavage fluid had a statistically significant relation with mortality. However, our findings suggested prognostic information, regarding weaning off mechanical ventilation. Increased absolute BAL neutrophilic and lymphocytic counts had a negative impact on MV weaning. Bronchoscopic fluid analysis showed higher TLC, neutrophils, lymphocytes, and macrophages in those who failed mechanical ventilation. Cellular analysis could reveal local but not global inflammatory responses. These responses carried worse prognosis, regarding namely weaning from mechanical ventilation.
Presence of macrophages in BALF had a statistically significant relation with mortality and MV weaning. In an explanation to this finding, Hall et al. stated that intubation and mechanical ventilation alter first-line patient defenses. Disruption of first line defenses activates alveolar macrophages and causes neutrophils to infiltrate and damage the lungs.32
ConclusionBronchial lavage cellular fluid analysis could bear prognostic information in ventilator associated pneumonia. Increased bronchoalveolar lavage neutrophils and lymphocytes showed increased rates of mortality and weaning failure in ventilator associated pneumonia.
Uncited reference18.
References [1]. Khalil AC, Metersky ML, Klompas M, et al. Management of adults with hospital-acquired and ventilator-associated Pneumonia: 2016 Clinical Practice Guidelines by the Infectious Diseases Society of America and the American Thoracic Society. Clin Infect Dis 2016;63:e61. [2]. Harbeck RJ. Immunophenotyping of bronchoalveolar lavage lymphocytes. Clin Diagn Lab Immunol 1998;5(3):271–277. [3]. Buderer NM. Statistical methodology: I incorporating the prevalence of disease into the sample size calculation for sensitivity and specificity. Acad Emerg Med 1996;3:895–900. [4]. Abdelrazik Othman A, Salah Abdelazim M. Ventilator-associated pneumonia in adult intensive care unit prevalence and complications. Egypt J Crit Care Med 2017;doi: 10.1016/j.ejccm.2017.06.001. [5]. Thille AW, Harrois A, Schortgen F, et al. Outcomes of extubation failure in medical intensive care unit patients. Crit Care Med 2011;39(12):2612–2618. [6]. Frutos-Vivar F, Ferguson ND, Esteban A, et al. Risk factors for extubation failure in patients following a successful spontaneous breathing trial. Chest 2006;130(6):1664–1671. [7]. Pugin J, Auckenthaler R, Mili N, et al. Diagnosis of ventilator-associated pneumonia by bacteriologic analysis of bronchoscopic and nonbronchoscopic “blind” bronchoalveolar lavage fluid. Am Rev Respir Dis 1991;143(5 I):1121–1129. doi:10.1164/ajrccm/143.5_pt_1.1121. [8]. Furtado GH, Wiskirchen DE, Kuti JL, et al. Performance of the PIRO score for predicting mortality in patients with ventilator-associated pneumonia. Anaesth Intensive Care 2012;40(2):285–291. doi:10.1177/0310057x1204000211. [9]. Mirsaeidi M, Peyrani P, Ramirez JA. Predicting mortality in patients with ventilator-associated pneumonia: the APACHE II score versus the new IBMP-10 score. Clin Infect Dis 2009;49(1):72–77. doi:10.1086/599349. [10]. Zhou XY, Ben SQ, Chen HL, et al. A comparison of APACHE II and CPIS scores for the prediction of 30-day mortality in patients with ventilator-associated pneumonia. Int J Infect Dis 2015;30:e144–e147. doi:10.1016/j.ijid.2014.11.005. [11]. Bornstain C, Azoulay E, De Lassence A, et al. Outcomerea Study Group. Sedation, sucralfate, and antibiotic use are potential means for protection against early-onset ventilator-associated pneumonia. Clin Infect Dis 2004;38(10):1401–1408. [12]. Forel JM, Voillet F, Pulina D, et al. Ventilator-associated pneumonia and ICU mortality in severe ARDS patients ventilated according to a lung-protective strategy. Crit Care 2012;16(2):R65. [13]. Tejerina E, Frutos-Vivar F, Restrepo MI, et al. Incidence, risk factors, and outcome of ventilator-associated pneumonia. J Crit Care 2006;21(1):56–65. [14]. Lisboa T, Diaz E, Sa-Borges M, et al. The ventilator-associated pneumonia PIRO score: a tool for predicting ICU mortality and health-care resources use in ventilator-associated pneumonia. Chest 2008;134(6):1208–1216. doi:10.1378/chest.08-1106. [15]. Sharpe JP, Magnotti LJ, Weinberg JA, et al. Gender disparity in ventilator-associated pneumonia following trauma: identifying risk factors formortality. J Trauma Acute Care Surg 2014;77(1):161–165. [16]. Carrabba M, Zarantonello M, Bonara P, et al. Severity assessment of healthcare-associated pneumonia and pneumonia in immunosuppression. Eur Respir J 2012;40(5):1201–1210. doi:10.1183/09031936.00187811. [17]. Gaber S, Tayeh O, Wahab KA, et al. Early detection of ventilator-associated pneumonia: bedside tools. Egyptian J Crit Care Med 2020;7(2 and 3):74–79. doi: 10.1097/EJ9.0000000000000015. [18]. Gursel G, Demirtas S. Value of APACHE II, SOFA and CPIS scores in predicting prognosis in patients with ventilator-associated pneumonia. Respiration 2006;73(4):503–508. doi:10.1159/000088708. [19]. Rosolem M, de M, Rabello LSCF, Leal JV, et al. Entendendo o conceito PIRO: da teoria à prática clínica—parte 2. Rev Bras Ter Intensiva 2010;22(1):64–68. doi:10.1590/s0103-507x2010000100011. [20]. Abbasi S, Haghighipour S, Naeini A, et al. Comparing the APACHE II score and IBM-10 score for predicting mortality in patients with ventilator-associated pneumonia. Adv Biomed Res 2015;4(1):47. doi:10.4103/2277-9175.151419. [21]. Kronberger JF, Köhler TC, Lang CN, et al. Bronchoalveolar lavage and blood markers of infection in critically ill patients: a single center registry study. J Clin Med 2021;10(3):486. Published 2021 Jan 29. doi:10.3390/jcm10030486. [22]. Balthazar AB, Von Nowakonski A, De Capitani EM, et al. Diagnostic investigation of ventilator-associated pneumonia using bronchoalveolar lavage: comparative study with a postmortem lung biopsy. Braz J Med Biol Res 2001;34(8):993–1001. doi:10.1590/s0100-879x2001000800004. [23]. Choi SH, Hong SB, Hong HL, et al. Usefulness of cellular analysis of bronchoalveolar lavage fluid for predicting the etiology of pneumonia in critically ill patients. PLoS One 2014;9(5):e97346. doi:10.1371/journal.pone.0097346. [24]. Huh JW, Lim CM, Koh Y, et al. Diagnostic utility of the soluble triggering receptor expressed on myeloid cells-1 in bronchoalveolar lavage fluid from patients with bilateral lung infiltrates. Crit Care 2008;12(1):R6. doi:10.1186/cc6770. [25]. Stolz D, Stulz A, Müller B, et al. BAL neutrophils, serum procalcitonin, and C-reactive protein to predict bacterial infection in the immunocompromised host. Chest 2007;132(2):504–514. doi:10.1378/chest.07-0175. [26]. Bradley B, Branley HM, Egan JJ, et al. British Thoracic Society Interstitial Lung Disease Guideline Group British Thoracic Society Standards of Care Committee, Thoracic Society of Australia, New Zealand Thoracic Society, Irish Thoracic Society. Interstitial lung disease guideline: the British Thoracic Society in collaboration with the Thoracic Society of Australia and New Zealand and the Irish Thoracic Society. Thorax 2008;63(Suppl V):v1–v58. doi:10.1136/thx.2008.101691. [27]. Meyer KC, Raghu G, Baughman RP, et al. An official American Thoracic Society clinical practice guideline: the clinical utility of bronchoalveolar lavage cellular analysis in interstitial lung disease. Am J Respir Crit Care Med 2012;185:1004–1014. doi:10.1164/rccm.201202-0320ST. [28]. Marquette CH, Copin MC, Wallet F, et al. Diagnostic tests for pneumonia in ventilated patients: prospective evaluation of diagnostic accuracy using histology as a diagnostic gold standard. Am J Respir Crit Care Med 1995;151(6):1878–1888. doi:10.1164/ajrccm.151.6.7767535. [29]. Papazian L, Autillo-Touati A, Thomas P, et al. Diagnosis of ventilator-associated pneumonia: an evaluation of direct examination and presence of intracellular organisms. Anesthesiology 1997;87(2):268–276. doi:10.1097/00000542-199708000-00013. [30]. Wilkinson TS, Conway Morris A, Kefala K, et al. Ventilator-associated pneumonia is characterized by excessive release of neutrophil proteases in the lung. Chest 2012;142(6):1425–1432. doi:10.1378/chest.11-3273. [31]. Mikacenic C, Moore R, Dmyterko V, et al. Neutrophil extracellular traps (NETs) are increased in the alveolar spaces of patients with ventilator-associated pneumonia. Crit Care 2018;22(1):358. Published 2018 Dec 27. doi:10.1186/s13054-018-2290-8. [32]. Hall NG, Liu Y, Hickman-Davis JM, et al. Bactericidal function of alveolar macrophages in mechanically ventilated rabbits. Am J Respir Cell Mol Biol 2006;34(6):719–726. doi:10.1165/rcmb.2005-0463OC.
留言 (0)