
記住我
Septic shock is defined as “a subset of sepsis in which underlying circulatory and cellular/metabolic abnormalities are profound enough to substantially cause increased mortality.” Septic shock patients can be diagnosed by a combination of sepsis with persisting hypotension requiring hemodynamic support to maintain mean arterial pressure (MAP) ≥ 65 mm Hg and serum lactate more than 2 mmol/L although adequate volume resuscitation. Hospital mortality is more than 40% in patients with septic shock.1
Resuscitation of septic shock implies fluid optimization, which aims at improvement of oxygen delivery.2 Assessment of fluid responsiveness in septic shock at an acute care setting is of great importance for bed side physicians. Both static and dynamic parameters are established with many controversies regarding their use.3–5 Although pulse pressure variation (PPV) and its surrogate appeared as reliable indicators to predict hemodynamic response to fluid challenge (FC) on many studies.6–9 Many updated data underlined misinterpretation conditions seen in most of acutely ill patients.10–14
Many invasive and less-invasive methods to measure cardiac output (CO) were established. These can be classified according to their level of invasiveness (invasive, non-invasive, or less invasive). There is a clinical trend to use non or less invasive techniques to reduce the risks that accompany more invasive techniques.
Trans-thoracic echocardiography (TTE) allows evaluation of hemodynamic response to fluid resuscitation by measuring percent change of aortic velocity time integral (%VTIAo) during a FC, as a surrogate of left ventricle stroke volume (SV) variation.15–17 TTE is often used as a gold standard reference for the validation of recent CO measuring techniques.18 However, TTE is not accurate in some cases of bad thoracic insonation and it is also operator dependent.
The Doppler of femoral artery indices is a simple, easily performed and bypasses this common limit of bad thoracic insonation among intensive care patients. The aim of this study was to evaluate the use of femoral artery blood flow Doppler as an alternative to TTE in assessment of cardiac response to FC in critically ill patients with septic shock.
2 Patients and methodsAn informed consent was taken from the next of kin to include data in this study. This prospective observational study was carried out on 50 patients who were admitted to an adult's multi-disciplinary ICU in the Critical Care Medicine department, Cairo university hospitals.
2.1 Inclusion and exclusion criteriaAll adult critically ill patients with septic shock who were recommended to receive FC were assessed for enrollment in this study. Patients with septic shock can be clinically identified by a vasopressor requirement to maintain a MAP of 65 mm Hg or greater and serum lactate level greater than 2 mmol/L (>18 mg/dL) in the absence of hypovolemia according to latest definition of sepsis and septic shock.1
All pregnant females were excluded. Also, all patients with arrhythmia, right sided heart failure, aortic valve disease, peripheral arterial disease and poor transthoracic echogenicity were excluded.
2.2 MethodologyAll enrolled patients were subjected to complete history taking, physical examination, routine laboratory investigations and complete sepsis workup. Then, initial hemodynamic evaluation (before FC, T0) was done using the following parameters; Systolic Arterial Pressure (SAP), Diastolic Arterial Pressure (DAP), MAP, Pulse Pressure (PP), and Heart Rate (HR). Echocardiography (T0) was performed by an experienced physician. The following parameters were measured: stroke volume (SV), VTIAo over left ventricular outflow tract (LVOT) and Left ventricular ejection fraction (LVEF) was estimated using modified Simpsons method. Then, Femoral Doppler (T0) was performed by the same operator to measure the following parameters: maximum velocity and velocity time integral (VFmax and VTIF) over the common femoral artery. A Vivid 3 ultra-sound machine with a 4-MHz curved array multifrequency transducer was used (GE Healthcare, USA)
FC was performed by rapid volume infusion (30 minutes) of 500 mL 0.9% sodium chloride solution. After FC (T1), all hemodynamic, echocardiographic and femoral Doppler parameters were repeated. Relative changes in VTIF and VFmax of femoral flow, VTIAo, and CO using echocardiography were expressed in percentages as follows: Changes (%) = 100 × (T1 value − T0 value)/T0 value. Responders (R) were defined by an increase of 15% or more of %VTIAo. The 15% cut off level was taken before the start of the study as being double of the intraobserver variability of the VTIAo, quantified by TTE in previous reports.17,19
2.3 Primary and secondary outcomes Primary outcome was the accuracy of femoral artery flow indices (%VTIF and %VFmax) in discriminating responder and non-responder patients after FC. Secondary outcomes were the ICU length of stay and 28-days mortality. 2.4 Statistical analysisData were collected and coded prior to analysis using the professional statistical Package for Social Science (SPSS 21). Quantitative data were expressed as mean and standard deviation (SD). Qualitative data were expressed as percentages. Student t-test and Mann Whitney test were used for comparing data. Chi-square test was used for all categorical data to test for the presence of an association. Spearman correlation coefficient was used for correlation of femoral doppler parameters and %VTIAo. Sensitivity and specificity of femoral doppler parameters in classifying responder and non-responder patients were calculated. P value <0.05 was considered significant (Figs. 1–3).
 Figure 1:
 Study flow chart for included patients.
 Figure 2:
 Correlation between %VTIAo and femoral Doppler parameters (right one with %VFmax and left one with %VTIF).
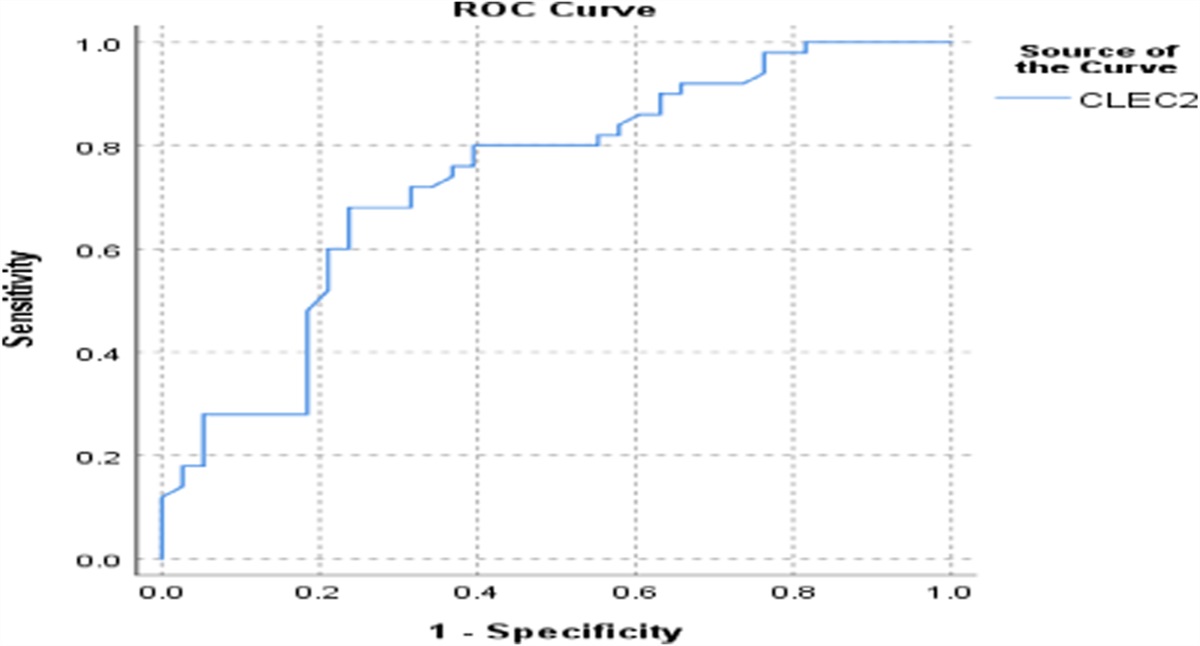
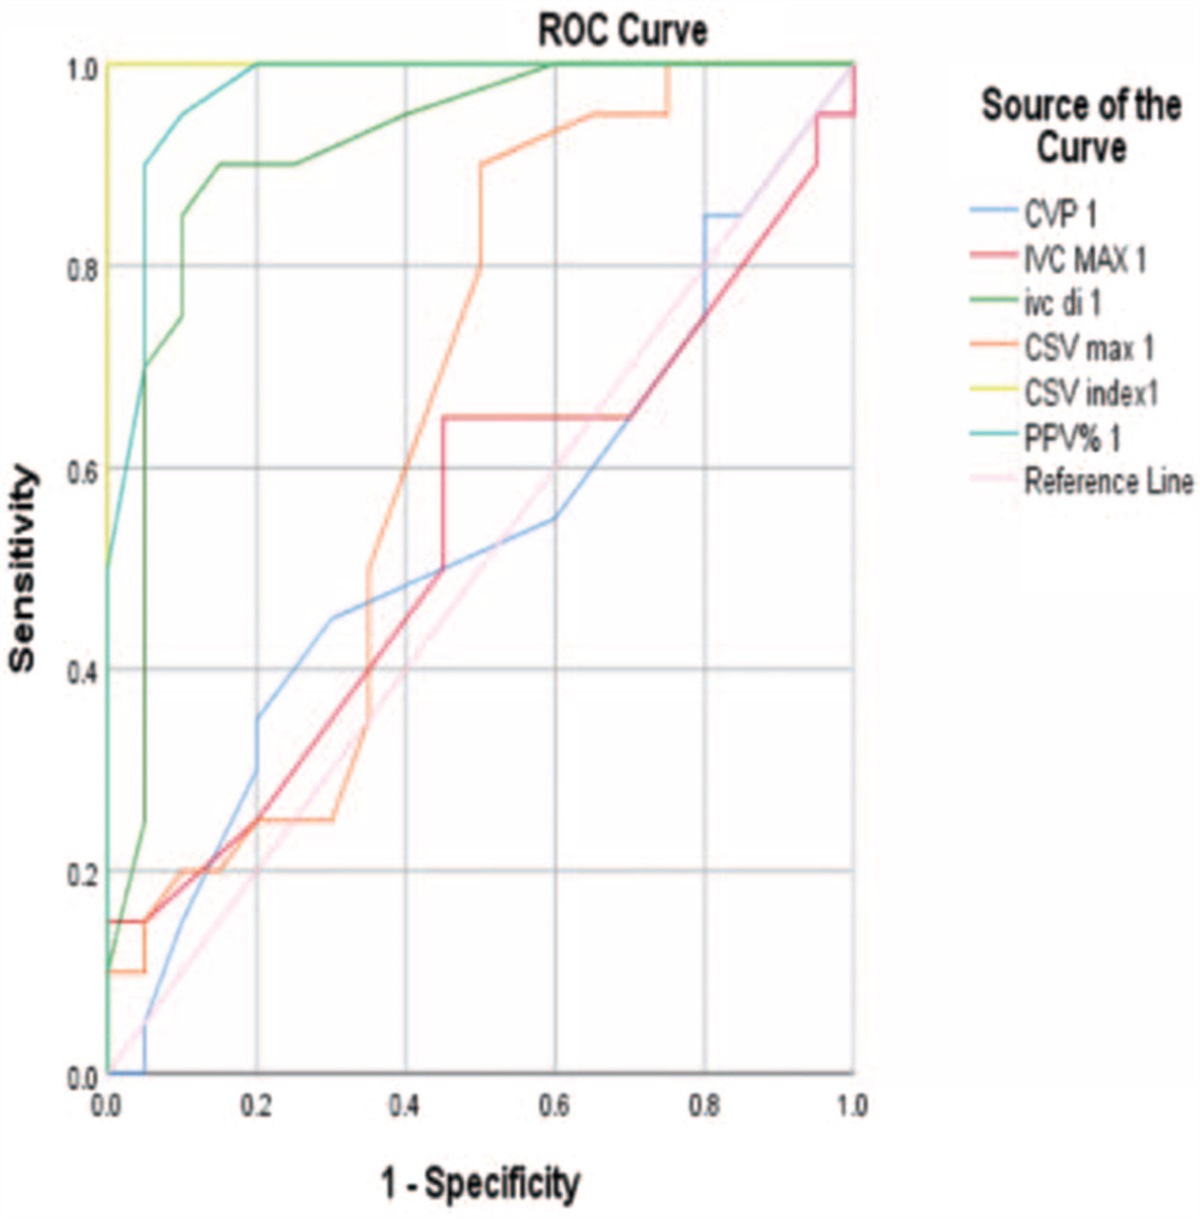
 Figure 3:
 ROC curve for femoral Doppler parameters to predict fluid responders. ROC, receiver operating characteristics.
3 ResultsThis prospective observational study was conducted on 50 adult septic shock patients of both sexes. After the FC and the echocardiographic assessment of all enrolled patients, they were classified into two groups. Thrity patients were fluid responders “R group” and another 20 patients were fluid non-responders “NR group”.
3.1 Descriptive data of study groupsPatients characteristics and clinical data were comparable between responder and non-responder groups. TTE parameters were also comparable between the two groups which include LVEF, CO, SV and VTIAo pre and post FC measurements. As determined, %VTIAo was taken to differentiate between R and NR and it was 34.34 ± 9.16 and 7.47 ± 2.15, respectively (Table 1).
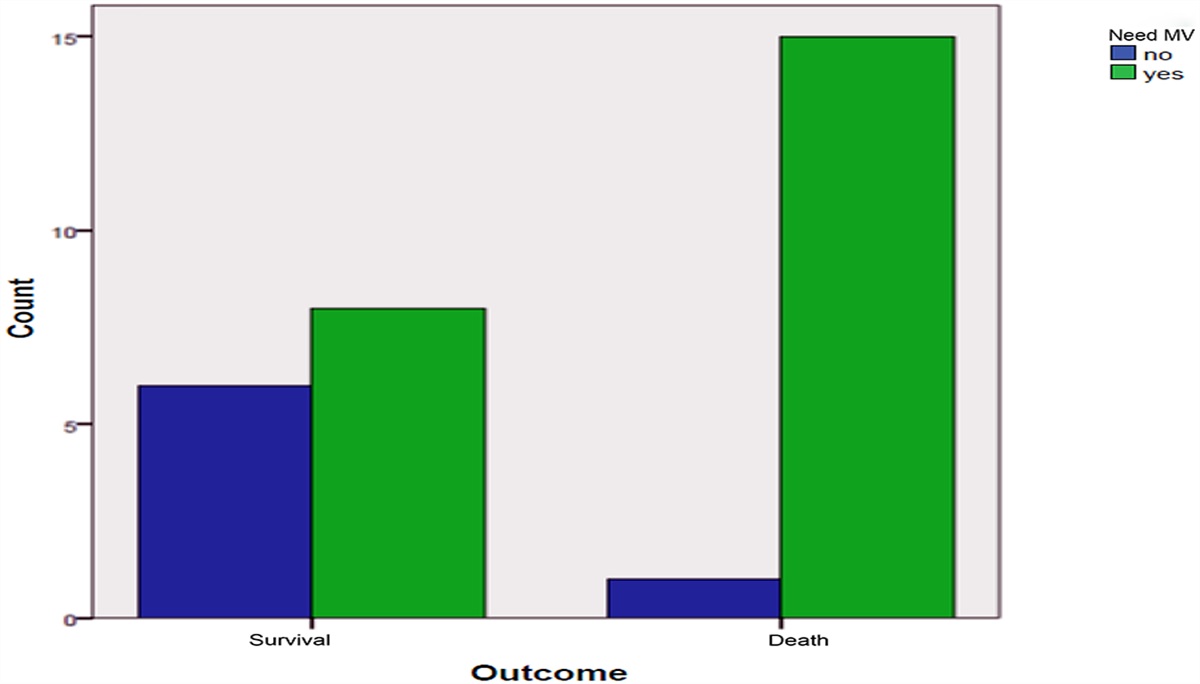
Table 1 - Comparison between the two studied groups according to demographic, clinical and TTE data. Total (n = 50) R group (n = 30) NR group (n = 20) P value Gender Males 22 (44%) 13 (43,3%) 9 (45%) 1.000 Females 28 (56%) 17 (56.7) 11 (55%) Age (years) 66.18 ± 13.78 67.57 ± 10.74 64.10 ± 17.51 .389 Vasopressor support Norepinephrine 37 (74%) 23 (76.6%) 14 (70%) .744 Dopamine 22 (44%) 11 (36.6) 11 (55%) .522 MV .387 Yes 25 (50%) 17 (56.7%) 8 (40%) No 25 (50%) 13 (43.3%) 12 (60%) APACHE II 24.90 ± 5.01 25.60 ± 5.10 24.05 ± 4.21 .332 SOFA 11.29 ± 2.95 11.20 ± 2.88 11.39 ± 2.97 1.001 WBCs (×103 cells/μL) 21.45 ± 8.34 21.16 ± 8.77 21.89 ± 7.84 .767 PCT (ng/mL) 27.04 ± 33.49 30.23 ± 37.40 22.27 ± 26.79 .992 CRP (mg/L) 178.69 ± 82.30 175.99 ± 93.72 182.74 ± 63.51 .920 Hemodynamic parameters HR T0 (beats/min) 106.58 ± 17.46 108.37 ± 18.096 103.90 ± 16.559 .410 HR T1 (beats/min) 100.16 ± 16.77 101.83 ± 17.788 97.65 ± 15.229 .336 MAP T0 (mm Hg) 65.56 ± 10.979 62.27 ± 8.847 70.50 ± 12.189 .220 MAP T1 (mm Hg) 74.62 ± 10.124 72.13 ± 8.386 78.35 ± 11.513 .790 PP T0 (mm Hg) 36.60 ± 9.607 36.00 ± 7.701 37.50 ± 12.085 .841 PP T1 (mm Hg) 42.20 ± 7.365 47.00 ± 7.944 41.00 ± 6.407 .030 Trans-thoracic echocardiography parameters LVEF .763 30–49% 17 (34%) 11 (36.6%) 6 (30%) ≥50% 33 (66%) 19 (63.3%) 14 (70%) CO T 0 (L/m) 7.45 ± 2.61 7.55 ± 2.82 7.31 ± 2.33 .759 CO T 1 (L/m) 7.99 ± 2.71 8.35 ± 3.00 7.44 ± 2.15 .252 SV T 0 (mL) 69.55 ± 19.69 68.89 ± 20.15 70.56 ± 19.46 .773 SV T 1 (mL) 79.46 ± 22.09 81.27 ± 22.97 76.74 ± 20.97 .483 VTIAo T 0 (cm) 27.58 ± 9.169 26.30 ± 4.75 29.49 ± 13.26 .205 VTIAo T 1 (cm) 33.68 ± 9.914 33.78 ± 5.90 33.54 ± 14.15 .337 %VTIAo (%) 23.53 ± 15.06 34.34 ± 9.16 7.47 ± 2.15 .001%VTIAo, percent change of aortic velocity time integral; CO, cardiac output; CRP, C-reactive protein; LVEF, left ventricular ejection fraction; MAP, mean arterial pressure; MV, mechanical ventilation; PCT, procalcitonin; PP, pulse pressure; SV, stroke volume; T0, before fluid challenge; T1, after FC.
VTIF and VFmax as shown in Table 2 were comparable between responder and non-responder at baseline and after FC. Only percentage change of both readings was significantly different between the two groups.
Table 2 - Comparison between the two studied groups according to femoral Doppler parameters Total (n = 50) R group (n = 30) NR group (n = 20) P value VFmax T 0 (cm/s) 19.44 ± 4.52 19.18 ± 4.02 19.84 ± 5.28 .616 VFmax T 1 (cm/s) 25.35 ± 6.43 25.72 ± 5.56 24.80 ± 7.68 .628 %VFmax (%) 22.97 ± 21.58 35.12 ± 20.10 4.74 ± 1.43 .008 VTIF T 0 (cm) 8.11 ± 2.93 7.66 ± 2.81 8.79 ± 3.05 .182 VTIF T 1 (cm) 10.59 ± 3.65 10.67 ± 3.83 10.46 ± 3.45 .843 %VTIF (%) 31.34 ± 36.44 45.90 ± 40.62 9.49 ± 8.26 <.0001%VFmax, pecent change of maximal femoral velocity; %VTIF, percent change of femoral velocity time integral; R, fluid responders; NR, non-responders; T0, reading before FC; T1, reading after FC.
%VFmax showed a fair positive correlation with %VTIAo with Spearman coefficient of 0.543 and it was statistically significant (P = <.001). While, %VTIF showed a good positive correlation with %VTIAo with Spearman coefficient of 0.733 and it was statistically significant (P = <.001).
3.4 Receiver operating characteristics (ROC) curve for %VFmax and %VTIF to predict fluid responsivenessAfter plotting the receiver operating characteristics (ROC) curve for both %VFmax and %VTIF to predict the fluid responders, Table 3 shows the agreement (sensitivity, specificity) data for femoral Doppler parameters to predict fluid responders. %VTIF was a good predictor to predict the fluid responders with area under the ROC curve (AUC) of 0.817 at a cut off value of 10% (95% CI, 0.699–0.934, P < .0001). It showed sensitivity and specificity of 60% and 95% respectively. Positive predictive value (PPV) was 94.7% and negative predictive value (NPV) was 61.3%.
Table 3 - Agreement (sensitivity, specificity) for femoral Doppler parameters to predict fluid responders 95% CI AUC P value LL UL Cut off Sensitivity Specificity PPV NPV %VFmax 0.958∗ <.0001∗ 0.891 1.000 7% 80.0 70.0 80.0 70.0 %VTIF 0.817∗ <.0001∗ 0.699 0.934 10% 60.0 95.0 94.7 61.3%VFmax, percent change of maximal femoral velocity; %VTIF, percent change of femoral velocity time integral; AUC, area under a curve; CI, confidence intervals; NPV, negative predictive value; PPV, pulse pressure variation.
While %VFmax was an excellent predictor to predict the fluid responders with AUC of 0.958 at a cut off value of 7% (95% CI; 0.891–1.000, P < .0001). It showed sensitivity and specificity of 80% and 70% respectively. PPV was 80% and NPV was 70%.
3.5 Secondary outcome for fluid responsiveness Fifty six percent of patients in this study died within 28 days from enrollment and only 44% survived. There was no statistically significant difference between the two groups in their mortality rates. The ICU-LOS in days was ranged from 1 to 22 days with a mean of 6.26 ± 4.619. The mean of ICU-LOS was significantly higher in NR group (7.40 ± 5.424) than in R group (4.55 ± 2.235) (P = .031). 4 DiscussionAdequate fluid resuscitation and assessment is one of the corner stones in the management of septic shock. Since septic shock is usually associated with absolute or relative hypovolemia. The aims are being to preserve intravascular fluid volume and restore effective tissue perfusion which improve tissue oxygenation.20 Also maintaining endothelial integrity and detection of its dysfunction is of paramount importance in sepsis treatment for adequate tissue perfusion.21
After literature review, few studies evaluated the variations in these two femoral Doppler parameters in critically ill patients to detect the response to FC. In this study, 50 critically ill patients with septic shock completed the study. Results showed that femoral Doppler parameters variation (%VFmax and %VTIF) after FC differentiate between volume responder and non-responder patients with acceptable accuracy.
Aymeric Luzi et al. conducted the earliest study to assess the femoral Doppler indices (%VTIF or %VFmax) for detecting a hemodynamic response to a rapid fluid infusion in critically ill intubated patients with hemodynamic instability. They prospectively enrolled 52 critically ill mechanically ventilated patients then, %VTIF and VFmax obtained from femoral Doppler analysis and %VTIAo registered on TTE before and after a FC of 500-mL normal saline.22
Results of our study showed no statistically significant differences between the two groups in their VFmax at T0 (P = .616) or T1 (P = .628). Also, no statistically significant differences between the two groups in their VTIF at T0 (P = .182) or T1 (P = .843). Then, these values were not correlated to VTIAo values at T0 or T1. These findings were similar to Aymeric Luzi et al. study where the absolute values of both VFmax and VTIF are not correlated to VTIAo values neither before nor after FC.22
In another study (El Zahaby et al.), which compared femoral arterial doppler (VITF) and VTI over LV outflow tract in 30 septic patients, found that femoral doppler parameters (VITF) and VTIA incresed significantly in responders but not in non-responder after FC (30 mL/kg). The methodology and statistical analysis were quite different from our study. First, FC was different in our study (only 500 mL) which is much less in amount. Second, they compared the readings of VTIF and VTI LV out flow within the groups and not between the two groups and percent change of both readings was not calculated. So although that this study gave positive data for femoral doppler, it couldnot be compared for our study.23
The present study showed no statistically significant differences between the two groups in their CO at T0 (P = .759) or T1 (P = .252). Aymeric Luzi and his colleagues also found that no correlation detected between measures of VTIAo and VTIF or VFmax, which mean that, at any time, a femoral Doppler parameters are not suitable to comment on CO state. Results showed that the measured echocardiographic parameter %VTIAo was considered as a reference standard. The choice of TTE as a reference is also debatable regarding to thermodilution techniques. However, echocardiographic use is widely accepted as an assessing technique of the left ventricle response to an FC in bedside clinical rounds.15–18
In this study, the mean of measured values of %VFmax was significantly higher in R group (35.12 ± 20.10) than in NR group (4.74 ± 1.43) (P = .008). The mean of measured values of %VTIF was also significantly higher in R group (45.90 ± 40.62) than in NR group (9.49 ± 8.26) (P < .0001). These findings were similar to Aymeric Luzi et al. study. The mean of measured values of %VFmax was significantly higher in R group (11.0 ± 3.4) than in NR group (5.9 ± 4.3) (P = .0001). The mean of measured values of %VTIF was significantly higher in R group (14.9 ± 4.2) than in NR group (5.5 ± 5.5) (P < .0001).22
Resuls of this study showed that %VTIF and %VFmax derived from femoral arterial Doppler showed a positive correlations with %VTIAo with a spearman coefficient of 0.733 and 0.543 respectively. In Aymeric Luzi et al. study, there was a positive correlation between %VFmax or %VTIF and %VTIAo during FC. %VTIAo were significantly correlated, with a r2 at 0.46 and 0.51 for %VFmax and %VTIF (P < .0001).22
In this study, %VTIF cutoff value of 10% was a good predictor to predict the fluid responders with (AUC = 0.817) (95% CI, 0.699–0.934, P < .0001). But, %VFmax cutoff value for increase of 7% was an excellent predictor (AUC = .958) (95% CI; 0.891–1.000, P < .0001). %VFmax was more sensitive (80%) and %VTIF was more specific (95%). %VTIF showed a PPV of 94.7% and NPV of 61.3%. %VFmax showed a PPV of 80% and NPV of 70%. In Aymeric Luzi et al. study, ROC curves AUC was 0.91 (95% CI, 0.83–0.9) for %VTIF and 0.85 (95% CI, 0.75–0.95) for %VFmax. The most accurate cutoff value to differentiate R and NR was a 10% %VTIF increase and a 7% %VFmax increase. At these cut-off levels, sensitivity was 80%, specificity 85%, PPV 84%, NPV 81% for %VTIF and sensitivity 84%, specificity was 73%, PPV was 74%, and NPV was 86% for %VFmax.22
The effect of using fluid responsiveness on secondary outcome was also evluated as ICU stay and 28 day mortality. For mortality, there is no difference between R and NR groups which may be explained by low number of study patients to affect mortality. While for ICU leghth of stay, it was significantly lower in R than NR groups which may reflect earlier optimization of hemodynamics and faster weaning from vasopressors support in R group.
5 ConclusionFemoral Doppler parameters is a good tool to assess hemodynamic response to FC in septic shock. The increase in VFmax over 7% and VTIF over 10% are accurate tool to distinguish fluid responders (R) from non-responders (NR) so, it could be taken as an alternative approach to TTE in monitoring fluid responsiveness. More studies should be conducted to consolidate these data in a wide scale population and regarding to arterial condition.
6 LimitationsThis study has some limitations, it is a single center, that involves a limited number of patients. The femoral Doppler requires skilled physicians and it is operator dependant. Also the integrity of arterial system from aorta to femoral artery was not assesed to conduct same changes from heart to femoral arteries after FC.
References [1]. Singer M, Deutschman CS, Seymour CW, et al. The third international consensus definitions for sepsis and septic shock (Sepsis-3). Jama 2016;315(8):801–810. [2]. Bion J, Jaeschke R, Thompson BT, Levy M, Dellinger RP. Surviving sepsis campaign: international guidelines for management of severe sepsis and septic shock: 2008. Intensive Care Med 2008;34(6):1163–1164. Available from: http://dx.doi.org/10.1007/s00134-008-1090-z. [3]. Osman D, Ridel C, Ray P, et al. Cardiac filling pressures are not appropriate to predict hemodynamic response to volume challenge. Crit Care Med 2007;35(1):64–68. Available from: http://dx.doi.org/10.1097/01.ccm.0000249851.94101.4f. [4]. Michard F, Teboul J-L. Predicting fluid responsiveness in ICU patients. Chest 2002;121(6):2000–2008. Available from: http://dx.doi.org/10.1378/chest.121.6.2000. [5]. Messina A, Longhini F, Coppo C, et al. Use of the fluid challenge in critically ill adult patients: a systematic review. Anesth Analg 2017;125(5):1532–1543. [6]. Monge García MI, Gil Cano A, Díaz Monrové JC. Brachial artery peak velocity variation to predict fluid responsiveness in mechanically ventilated patients. Crit Care 2009;13(5):R142–R1142. Available from: https://pubmed.ncbi.nlm.nih.gov/19728876. [7]. Brennan JM, Blair JEA, Hampole C, et al. Radial artery pulse pressure variation correlates with brachial artery peak velocity variation in ventilated subjects when measured by internal medicine residents using hand-carried ultrasound devices. Chest 2007;131(5):1301–1307. Available from: http://dx.doi.org/10.1378/chest.06-1768. [8]. Michard F, Boussat S, Chemla D, et al. Relation between respiratory changes in arterial pulse pressure and fluid responsiveness in septic patients with acute circulatory failure. Am J Respir Crit Care Med 2000;162(1):134–138. Available from: http://dx.doi.org/10.1164/ajrccm.162.1.9903035. [9]. Marik PE, Cavallazzi R, Vasu T, Hirani A. Dynamic changes in arterial waveform derived variables and fluid responsiveness in mechanically ventilated patients: a systematic review of the literature∗. Crit Care Med 2009;37(9):2642–2647. Available from: http://dx.doi.org/10.1097/ccm.0b013e3181a590da. [10]. Renner J, Meybohm P, Hanss R, Gruenewald M, Scholz J, Bein B. Effects of norepinephrine on dynamic variables of fluid responsiveness during hemorrhage and after resuscitation in a pediatric porcine model. Pediatr Anesth 2009;19(7):688–694. Available from: http://dx.doi.org/10.1111/j.1460-9592.2009.03017.x. [11]. Nouira S, Elatrous S, Dimassi S, et al. Effects of norepinephrine on static and dynamic preload indicators in experimental hemorrhagic shock. Crit Care Med 2005;33(10):2339–2343. Available from: http://dx.doi.org/10.1097/01.ccm.0000182801.48137.13. [12]. Mahjoub Y, Pila C, Friggeri A, et al. Assessing fluid responsiveness in critically ill patients: false-positive pulse pressure variation is detected by Doppler echocardiographic evaluation of the right ventricle. Crit Care Med 2009;37(9):2570–2575. Available from: http://dx.doi.org/10.1097/ccm.0b013e3181a380a3. [13]. Omar W, Mokhtar A, Abdelaziz K, Alazizi H. Predictive value of brachial artery reactivity in sepsis. Egypt J Crit Care Med 2020;7(1):4–9. [14]. De Backer D, Heenen S, Piagnerelli M, Koch M, Vincent J-L. Pulse pressure variations to predict fluid responsiveness: influence of tidal volume. Intensive Care Med 2005;31(4):517–523. Available from: http://dx.doi.org/10.1007/s00134-005-2586-4. [15]. Préau S, Saulnier F, Dewavrin F, Durocher A, Chagnon J-L. Passive leg raising is predictive of fluid responsiveness in spontaneously breathing patients with severe sepsis or acute pancreatitis. Crit Care Med 2010;38(3):819–825. Available from: http://dx.doi.org/10.1097/ccm.0b013e3181c8fe7a. [16]. Maizel J, Airapetian N, Lorne E, Tribouilloy C, Massy Z, Slama M. Diagnosis of central hypovolemia by using passive leg raising. Intensive Care Med 2007;33(7):1133–1138. Available from: http://dx.doi.org/10.1007/s00134-007-0642-y. [17]. Lamia B, Ochagavia A, Monnet X, Chemla D, Richard C, Teboul J-L. Echocardiographic prediction of volume responsiveness in critically ill patients with spontaneously breathing activity. Intensive Care Med 2007;33(7):1125–1132. Available from: http://dx.doi.org/10.1007/s00134-007-0646-7. [18]. Biais M, Vidil L, Sarrabay P, Cottenceau V, Revel P, Sztark F. Changes in stroke volume induced by passive leg raising in spontaneously breathing patients: comparison between echocardiography and Vigileo/FloTrac device. Crit Care 2009;13(6):R195–R1195. Available from: https://pubmed.ncbi.nlm.nih.gov/19968880. [19]. Boulain T, Achard J-M, Teboul J-L, Richard C, Perrotin D, Ginies G. Changes in BP induced by passive leg raising predict response to fluid loading in critically ill patients. Chest 2002;121(4):1245–1252. [20]. Vincent J-L, Gerlach H. Fluid resuscitation in severe sepsis and septic shock: an evidence-based review. Crit Care Med 2004;32(Suppl):S451–S454. Available from: http://dx.doi.org/10.1097/01.ccm.0000142984.44321.a4. [21]. Omar W, Elsayed M. Mortality prediction of microalbuminuria in septic patients. Open Access Maced J Med Sci 2019;7(23):4048. [22]. Luzi A, Marty P, Mari A, et al. Noninvasive assessment of hemodynamic response to a fluid challenge using femoral Doppler in critically ill ventilated patients. J Crit Care 2013;28(6):902–907. Available from: http://dx.doi.org/10.1016/j.jcrc.2013.05.010. [23]. El Zahaby HMM, El Henawy AMES, Youssef AMA, Ghallab EKAEM. Comparative study between femoral arterial doppler and echocardiography in fluid responsiveness assessment in septic shock patients. Egypt J Hosp Med 2018;72(9):5227–5232.
留言 (0)