
記住我

In patients with septic shock, hemodynamic stabilization using intravenous fluids remains a major therapeutic challenge as numerous questions remain regarding the type, dose and timing of fluid administration. Fluids have beneficial impact on outcome, especially in the context of hemodynamic optimization.1
Hemodynamic optimization has been shown to improve patient outcome when applied in the perioperative period and in the early phases of septic shock.1
Altogether, it seems reasonable to give just the amount of fluids needed when the patients is hemodynamically unstable and to restrict fluids when the patient is stabilized. Such an approach seems associated with better outcomes.1
Clinical studies have consistently demonstrated that only about 50% of hemodynamically unstable patients are volume responsive. It is therefore essential to have reliable bedside tools to predict the efficacy of volume expansion, and thus distinguishing patients who might benefit from volume expansion from those in whom the treatment is likely to be inefficacious.2
Many studies have focused on the prediction of fluid responsiveness, and many different dynamic markers of fluid responsiveness have been studied in recent years.2 Recent research has also demonstrated that standard static hemodynamic measurements [such as central venous pressure (CVP) or pulmonary artery occlusion pressure (PAOP)] are of little value in predicting fluid responsiveness.3
There are two techniques that are widely available, practical, easy to perform, and physiologically based, which can be used to determine fluid responsiveness with a high degree of accuracy, namely, the passive leg raising (PLR) maneuver and the fluid challenge (FC). These techniques are best coupled with minimally invasive or noninvasive cardiac output monitors, which can track changes in Stroke volume (SV) dynamically and in real time.4
Echocardiography is an essential tool for guiding resuscitation in critically ill patients. Echocardiography is an evidence-based approach and ideally suited to address this problem. However measurement of flow requires more time and expertise.5
Recently, electrical cardiometry (EC) was introduced as a new bio impedance method with the new algorithm for processing the impedance signal to overcome the limitations associated with bio impedance which are used to measure and calculate hemodynamic parameters as cardiac output, cardiac index, SV and systemic vascular resistance index.6
Carotid arterial Doppler analysis is a simple, non-invasive method to assess circulatory flow. Of note, preferential diversion of blood flow towards the carotid arteries away from the peripheries has been demonstrated in shock status. This would be of particular importance in hemodynamically unstable patients.7
There are limited clinical trials that assess the accuracy of EC and carotid Doppler in response to PLR and FC. Subsequently limited data has suggested them to provide a good tool predicting fluid responsiveness.8
2 Aim of the work 1. To investigate the accuracy of EC and carotid artery flow measurement in assessment of fluid responsiveness in critically ill septic patients. 2. To investigate the accuracy of PLR maneuver as a simple easy method in hemodynamic evaluation of critically ill septic patients. 3 Patients and methodsThis is a prospective observational study that was conducted in the Critical Care Medicine Department, Cairo University Hospitals from June 2019 to June 2020. The study was conducted after approval of the institutional review board and after obtaining a written informed consents from the patients or their relatives.
3.1 Inclusion criteriaA convenience sample of fifty critically ill patients “sepsis or septic shock” indicated to FC for hemodynamic optimization, fulfilling criteria of sepsis or septic shock were enrolled.
Sepsis is defined as patient who had 2 or more of qSOFA score
Respiratory rate ≥22/min. Altered mentation. Systolic blood pressure ≤100 mm Hg.Septic shock defined as sepsis with persisting hypotension requiring vasopressors to maintain MAP ≥ 65 mm Hg and having a serum lactate level >2 mmol/L (18 mg/dL) despite adequate volume resuscitation.9
3.2 Exclusion criteria 1) Patients less than 18 years old. 2) Patients with implantable cardiac pace-maker, defibrillator or dysrhythmia. 3) Contraindication to FC, defined as evidence of blood volume overload and/or of hydrostatic pulmonary oedema.10 4) Low LV systolic function “LV EF <40%”. 5) Contraindication to PLR.i. Head trauma. ii. Venous compression stockings. iii. Conditions that raise intra-abdominal pressure. 6) Poor echocardiographic window. 7) Refusal to participate in the study. 3.3 All patients were subjected to the following Detailed history taking. Detailed general and local clinical examinations. Radiographically investigation according to the clinical conditions. SBP, DBP, MAP, CVP measurement and their percent of change. Full laboratory investigations. Twelve lead ECG recording. 3.4 Study protocol 3.4.1 Baseline evaluation: the following measurements were obtained in the semi-recumbent position (45°; designated (‘baseline’) A) Hemodynamic variables: a first set of measurements of hemodynamic variables include (HR, RR, non-invasive MAP, CVP, and their percent of change %Δ). B) Echocardiographic data variables (VTILVOT, SVLvot, COP, and %ΔCOP, left ventricular ejection fraction LV EF %) C) Common carotid artery data variables (CCA VTI, SV, carotid blood flow “BF”, and %ΔBFCCA). D) All patients were monitored continuously during whole study period using impedance cardiograph new model “EC” based device (ICON®) and data variables (COP, SVV, and TFC) were recorded and retrieved from the device memory after the end of study protocol. (Fig. 1) Figure 1:
 Study protocol diagram.
3.4.2 First intervention procedure: PLRThe previous measurement were repeated following PLR which was done by lifting lower limbs while straight (45 degree) with the trunk lowered in the supine position (designated ‘post PLR’) within 1 minute. (Fig. 1)11
3.4.3 Second intervention procedure: FCThe THIRD set of measurements were obtained after giving FC which was performed by infusing 6 mL/kg normal saline over 15 minutes (designated ‘post FC’)12 (Fig. 1).
All measurements are coded as follow baseline measurement = 0 e.g. (CVP 0), post-PLR measurements = 1 eg (CVP 1), post-fluid challenge = 2 eg (CVP 2). Percent of change %Δ was calculated as follow
%Δ=post PLR or post FC−baselinebaseline×100
4 Devices and methods 4.1 EchocardiographySV and Cardiac output were obtained through VTI assessment by using echocardiography machine. Doppler was performed by the same operator using a standard transthoracic probe (P4–2 Siemens Acuson x300, Siemens Medical System, Malvern, PA, USA). SV obtained with transthoracic echocardiography (SV-TTE) was calculated as the product of LVOT area by the velocity time integral of LVOT (VTILVOT). Using the parasternal long axis view, the diameter of LVOT and LVOT area were calculated π [(diameter)2/4]. As the diameter of LVOT is assumed to remain constant in a given patient, the diameter was measured once at baseline. Using the apical five-chamber view, the. VTI lvot was computed from the area under the envelope of the pulsed wave Doppler signal obtained at the level of LVOT. Cardiac output obtained with transthoracic echocardiography (COP-TTE) was calculated as the product of heart rate (HR) by SV-TTE.
4.2 Carotid artery DopplerUltra-sonographic carotid Doppler blood flow images were obtained by using the same machine. Doppler was performed by the same operator using (VF10-5) linear probe, Siemens Acuson X300, Siemens Medical System, Malvern, PA, USA) while the patient in a semi-upright position and then supine with the legs passively raised at 45 degree (the PLR maneuver). An image of the common carotid artery (CCA) was obtained in the short axis view, and the maximal CCA diameter was recorded. The transducer was then rotated 90 degree into the long axis with attempts made to obtain an image with the same CCA diameter as recorded in the short axis The position of the transducer was marked, and the same acoustic window was used for repeated images. The velocity time integral in centimeters was determined automatically through digitalized Doppler spectral envelopes, with the sample obtained in the middle of the artery. Blood flow (BF) per minute was determined automatically using the following standard formula:
The Doppler data was obtained at the same angle (<60 degree) before and after the PLR maneuver and after FC.
4.3 Electrical Cardiometry device (ICON®)All patients were monitored continuously during the whole study period using “EC” based device (ICON®). The EC monitor sensor (Electrical Cardiometry monitor, ICON® Cardiotronics, Inc., La Jolla, CA 92307; Osypka Medical GmbH, Berlin, and Germany) was connected to the sensor cable and the patient data were fed. The ICON® monitor incorporates an algorithm which transforms the ohmic equivalent of mean aortic blood flow acceleration into an equivalent of mean aortic blood flow velocity (Fig. 2).
 Figure 2:
 Electrical Cardiometry Monitor Osypka Medical GmbH, Berlin, Germany.
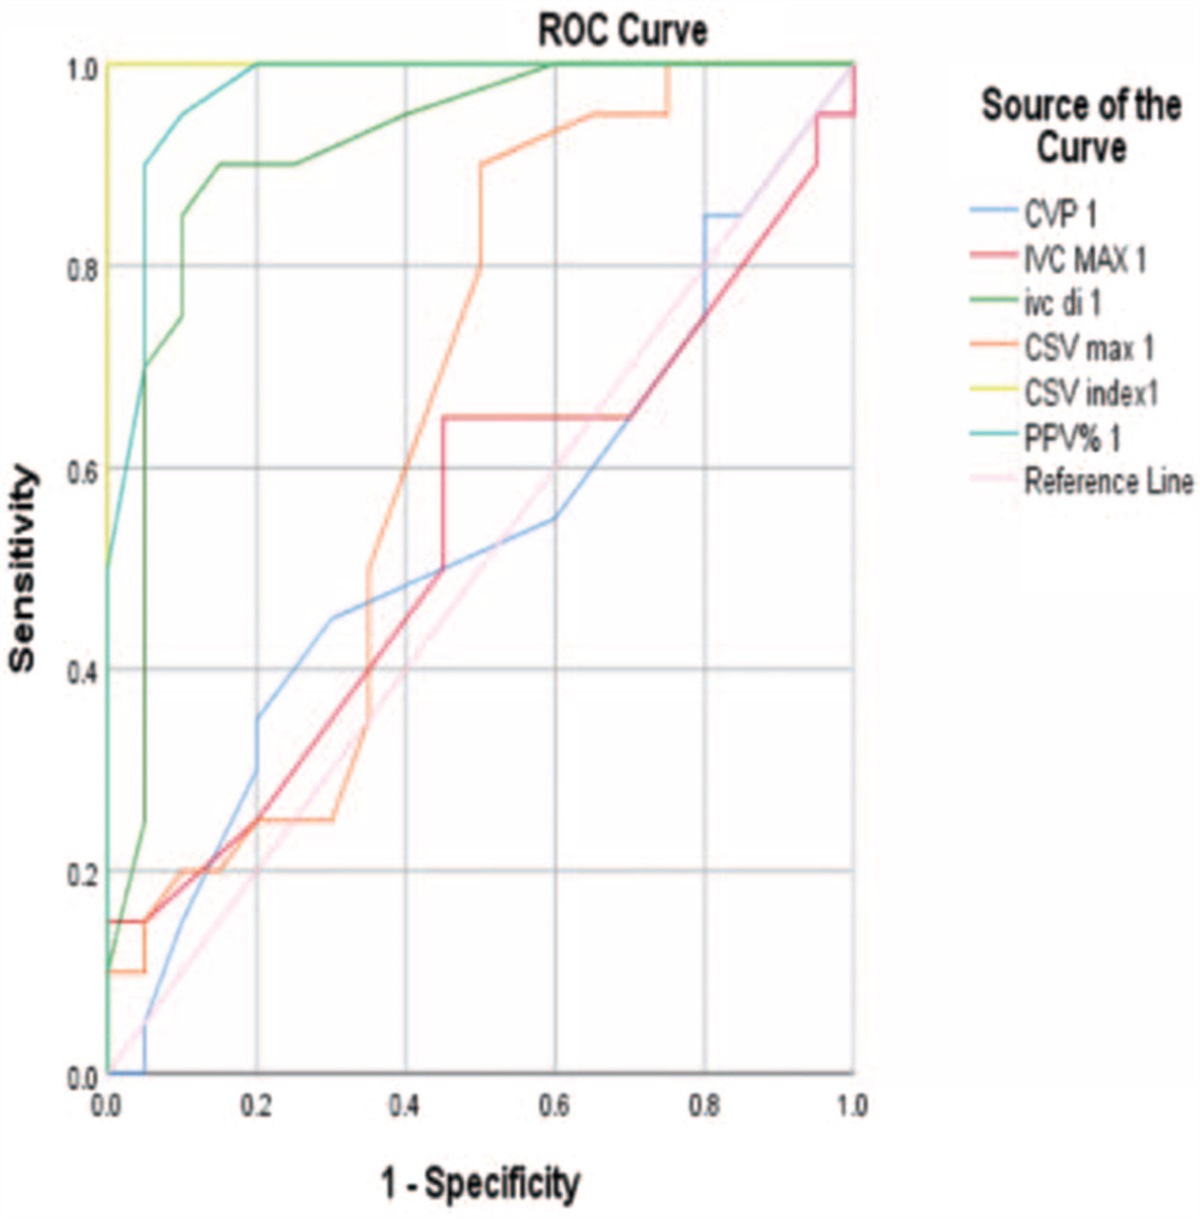
4.4 Statistical methodData was analyzed using IBM SPSS Advanced Statistics version 22 (SPSS Inc., Chicago, IL). Numerical data were expressed as mean and Standard deviation or median and range as appropriate. Qualitative data were expressed as frequency and percentage. Comparison of numerical Variables between the study groups was done using Student + test for Independent samples. For comparing categorical data, Chi square (χ2) test was performed. Correlation between various variables was done using Spearman rank correlation equation for non-normal variables. P values less than 0.05 was considered statistically significant, Chi-square test (Fisher's exact test) was used to examine the relation between qualitative variables. For quantitative data, comparison between two groups was done using Mann-Whitney test. Comparison of repeated measures was done using Wilcoxon signed-ranks test.). ROC curve was constructed with area under curve (AUC) analysis performed to detect best cutoff value of different parameters for detection of responders. Kappa measure of agreement was used to test agreement between categorical variables. Standard diagnostic indices including sensitivity, specificity, positive predictive value (PPV), negative predictive value (NPV) and diagnostic efficacy were calculated. A P-value <.05 was considered significant.
4.4.1 The study population were subdivided into two groups responders and non-responders Responders group 1 (R) were defined as those who had increase of 15% in CO from baseline measured by echocardiography after FC. Non-responders group 2 (NR) those who had increase of less than 15% in co from baseline measured by echocardiography after FC. 5 ResultsThe study was conducted on convenient sample of fifty critically ill septic patients admitted to Critical Care Department, Cairo University Hospitals from June 2019 to June 2020.
Results of study population are presented as in the following diagram (Fig. 3).
 Figure 3:
 Study group inclusion diagram.
Our results will be represented under the following headings:
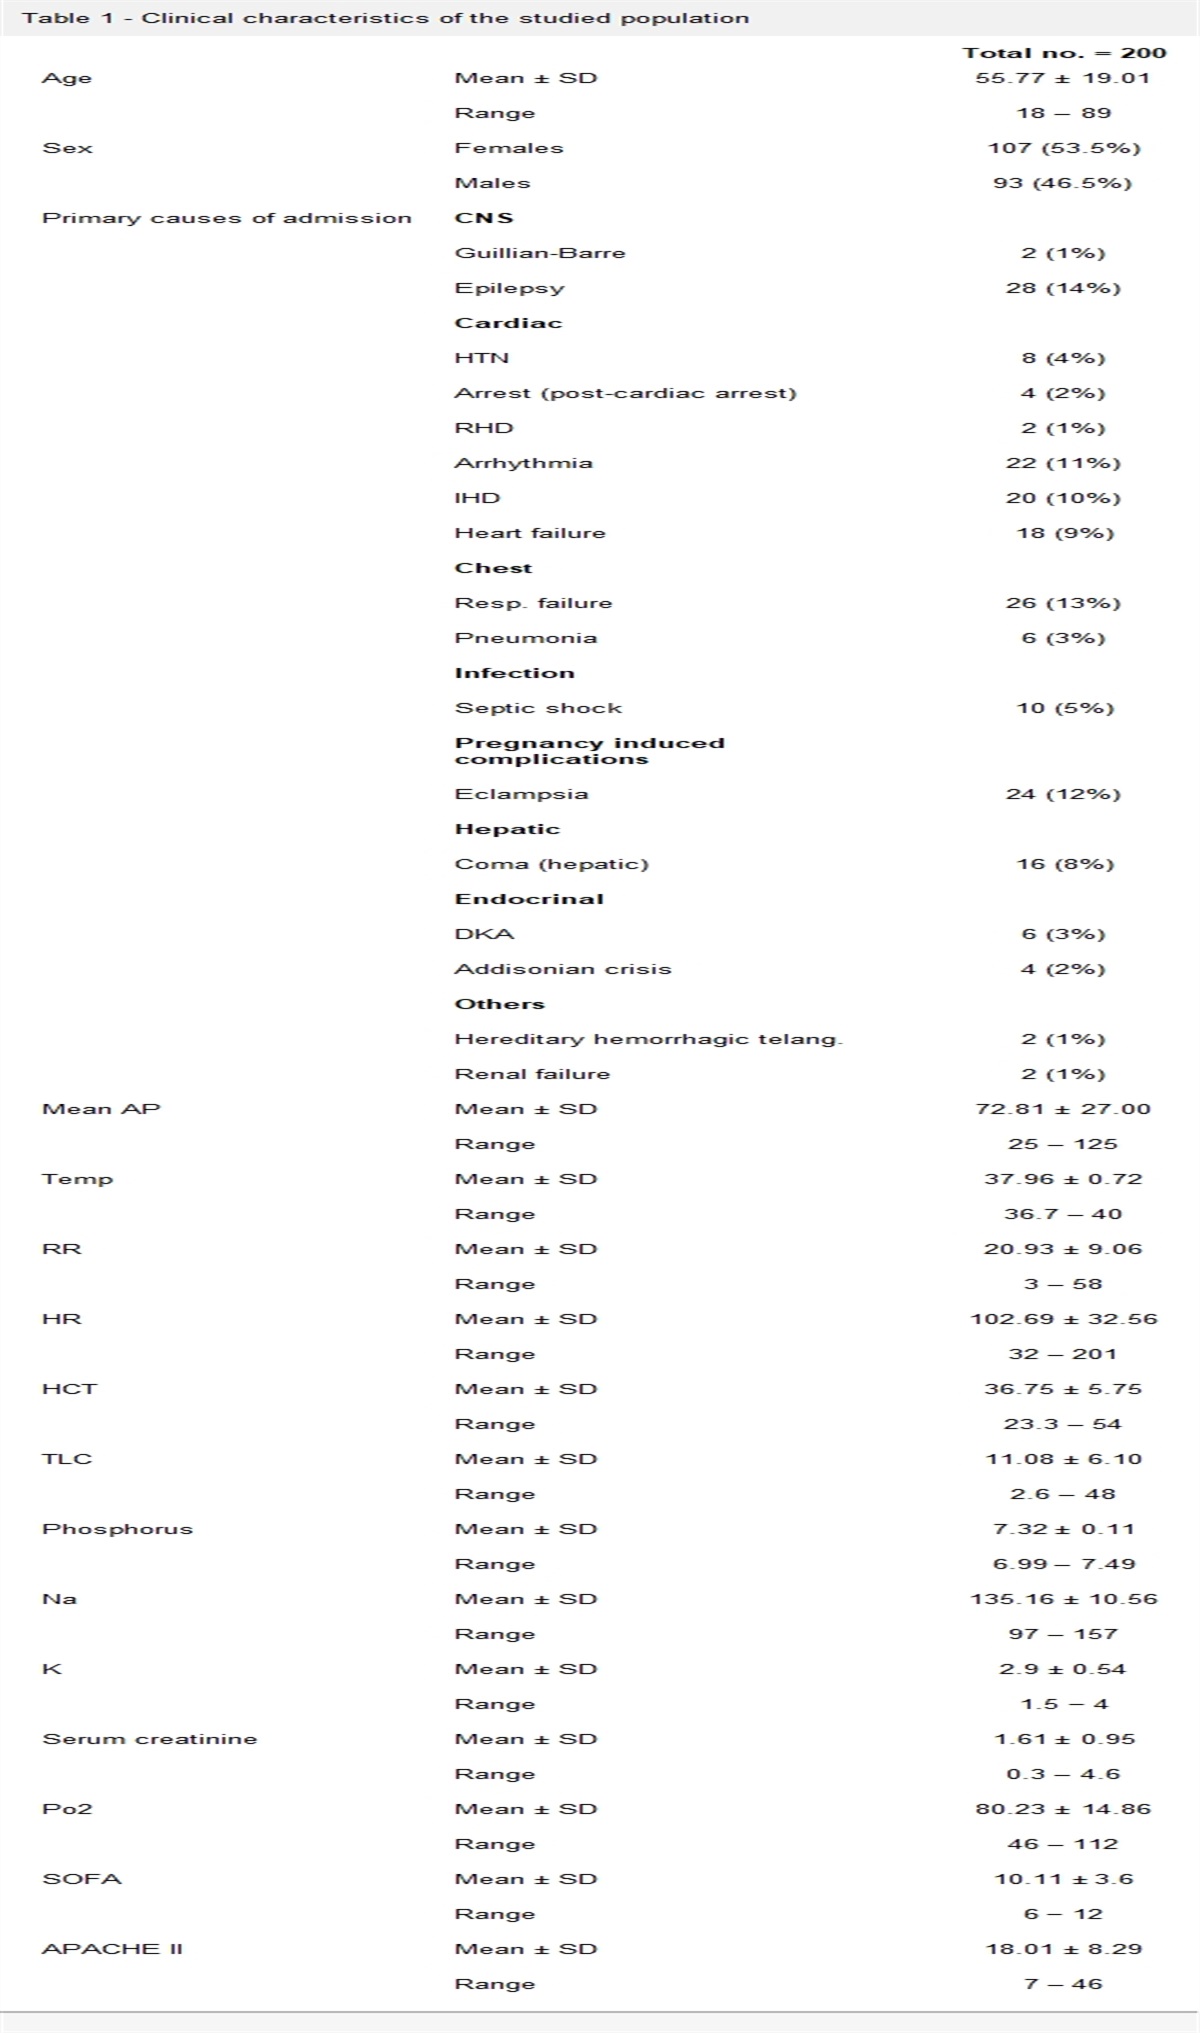
A) Descriptive and comparative analysis B) Correlations C) Validity and agreement analysis 5.1 Descriptive and comparative data analysis 5.1.1 General Study population characteristicsThere was no statistically significant difference between responders and non-responders group with a probability value (P) of (P > .005) regarding demographic data as well as co-morbid conditions.
In our study population of total number of 44 patients, 21 patients (47.7%) has proven septic shock and 23 patients had only sepsis (52.30%) comparison between the two study groups showed that in group 1 R there was 13 (65%) patients had septic shock and only 8 (33%) patients in group 2 NR had septic shock with a statistically significant difference between responders and non-responders group (P = .036). Acute physiology and chronic health evaluation II (APACHE II) score in the study population of total number of 44 patients had a mean of 20.9 ± 5.0. Comparison between the study groups regarding APACHE II score showed group 1 R had a higher score of a mean of 23.03 ± 4.7 while group 2 NR mean score was only 19.13 ± 4.59 with a statistically significant difference of (P = .008) (Fig. 4).
 Figure 4:
 APACHE II in study population and among the two groups. APACHE II, acute physiology and chronic health evaluation II.
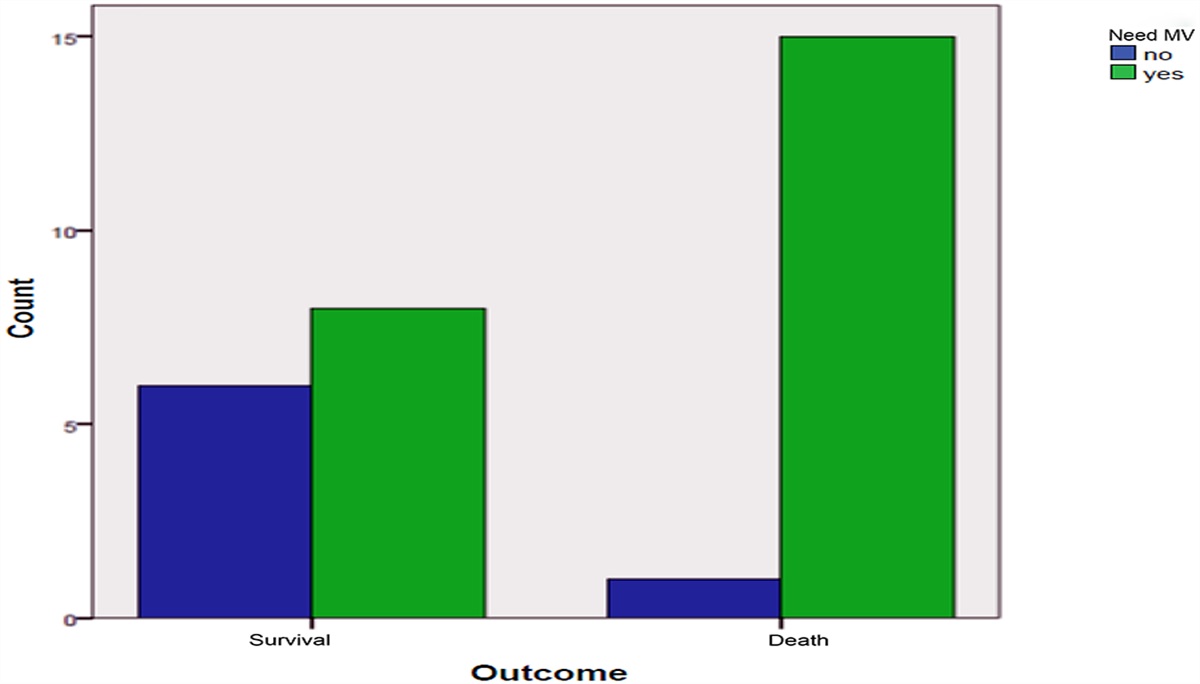
Comparison between study groups regarding source of sepsis, confirmed source of sepsis, and use of mechanical ventilation showed no statistically significant difference (Table 1).
Table 1 - Comparison between study groups retarding source of sepsis, confirmed source of sepsis, and, use of MV All (n = 44) Group I R Group 2 NR P value Septic shock 21 (47.7%) 13 (65%) 8 (33.3%) .036 Confirmed source 20 (45.5) 8 (40%) 12 (50%) .360 Vasopressors 21 (47.7%) 13 (65%) 8 (33.3) .036 Mechanical ventilation 20 (45.5%) 8 (40%) 12 (50%) .556 Sepsis source Chest 25 (56.8%) 12 (60%) 13 (54.2%) .467 Abdomen 7 (15.9%) 4 (20%) 3 (125%) .394 Urinary 19 (43.2%) 10 (50%) 9 (37.5) .456 Line sepsis 10 (22.7%) 6 (30%) 4 (16.7%) .245 Soft tissue 8 (18.2) 3 (15%) 5 (20.8%) .461 Diabetic foot 7 (15.9%) 2 (10%) 5 (20.8%) .290 APACHE II 20.90 ± 4.99 23.03 ± 4.7 19.13 ± 4.59 .008APACHE II, acute physiology and chronic health evaluation II; MV, mechanical ventilation; NR, non-responders; R, responders.
Comparison between study groups regarding CVP at baseline (CVPO) and CVP measurement post PLR (CVP1), and post FC (CVP2) and % Δ CVPO and % Δ CVP2 showed that there was a statistically difference between responds group 1 and non-responds group 2 regarding %Δ CVP POST, PLR (CVP1) and post FC (CVP2) (P < .05), with higher mean values in responders group. But there was no statistically difference regarding mean values of CVP at baseline (CVPO) (Table 2).
Table 2 - Comparison between study groups regarding CVP Group I R Group 2 NR Mean ±SD Mean ±SD P value CVP 0 mm Hg 7.62 3.5 9.8 4.1 .076 CVP 1 mm Hg 12.1 3.61 11.6 4.2 .668 %Δ CVP 1 72.74 57.10 25.10 38.94 .002 CVP 2 mm Hg 15.4 3.5 13.75 3.75 .129 %Δ CVP 2 128.1 88.2 53.49 44.71 .001CVP, central venous pressure; NR, non-responders; R, responders; SD, standard deviation.
There was a statistically significant difference between responders and non- responders group regarding %Δ in CVP measurements post PLR (CVP 1) and post FC (CVP 2) (P < .05) with higher mean values in responders group. However there was no statistically significant difference regarding mean values of CVP values at baseline, as shown in Table 2.
5.1.2 Comparison between study groups regarding Mean arterial pressure MAPThere was a statistically significant difference between responders and non-responders group regarding baseline MAP0 (P = .002) with lower mean values in responders group. Also There was a statistically significant difference in %Δ MAP 1, 2 measurements post PLR and post FC (P < .05) with higher mean values in responders group. With no statistically significant difference regarding mean values of MAP 1, MAP 2 values, post PLR and post FC, as shown in Table 3.
Table 3 - Comparison between study groups regarding MAP Group R Group NR Mean ±SD Mean ±SD P value MAP 0 mm Hg 65.77 7.83 75.10 10.66 .002 MAP 1 mm Hg 75.36 8.04 72.50 9.10 .280 %Δ MAP 1 15.13 9.81 -1.57 18.82 .001 MAP 2 mm Hg 80.10 7.18 82.61 6.15 .22 %Δ MAP 2 22.43 8.76 12.35 19.46 .038MAP, mean arterial blood pressure; NR, non-responders; R, responders; SD, standard deviation
There was a statistically significant difference between baseline, post PLR and post FC COPECHO and %Δ COECHO (P < .05) with more increase mean values in responders group, as shown in Table 4 and Figure 5.
Table 4 - Comparison of study groups regarding cardiac output Group R Group NR COP (L/min) Mean ±SD Mean ±SD P value COP 0 9.59 2.36 8.20 2.15 .046 COP 1 12.03 2.98 8.81 2.28 .0002 %Δ COP 1 25.68 8.89 7.64 1.11 <.0001 COP 2 12.00 2.98 8.78 2.30 .00002 %Δ COP 2 25.10 7.48 7.17 1.11 <.0001COP, Cardiac Out Put; NR, non-responders; R, responders; SD, standard deviation
 Figure 5:
 Comparison COPECHO and %Δ COPECHO between R and NR. NR, non-responders; R, responders.
5.1.4 Comparison between study groups regarding common carotid artery Doppler 5.1.4.1 Common carotid artery blood flow (BF) BFCCAThere was a statistically significant difference between responders and non-responders group regarding %Δ BFCCA post PLR and post FC (P < .05) with higher mean values in responders group. There was no statistically significant difference between responders and non-responders group regarding absolute value of baseline BF (CCA0), post PLR (BF CCA1), and post FC (BF CCA2) (P > .05), as shown in Table 5 and Figure 6.
Table 5 - Comparison of study groups regarding BFCCA Group R Group NR BFCCA (mL/min) Mean ±SD Mean ±SD P value BFCCA 0 512 176 590 168 .137 BFCCA 1 667 238 673 196 .933 %ΔBFCCA 1 29.82 6.83 13.81 2.86 <.0001 BFCCA 2 679 223 678 189 .975 %ΔBFCCA 2 33.43 6.79 14.98 2.35 <.0001BFCCA, common carotid artery blood flow; NR, non-responders; R, responders; SD, standard deviation
 Figure 6:
 Comparison %Δ BFCCA 1 and %Δ BFCCA 2 between R and NR. BFCCA, common carotid artery blood flow; NR, non-responders; R, responders.
5.1.4.2 Comparison of CCA blood flow (BF) BFCCA post PLR and FC in each groupThere was a statistically significant difference between baseline (CCA0), post PLR (CCA1) and post FC (CCA 2) BFCCA in responders and non-responders group (P < .05). With more increase mean values in non-responders group post PLR in contrast to responders post FC as shown in Table 6.
Table 6 - Comparison of CCA BFCCA baseline, post PLR and FC BFCCA0 BFCCA1 BFCCA2 BFCCA (mL/min) Mean ±SD Mean ±SD Mean ±SD P value Group 1 R 512 176 667 236 679 223 <.0001 Group 2 NR 590 168 673 196 678 189 <.0001BFCCA, common carotid artery blood flow; NR, non-responders; R, responders; SD, standard deviation
There was a statistically significant different between responders and non-responders group regarding post PLR and post FC COPEC 1, 2 and %Δ COPEC (P < .05) with higher mean values, in responders group. There was no statistically significant difference between responders and non-responders group regarding baseline COPEC as shown in Table 7.
Table 7 - Comparison of study groups regarding COPEC Group R Group NR COPEC (L/min) Mean ±SD Mean ±SD P value COPEC 0 7.19 3.96 6.38 2.23 .400 COPEC 1 9.20 4.23 6.85 2.35 .024 %ΔCOPEC 1 35.71 29.08 7.58 3.61 .00002 COPEC 2 9.58 4.27 6.97 2.39 .014 %ΔCOPEC 2 42.54 28.18 9.48 4.22 <.0001COPEC, electrical cardiometry cardiac output; NR, non-responders; R, responders; SD, standard deviation.
There was a statistically significant difference between baseline, post PLR and post FC COPEC
留言 (0)