
記住我
Non-invasive ventilation (NIV) is frequent applied respiratory support beside oxygen therapy to stabilize respiratory failure patients.1,2 NIV could improve work of breathing and gas exchange as invasive ventilation.3,4 NIV can be used in any type of respiratory failure with special considerations.4,5 NIV has a lot of advantages as decrease complications, endotracheal intubation (ETI), mortality, length of ICU stay and cost.1,6,7 In other words, NIV has some disadvantages as being interrupted ventilatory support with imprecise managing the patient pulmonary pressures, also when NIV used inappropriately it could lead to worse effect.8,9 Although a lot of knowledge to admit NIV in clinical practice are present, still studies are needed to clarify its precise usage8,10; the appropriate patients for its benefit and which patient clinical characters are suitable for it.11 Many known factors related to NIV failure as types of respiratory failure, state of the patients, underlying lung diseases, and expert hands.5,12,13 In the present study we are aiming for identification the clinical, laboratory, and ventilator factors related to NIV failure.
2 Patients and methodsA prospective observational study, it was conducted in Assiut University Hospital, chest department at respiratory intensive care unit; between May 2018 and May 2019. The study was approved by the institutional ethical review committee. The patients were eligible for enrolment if they were admitted to the respiratory ICU (RICU), chest department in Assiut university hospital and the attending team conducted them to NIV after conservative treatment failure during the recruitment period; the research team did not interfere with the patients management plan as was decided by the managing physician according to their RICU protocol; to make the results applicable for every day RICU clinical practice.
The included patients in this study are subjected to detailed history taking including previous hospital admission, previous ICU admission, previous need of NIV, and other comorbidities. Detailed general and local chest examination were recorded including recording patient's blood pressure, heart rate, respiratory rate, temperature, and conscious level by Glasgow Coma Scale.14 Also the patient final diagnosis was recoded and the patients on NIV were precisely followed with research study team for their outcome till discharged from ICU.
Laboratory investigations including arterial blood gases (ABGs) were recorded from the patients lab sheets; that was obtained using heparinized blood sample from radial artery and analyzed using blood gases analyzer (Rapid lab 850; CHIRON/Diagnostics; critical care systems) at admission, just before NIV, 1 hour, 24 hours, 48 hours, after NIV use, and at discharge from ICU; all these measurements obtained according to the Assiut University respiratory intensive care protocol for patient on NIV, complete blood count, random blood sugar, renal function test, liver function test, and serum electrolytes obtained during admission were also recorded. All patients enrolled in this study were reassessed for the assessment of predictors of hospital mortality by using: acute physiology and chronic health evaluation II (APACHE-II) and Sequential Organ Failure Assessment (SOFA) score.15,16
Type of non-invasive mode either spontaneous or SIMV, inspiratory positive airway pressure (IPAP), expiratory positive airway pressure (EPAP), respiratory rate, trigger sensitivity, and fraction of inspired oxygen (FiO2) all are recorded.
2.1 Statistical analysisContinuous data are presented as mean ± standard deviation (SD) and categorical data are summarized as discrete values and percentages [n (%)]. Paired continuous samples were compared using paired Student T test, Mann–Whitney–Wilcoxon test, and ANOVA test, when appropriate. Relationships between parameters were tested using the Pearson correlation test, all P values are two-tailed and a value of <0.05 was considered significant. Univariate then multivariate regression analysis models were performed to determine the predictors of outcome. The statistical analyses were performed using the statistical package IBM SPSS, version 20 (IBM; Armonk, New York).
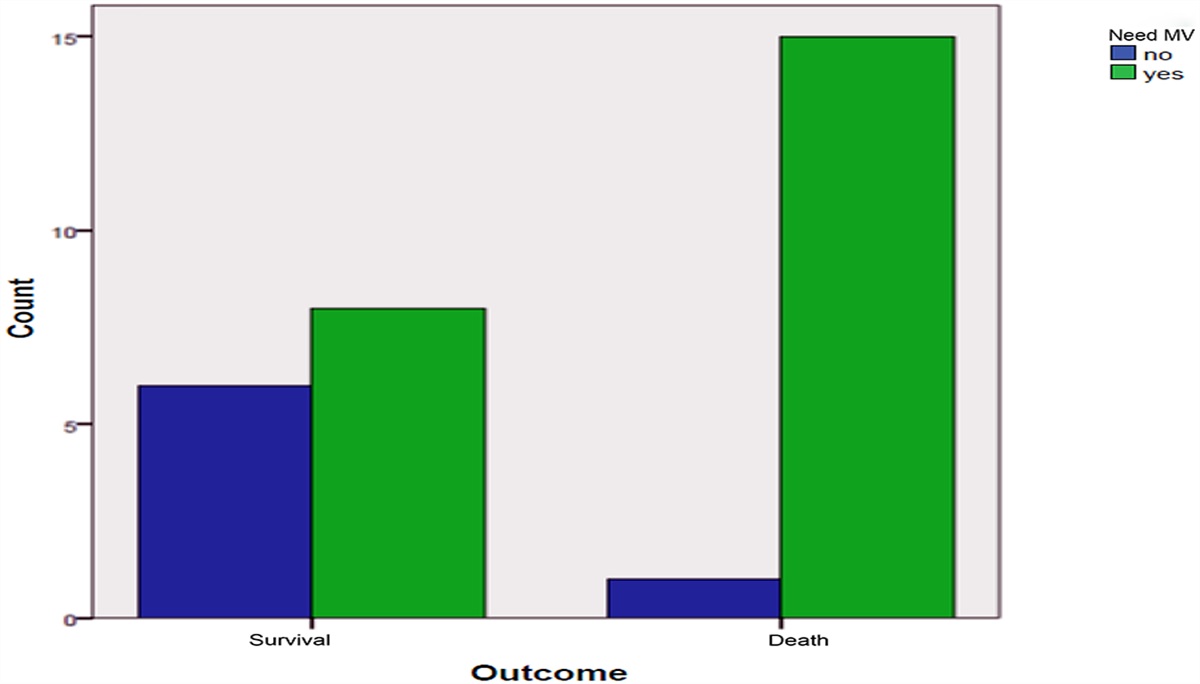
3 ResultsThree hundred sixty-five patients were admitted to our RICU during the study recruitment period; of them 150 patients assigned to have NIV by the attending physician; of the NIV patients, 75 (50%) were males. The recruited patients are followed till discharge and divided into 2 groups: Group I (successful NIV group), 94 (62.7%) patients and Group II (failed NIV group), 56 (37.3%) patients. (NIV failure is defined as the need for endotracheal intubation.) Both groups were further divided into another 2 groups according to final diagnosis: (107 patients) obstructive group (COPD 20.3%, overlap syndrome 23%, bronchiectasis 7.4%, bronchial asthma 2.7%, combined COPD and pneumonia 25.7%) and (43 patients) and restrictive group (pneumonia 13.5% and ILD 14.9%). Restrictive lung disease presented in 19 (20.2%) and obstructive lung disease presented in 75 (79.8%) of patients with successful NIV and restrictive lung disease presented in 24 (42.9%) and obstructive lung disease presented in 32 (57.1%) of patients with failed NIV. NIV was significantly succeeded in 70% in patients with obstructive lung diseases, while 55.8% failed in restrictive lung diseases patients.
Mean age of all patients was 57.72 ± 12.60 years and 50% of them were male. It was noticed that 83 (55.3%) patients were non-smokers. Twenty-eight (18.7%) patients had previous hospital admission. Previous mechanical ventilation and previous non-invasive ventilation were presented in 10 (6.7%) and 27 (18%) patients, respectively.
Out of the studied patients, 60 (40%), 58 (38.7%), 13 (8.7%), 17 (11.3%), and 14 (9.3%) patients had diabetes mellitus, hypertension, ischemic heart disease, renal disease, and hepatic disease, respectively with median comorbidities 1 and range between 0 and 4 disease. Previous hospital admission presented in 17 (18.1%) patients; previous mechanical ventilation presented in 6 (6.5%) patients; and previous NIV presented in 16 (17%) patients with successful NIV, while previous hospital admission presented in 11 (19.6%); previous mechanical ventilation presented in 4 (7.1%); and previous NIV presented in 11 (19.6%) patients with failed NIV.
As regarding to comorbidities in both groups, the most frequent comorbidities in patients with successful NIV were hypertension (39.4%), diabetes mellitus (36.2%), and ischemic heart disease (8.5%) with comorbidity index range between 0 and 3, while in case of failed NIV, the most frequent comorbidities were diabetes mellitus (46.4%), hypertension (37.5%), and ischemic heart disease (8.9%) with comorbidity index range between 0 and 4. It was noticed that both groups of patients had insignificant differences as regarding baseline characteristics (P > 0.05). Patients with failed NIV had significantly higher frequency of type 1 respiratory failure (51.8%) while those patients with successful NIV had significantly higher respiratory failure type 2 (73.4%). It was noticed that 59 (62.8%) and 42 (75%) patients with successful and failed NIV, respectively had NIV at emergency room. Diastolic blood pressure at time of admission was significantly higher among patients with successful NIV (78.72 ± 10.99 mm Hg vs 74.46 ± 10.60 mm Hg; P = 0.02) while respiratory rate (30.70 ± 6.88 cycle/minute vs 35.41 ± 9.37 cycle/minute; P < 0.001) and heart rate (104.10 ± 16.54 beat/minute vs 113.83 ± 19.41 beat/minute; P < 0.001) were significantly lower among those patients in comparison to those with failed NIV (Table 1).
Table 1 - Characteristics of studied patients based on outcome of NIV All patients (n = 150) Successful NIV (n = 94) Failed NIV (n = 56) P Age (yr) 57.72 ± 12.60 57.40 ± 12.13 58.25 ± 13.44 0.69 Sex 0.39 Male 75 (50%) 50 (53.2%) 25 (44.6%) Female 75 (50%) 44 (46.8%) 31 (55.4%) Previous admission 28 (18.7%) 17 (18.1%) 11 (19.6%) 0.83 Drug addiction 3 (2%) 2 (2.1%) 1 (1.8%) 0.68 Previous MV 10 (6.7%) 6 (6.5%) 4 (7.1%) 0.99 Previous NIV 27 (18%) 16 (17%) 11 (19.6%) 0.82 Type of lung disease <0.001 Restrictive 43 (28.7%) 19 (20.2%) 24 (42.9%) Obstructive 107 (71.3%) 75 (79.8%) 32 (57.1%) Respiratory failure <0.001 Type 1 54 (36.7%) 25 (26.6%) 29 (51.8%) Type 2 96 (64%) 69 (73.4%) 27 (48.2%)Data expressed as mean (SD), frequency (percentage). P value was significant if <0.05. IHD: ischemic heart disease; MV: mechanical ventilation; NIV: non-invasive ventilation; SD: standard deviation.
Table 2 shows that both groups with failed or successful NIV had insignificant differences as regarding baseline data with exception of patients with successful NIV had significant higher hematocrit value (42.93 ± 8.25 vs 38.12 ± 7.34%; P < 0.001) in comparison to those with failed NIV. It was noticed that leukocyte count was significantly higher among those failed NIVs (14.60 ± 8.63 vs 10.42 ± 6.13 × 10⁹/L; P < 0.001). Also noticed serum albumin was higher in successful group (28.02 ± 6.54 vs 27.67 ± 6.33; P = 0.09) in contrary random blood glucose was higher in failed group (199.17 ± 88.89 vs 174.20 ± 92.31; P = 0.09); however, both of them did not reach statistically significant level.
Table 2 - Laboratory data of studied patients on admission based on outcome of NIV Successful NIV (n = 94) Failed NIV (n = 56) P Complete blood count Leukocytes (×109/L) 10.42 ± 6.13 14.60 ± 8.63 <0.001 Hematocrite value (%) 42.93 ± 8.25 38.12 ± 7.34 <0.001 Platelets (×109/L) 233.10 ± 101.47 256.83 ± 107.07 0.17 Kidney function test Urea (mmol/L) 10.64 ± 3.22 8.89 ± 4.11 0.20 Creatinine (mmol/L) 117.70 ± 23.56 95.23 ± 22.24 0.10 RBS (mg/dL) 174.20 ± 92.31 199.17 ± 88.89 0.09 Electrolytes Na+ 136.13 ± 4.74 136.64 ± 4.93 0.17 K+ 4.01 ± 0.59 4.01 ± 0.59 0.56 Ca+2 8.44 ± 1.02 8.56 ± 0.67 0.89 Mg+2 3.02 ± 0.42 2.04 ± 0.30 0.43 Liver function test Bilirubin (mmol/L) 7.81 ± 2.44 6.16 ± 4.89 0.48 Albumin (mg/dL) 28.02 ± 6.54 27.67 ± 6.33 0.09 ALT (U/L) 61.48 ± 28.56 55.28 ± 21.45 0.75 AST (U/L) 58.75 ± 42.99 59.11 ± 33.45 0.07Data expressed as mean (SD), frequency (percentage). P value was significant if <0.05. ALT: alanine transaminase; AST: aspartate transaminase; NIV: non-invasive ventilation; SD: standard deviation.
Patients with failed NIV had significantly higher APACHE-II score in comparison to those with successful NIV (19.78 ± 4.09 vs 13.77 ± 3.68; P < 0.001) while SOFA was insignificantly higher in patients with failed NIV (5.66 ± 1.63 vs 5.50 ± 1.65; P = 0.56).
3.3 Changes in arterial blood gases in studied patients based on outcome of NIVABGs were assessed at different times before and after NIV in studied patients. FiO2 was significantly higher among patients with failed NIV 1 hour, 24 hours, and 48 hours after NIV in comparison to those with successful NIV; 44.67 ± 13.17, 42.94 ± 12.95, 42.38 ± 12.95 vs 39.5 ± 6.94, 37.02 ± 6.95, 36.35 ± 7.78; P < 0.001, <0.001, 0.02, respectively, pH+ at baseline (7.36 ± 0.09 vs 7.39 ± 0.10; P = 0.04) and just before NIV (7.32 ± 0.09 vs 7.36 ± 0.09; P < 0.001) was significantly lower among those with successful NIV, while PaCO2 was significantly higher (60.98 ± 20.48 vs 52.32 ± 22.78; P = 0.01, 68.20 ± 22.80 vs 58.20 ± 24.64; P = 0.01), respectively. PaO2 1 hour, 24 hours, and 48 hours of NIV use in successful group (75.36 ± 14.59, 75.12 ± 15.51, 77.18 ± 13.22) vs (70.51 ± 14.64, 66.65 ± 18.16, 70.01 ± 12.20; P = 0.05, <0.001, 0.04) in failed NIV group, respectively and SaO2 (94.11 ± 3.70, 94.01 ± 3.33, 93.87 ± 9.80) vs (91.64 ± 5.68, 89.65 ± 9.86, 93.07 ± 2.32; P < 0.001, <0.001, 0.79) at 1 hour, 24 hours, and 48 hours after NIV was significantly lower in patients with failed NIV. Both groups had insignificant differences as regarding HCO3 at different times of assessment. PaO2/FiO2 1 hour of NIV use was significantly associated with NIV failure (R 0.340; P < 0.0001).
3.4 Data of NIV setting in studied groupsBoth groups had insignificant difference as regarding IPAP but patients with failed NIV had significantly higher EPAP in comparison to those with successful NIV (6.21 ± 1.28 vs 5.75 ± 1.01 mm Hg; P = 0.01) (Table 3). Also, auto trigger was significantly higher in patients with failed NIV (4.03 ± 1.20 vs 3.57 ± 0.96; P = 0.01). Duration of NIV was significantly longer in patients with successful NIV (4.08 ± 2.79 vs 3.22 ± 2.32 days; P = 0.04). Both groups had insignificant differences as regarding set respiratory rate and delayed cycle.
Table 3 - Data of NIV setting in studied groups Successful NIV (n = 94) Failed NIV (n = 56) P Mode of NIV 0.43 SIMV 46 (48.9%) 29 (51.8%) Spontaneous 48 (51.1%) 27 (48.2%) IPAP (mm Hg) 15.80 ± 2.14 16.48 ± 2.68 0.09 EPAP (mm Hg) 5.75 ± 1.01 6.21 ± 1.28 0.01 Rate 12.10 ± 1.37 12.07 ± 2.01 0.90 Auto trigger 3.57 ± 0.96 4.03 ± 1.20 0.01 Delayed cycle 40.95 ± 12.07 41.16 ± 11.63 0.92 Duration of NIV (d) 4.08 ± 2.79 3.22 ± 2.32 0.04Data expressed as mean (SD). P value was significant if <0.05. EPAP: expiration positive airway pressure; IPAP: inhalation positive airway pressure; NIV: non-invasive ventilation; SD: standard deviation; SIMV: synchronized intermittent mandatory ventilation.
Patients with failed NIV had significantly longer duration of hospital stay in comparison to those with successful NIV (13.85 ± 6.56 vs 7.41 ± 4.42 day; P < 0.001). Hospital mortality is significantly higher in failed NIV group while not in successful group. Strong association between NIV failure and ICU mortality of the studied cohort (R 0.78; P < 0.0001) were observed.
3.6 Association between variables and NIV outcomeAssociations between admission random blood glucose level with NIV failure (R 0.213; P = 0.009), associations between patients with type of 1 respiratory failure and NIV failure (R 0.230; P = 0.005), significant correlations between need for invasive ventilation and lower PaO2/FiO2 (R 0.340; P < 0.0001), strong association between NIV failure and ICU mortality of the studied cohort (R 0.78; P < 0.0001), our analysis show significant association between high NIV failure (R 0.279; P = 0.001) and patient mortality (R 0.291; P < 0.0001) with low hemoglobin level, high heart rate at admission associated with NIV failure (R 0.250; P = 0.002).
3.7 Predictors of failed NIVPredictors for failed NIV were restrictive lung disease (OR = 1.94, 95%CI = 1.64–5.88; P = 0.04), EPAP (OR = 1.18, 95%CI = 1.08–1.64; P = 0.02), auto trigger (OR = 1.18, 95%CI = 1.07–1.58; P = 0.01), and EPAP (OR = 2.11, 95%CI = 1.07–5.78; P = 0.01) with adjusted R2 was 0.68 (Table 4). Data expressed as mean (SD). P value was significant if <0.05.
Table 4 - Multivariate regression analysis to determine predictors of failed NIV Predictors Odd's ratio 95% confidence interval P value APACHE-II 2.11 1.07–1.58 <0.001 Restrictive lung disease 1.94 1.64–5.88 0.04 EPAP 1.17 1.08–1.64 0.02 Auto trigger 1.18 1.07–1.58 0.01P value was significant if <0.05. APACHE-II: acute physiology and chronic health evaluation II; EPAP: expiration positive airway pressure; NIV: non-invasive ventilation.
It was noticed that APCHE-II score at cut off point > 17 had 54% sensitivity and 88.30% specificity for prediction of failed NIV with overall accuracy 75.3% and area under curve 0.80 (Table 5). Presence of restrictive lung disease had 43% sensitivity and 57% specificity for prediction of failed NIV with area under curve 0.62 and with overall accuracy 66.7%. It was noticed that EPAP at cut off point > 6 had 41% sensitivity and 70% specificity for prediction of failed NIV with overall accuracy 59.3% and with area under curve 0.59, while auto trigger at cut off point > 4 had 48% sensitivity and 73% specificity for prediction of failed NIV with overall accuracy 64% and with area under curve 0.60.
Table 5 - Diagnostic performance of APACHE-II in prediction of failed NIV Indices APACHE-II Restrictive disease EPAP Auto trigger Sensitivity 54% 43% 41% 48% Specificity 88.30% 81% 70% 73% PPV 73.2% 57% 45% 51% NPV 76.1% 70.4% 67% 70% Accuracy 75.3% 66.7% 59.3% 64% AUC 0.80 0.62 0.59 0.60 Cut off point >17 – >6 >4 P value <0.001 0.01 0.04 0.03P value was significant if <0.05; APACHE-II: acute physiology and chronic health evaluation II; AUC: area under curve; EPAP: expiration positive airway pressure; NIV: non-invasive ventilation; NPV: negative predictive value; PPV: positive predictive value.
In a well-equipped respiratory intensive care unit, 150 patients consequently conducted to NIV are carefully followed; 56 (37.3%) patients failed NIV, of them 38 (67.9%) deceased on RICU follow-up; this finding similar as previously noted NIV failure reported more than third of the conducted cases, and commonly there is increase in mortality with unsuccessful NIV5,17,18; patients with failed NIV have more chance of poor survival, as observed in our study and also in other studies18. This is making us cautious in selecting patients for NIV support to avoid delaying invasive ventilation.17 In the failed NIV cases, 56% (24/43) of the restrictive group patients, while 30% (32/107) of the obstructive group patients; as previously noted obstructive lung diseases, that is, COPD was having less chance of failure with NIV use especially if applied early with stable hemodynamic and low blood respiratory acidemia.19,20 Although in restrictive pulmonary diseases (pneumonia and ILD), the rate of NIV success is low21; applying NIV in restrictive lung diseases might decrease ETI, septic shock, mortality, and hospital stay particularly when pneumonia combined with COPD22–24; this observed in our study as combined COPD and pneumonia had good chance of successful NIV.6 Interesting observed finding in our study, the association between NIV failure, and use of high EPAP level beside increase auto trigger sensitivity. This might be explained by the more hypoxemia and increase the work of breathing of those patients; which might push the attending physician to increase EPAP to improve hypoxemia and distress; and increase auto trigger sensitivity to help patients synchronize with the ventilators. Our finding dissimilar with other as previous studies did not identify significant difference in studied NIV groups regard EPAP.18,25 In other hand, it was observed in another study that EPAP level 1 hour of NIV use was higher in failed group as our finding and without predicting the failure against our result.18 The need for EPAP level more than 6 has good sensitivity and specificity to determine NIV failure; however, still more studies are needed to confirm this. We found strong association between NIV failure and ICU mortality of the studied cohort (R 0.78; P < 0.0001) and this display the burden of NIV failure on patients outcome and cost. Failed NIV cases had long stay in ICU and high mortality especially with restrictive lung diseases.17,26 It was observed in other studies that NIV failure varies from 5% to 60%; these were depended on the etiology of respiratory failure, the time of failure, and conditions of the patients.5,6,27–29 In other hand, we observed 62.7% NIV success rate most of them obstructive lung diseases; with no occurrence of mortality in the NIV successful patients till discharged from our ICU, that support the beneficial value of its use early in obstructive lung diseases and considering some cautions when assigned to restrictive lung diseases.11,30 As previously stated by Chakrabarti et al.,25 normoglycemia could be important predictor for NIV success especially if combined with heart rate and APACHE-II score; our study identified significant association between diabetic patients and admission random blood glucose level with NIV failure and mortality (R 0.213; P = 0.009) of the studied patients. Hyperglycemia was identified as worse predictor factor in ICU patients, beside glycemic control is important in improving ICU outcome.31,32 Important predictor of failure of NIV in our study is higher APACHE-II score that failed to recognize as predictor in previous studies33,34; however, other ensure its value in assessing patients before NIV use.26,27,35,36 Patients with type of 1 respiratory failure was statistically significant associated with NIV failure (R 0.230; P = 0.005). It is also observed that there were significant correlations between need for invasive ventilation and lower PaO2/FiO2 (R 0.340; P < 0.0001). These findings were noted in a study by Agarwal et al. as admission patient oxygenation could predict NIV outcome in hypoxemic respiratory failure.18 Hypoxemic respiratory failure with low oxygen level especially in pneumonias, infiltrative lung diseases, and bronchiectasis were associated with higher NIV failure in previous researches.27,36 Respiratory rate is important risk for NIV outcome and many studies determined its prognostic value; as it increases with diseases severity, it was associated with NIV failure and need for ETI and this coincide with our finding; this might be explained with high respiratory system load plus ventilator patients asynchrony.19,25,26,37 Haja Mydin etal38 identified anemia as poor prognostic factor for NIV; their finding was also observed in our analysis with high NIV failure (R 0.279; P = 0.001) and patient mortality (R 0.291; P < 0.0001) with low hemoglobin level. Considerable factor is related to NIV failure in our study; high heart rate at admission associated with NIV failure (R 0.250; P = 0.002) that might be reasoned to pathophysiological response to hypoxemia and cardiorespiratory load in severe cases. Many studies had identified increase admission heart rate as 1 important factor associated with NIV failure and should be considered seriously in patients evaluation during NIV.18,39 High WBC cell count was observed in failed NIV patients when compared with successful group; these findings may be related to high infection and toxemic burden to lung and respiratory muscle.40
Our study has some limitations as observational study, conducted to heterogeneous group of patients, and the research team did not apply specific NIV parameters and leave everything to the managing physicians according to their guideline protocol; however, we included a large cohort of patients, prospectively followed, and considering the everyday practice so it represent the actual clinical practice, the researchers team did not interfere with any clinical decision so did not have any effect that could modulate the results.
5 ConclusionsPhysician in respiratory intensive care should be cautious when applying NIV for restrictive pulmonary diseases, type 1 respiratory failure, and also patients have APACHE-II score more than 17.
References [1]. Martin TJ, Hovis JD, Costantino JP, et al. A randomized, prospective evaluation of noninvasive ventilation for acute respiratory failure. Am J Respir Crit Care Med 2000;161(3 Pt 1):807–813. PubMed PMID: 10712326. [2]. Bourke SC, Piraino T, Pisani L, Brochard L, Elliott MW. Beyond the guidelines for non-invasive ventilation in acute respiratory failure: implications for practice. Lancet Respir Med 2018;6(12):935–947. PubMed PMID: 30629932. [3]. Vitacca M, Ambrosino N, Clini E, et al. Physiological response to pressure support ventilation delivered before and after extubation in patients not capable of totally spontaneous autonomous breathing. Am J Respir Crit Care Med 2001;164(4):638–641. PubMed PMID: 11520729. [4]. Nava S, Hill N. Non-invasive ventilation in acute respiratory failure. Lancet 2009;374(9685):250–259. PubMed PMID: 19616722. Pubmed Central PMCID: 7138083. [5]. Martin-Gonzalez F, Gonzalez-Robledo J, Sanchez-Hernandez F, Moreno-Garcia MN, Barreda-Mellado I. Effectiveness and predictors of failure of noninvasive mechanical ventilation in acute respiratory failure. Med Intensiva 2016;40(1):9–17. PubMed PMID: 25759114. [6]. Nava S, Ceriana P. Causes of failure of noninvasive mechanical ventilation. Respir Care 2004;49(3):295–303. PubMed PMID: 14982651. [7]. Antonelli M, Conti G, Rocco M, et al. A comparison of noninvasive positive-pressure ventilation and conventional mechanical ventilation in patients with acute respiratory failure. N Engl J Med 1998;339(7):429–435. PubMed PMID: 9700176. [8]. Ozyilmaz E, Ugurlu AO, Nava S. Timing of noninvasive ventilation failure: causes, risk factors, and potential remedies. BMC Pulmon Med 2014;14:19. PubMed PMID: 24520952. Pubmed Central PMCID: 3925956. [9]. Chandra D, Stamm JA, Taylor B, et al. Outcomes of noninvasive ventilation for acute exacerbations of chronic obstructive pulmonary disease in the United States, 1998–2008. Am J Respir Crit Care Med 2012;185(2):152–159. PubMed PMID: 22016446. Pubmed Central PMCID: 3297087. [10]. Keenan SP, Sinuff T, Burns KE, et al. Clinical practice guidelines for the use of noninvasive positive-pressure ventilation and noninvasive continuous positive airway pressure in the acute care setting. Can Med Assoc J = journal de l’Association medicale canadienne 2011;183(3):E195–E214. PubMed PMID: 21324867. Pubmed Central PMCID: 3042478. [11]. Hess DR, Fessler HE. Respiratory controversies in the critical care setting. Should noninvasive positive-pressure ventilation be used in all forms of acute respiratory failure? Respir Care 2007;52(5):568–578. discussion 78–81. PubMed PMID: 17484789. [12]. Moretti M, Cilione C, Tampieri A, Fracchia C, Marchioni A, Nava S. Incidence and causes of non-invasive mechanical ventilation failure after initial success. Thorax 2000;55(10):819–825. PubMed PMID: 10992532. Pubmed Central PMCID: 1745609. [13]. Lin MS, Guo HR, Huang MH, Chen CR, Wu CL. Predictors of successful noninvasive ventilation treatment for patients suffering acute respiratory failure. J Chin Med Assoc 2008;71(8):392–398. PubMed PMID: 18772118. [14]. Teasdale G, Jennett B. Assessment of coma and impaired consciousness. A practical scale. Lancet 1974;2(7872):81–84. PubMed PMID: 4136544. [15]. Knaus WA, Draper EA, Wagner DP, Zimmerman JE. APACHE II: a severity of disease classification system. Crit Care Med 1985;13(10):818–829. PubMed PMID: 3928249. [16]. Vincent JL, Moreno R, Takala J, et al. The SOFA (sepsis-related organ failure assessment) score to describe organ dysfunction/failure. On behalf of the Working Group on Sepsis-Related Problems of the European Society of Intensive Care Medicine. Intensive Care Med 1996;22(7):707–710. PubMed PMID: 8844239. [17]. Demoule A, Girou E, Richard JC, Taille S, Brochard L. Benefits and risks of success or failure of noninvasive ventilation. Intensive Care Med 2006;32(11):1756–1765. PubMed PMID: 17019559. [18]. Agarwal R, Handa A, Aggarwal AN, Gupta D, Behera D. Outcomes of noninvasive ventilation in acute hypoxemic respiratory failure in a respiratory intensive care unit in north India. Respir Care 2009;54(12):1679–1687. PubMed PMID: 19961634. [19]. Confalonieri M, Garuti G, Cattaruzza MS, et al. A chart of failure risk for noninvasive ventilation in patients with COPD exacerbation. Eur Respir J 2005;25(2):348–355. PubMed PMID: 15684302. [20]. Lightowler JV, Wedzicha JA, Elliott MW, Ram FS. Non-invasive positive pressure ventilation to treat respiratory failure resulting from exacerbations of chronic obstructive pulmonary disease: cochrane systematic review and meta-analysis. BMJ 2003;326(7382):185. PubMed PMID: 12543832. Pubmed Central PMCID: 140272. [21]. Contou D, Fragnoli C, Cordoba-Izquierdo A, Boissier F, Brun-Buisson C, Thille AW. Noninvasive ventilation for acute hypercapnic respiratory failure: intubation rate in an experienced unit. Respir Care 2013;58(12):2045–2052. PubMed PMID: 23737546. [22]. Confalonieri M, Potena A, Carbone G, Porta RD, Tolley EA, Umberto Meduri G. Acute respiratory failure in patients with severe community-acquired pneumonia. A prospective randomized evaluation of noninvasive ventilation. Am J Respir Crit Care Med 1999;160(5 Pt 1):1585–1591. PubMed PMID: 10556125. [23]. Ferrer M, Esquinas A, Leon M, Gonzalez G, Alarcon A, Torres A. Noninvasive ventilation in severe hypoxemic respiratory failure: a randomized clinical trial. Am J Respir Crit Care Med 2003;168(12):1438–1444. PubMed PMID: 14500259. [24]. Navalesi P, Pollini A. Acute respiratory failure in patients with severe community-acquired pneumonia: a prospective randomized evaluation of noninvasive ventilation. Am J Respir Crit Care Med 2000;162(2 Pt 1):761–762. PubMed PMID: 10934120. [25]. Chakrabarti B, Angus RM, Agarwal S, Lane S, Calverley PM. Hyperglycaemia as a predictor of outcome during non-invasive ventilation in decompensated COPD. Thorax 2009;64(10):857–862. PubMed PMID: 19454410. [26]. Yoshida Y, Takeda S, Akada S, Hongo T, Tanaka K, Sakamoto A. Factors predicting successful noninvasive ventilation in acute lung injury. J Anesthesia 2008;22(3):201–206. PubMed PMID: 18685924. [27]. Antonelli M, Conti G, Moro ML, et al. Predictors of failure of noninvasive positive pressure ventilation in patients with acute hypoxemic respiratory failure: a multi-center study. Intensive Care Med 2001;27(11):1718–1728. PubMed PMID: 11810114. [28]. Agarwal R, Gupta R, Aggarwal AN, Gupta D. Noninvasive positive pressure ventilation in acute respiratory failure due to COPD vs other causes: effectiveness and predictors of failure in a respiratory ICU in North India. Int J Chron Obstruct Pulmon Dis 2008;3(4):737–743. PubMed PMID: 19281088. Pubmed Central PMCID: 2650588. [29]. Miller D, Fraser K, Murray I, Thain G, Currie GP. Predicting survival following non-invasive ventilation for h
留言 (0)