
記住我
Sepsis is a clinical syndrome that has physiologic, biologic, and biochemical abnormalities caused by a dysregulated inflammatory response to infection.1 This syndrome, especially in the absence of early recognition and prompt treatment, may evolve into septic shock, which is a more severe illness with a much higher mortality rate despite the broad implementation of life support measures in the intensive care unit (ICU).2
Septic shock is a subset of circulatory and cellular/metabolic abnormalities profound enough to increase mortality substantially.3,4 Patients with septic shock are almost always hypovolemic to varying extents because of redistribution of fluid from the vascular to the extravascular space owing to increased vascular permeability or due to ongoing fluid loss.5 Therefore, the initial goal-directed resuscitation for septic shock typically includes the administration of intravenous fluids and vasopressors.6
Norepinephrine (NE) is the suggested first-line treatment for hypotension in septic shock, a strong recommendation based on moderate evidence.6 Like all other vasopressors, NE can cause excessive vasoconstriction and decreased vital organ perfusion leading to ischemia that may limit its safety in septic shock patients.7 Many studies have demonstrated that combined administration of vasopressin (VP) with catecholamines potentially attenuated catecholamine associated adverse effects and decreased the needed dose of catecholamines.8,9
It was found that VP improved renal function more than NE and is recommended to reduce catecholamine dose to achieve target mean arterial blood pressure (MAP) in patients not responding to NE.6 The main concern about VP administration is related to decrease blood flow to the heart, intestine, and limbs, especially when higher catecholamine doses are used.10
Up-to-date, the effect and safety of the combination of these vasoactive medications in the treatment of septic shock were evaluated in several well-designed systematic review and meta-analyses studies but concerned on the impact on short-term mortality as a major outcome, whereas the time of recovery from septic shock and using an early fixed dose of VP in combination with NE were not thoroughly studied.11,12 Therefore, this clinical trial was conducted to compare the effect of NE alone versus early NE/VP combination on the tissue perfusion, renal function in septic shock patients, and the time of recovery from septic shock.
2 Methods 2.1 Ethical considerationsThis prospective, randomized, double-blinded clinical trial was carried out at the ICU of Ain Shams University from July 2017 to May 2019. Informed written consent for participation in the study was provided by the patients or their first-degree relatives, and ethical approval was obtained from the Faculty of Medicine Ethical Committee, Ain Shams University, Egypt (FMASU MD 239/2016). This study was registered at ClinicalTrials.gov (NCT04302584).
2.2 Sample size calculationThe sample size was calculated to be 45 cases in each group using serum lactate as a primary outcome with the proposed large effect size (0.8), alfa = 0.05, and power = 0.80. An effect size equal to 0.8 means that the mean of the primary outcome parameter in the experimental group is 0.8 standard deviations (SDs) above those in the control group.13
2.3 Eligibility criteriaWe included male and female patients aged ≥18 years, who were diagnosed as a case of septic shock within 1 hour of ICU admission by the following criteria (in the presence of documented or suspected Source of infection): Increased serum lactate concentration >2 mmol/L and persistently low MAP <65 mm Hg despite adequate fluid resuscitation, and required vasopressors to increase MAP ≥65 mm Hg.1 Vasopressor was initiated within 60 minutes of failure of adequate fluid resuscitation to maintain MAP ≥ 65 mm Hg, urine output > 0.5 mL/kg/hour, central venous pressure (CVP) between 8–12 mm Hg and 12–15 mm Hg in mechanically ventilated patients and ScvO2 ≥ 70%. Acute physiology, age, chronic health evaluation (APACHE) II score was calculated for all patients on admission.
We excluded patients with renal impairment (serum creatinine > 2 mg/dL), decompensated heart disease (ischemic/valvular), peripheral vascular disease (eg, Raynaud's phenomenon) and refusal of participation.
2.4 Randomization and interventionThis was a randomized, double-blinded clinical trial. Randomization was done using the sequentially numbered, opaque and sealed, envelopes method.14
Patients in the NE group received intravenous NE infusion starting with 0.1 mcg/kg/min. But those in VP/NE group received intravenous NE infusion starting with 0.1 mcg/kg/min, in addition to VP infusion at a fixed rate of 0.03 IU/min and initiated at the same time with NE infusion. NE dose was adjusted to keep MAP ≥ 65 mm Hg.
Ultrasound guided central venous catheter (CVC) was inserted once the diagnosis of septic shock was confirmed. Chest x-ray was done following CVC insertion to ensure placement of the catheter tip in SVC junction with right atrium.
All patients received standard therapy for septic shock and standard of care in the ICU according to Surviving Sepsis Campaign Recommendations 2018 Updates15 until improvement and discharge from ICU or death. The treatment included drainage of the infected site, proper antibiotics according to culture and sensitivity, intravenous crystalloids to keep CVP between pressure between 8–12 mm Hg and 12–15 mm Hg in mechanically ventilated patients, and blood transfusion to keep hemoglobin above 7 gm/dL.
2.5 Outcome measuresBoth groups were assessed for 48 hours regarding tissue perfusion through the evaluation of serum lactate level as a primary outcome and central venous oxygen saturation (ScvO2%), using an internal jugular or subclavian vein, hemodynamics (heart rate and MAP by radial arterial line), sepsis biomarkers (C-reactive protein [CRP] mg/L) and white blood cell count 109/L), renal biomarkers (urea, creatinine, and urinary neutrophil gelatinase-associated lipocalin (NGAL ng/mL) that was measured by ELISA technique using R&D SYSTEM-UK), besides NE dose at 6 and 48 hours, the length of ICU stay, the need for mechanical ventilation (MV) and renal replacement therapy (RRT) and the incidence of 28 days mortality as secondary outcomes. The assessment was done at baseline, then every 6 hours for 48 hours as regards hemodynamics, serum lactate level, and central venous oxygen saturation (ScvO2), and at baseline, at 24 hours, and 48 hours as regards sepsis and renal biomarkers.
2.6 Statistical analysisIBM SPSS 26 (version 26.0, IBM Corp, New York, NY, 2019) was used for data analysis. Data were expressed as Mean ± SD for quantitative parametric measures in addition to median and percentiles for quantitative non-parametric measures and both number and percentage for categorized data.
The following tests were done:
1. Comparison between two independent mean groups for parametric data using Student t test. 2. Comparison between two independent groups for non-parametric data using Wilcoxon Rank Sum test. 3. Chi-square test to study the association between each 2 variables or comparison between 2 independent groups as regards the categorized data.The probability of error at .05 was considered significant, whereas at .01 and .001 are highly significant.
3 ResultsThis study included 90 patients who were randomly assigned into two equal groups (allocation ratio is 1:1), with 45 patients in each group (Fig. 1). Patients had been recruited from July 2017 to May 2019. Each patient was followed up for 48 hours.
 Figure 1:
 Trial flow diagram.
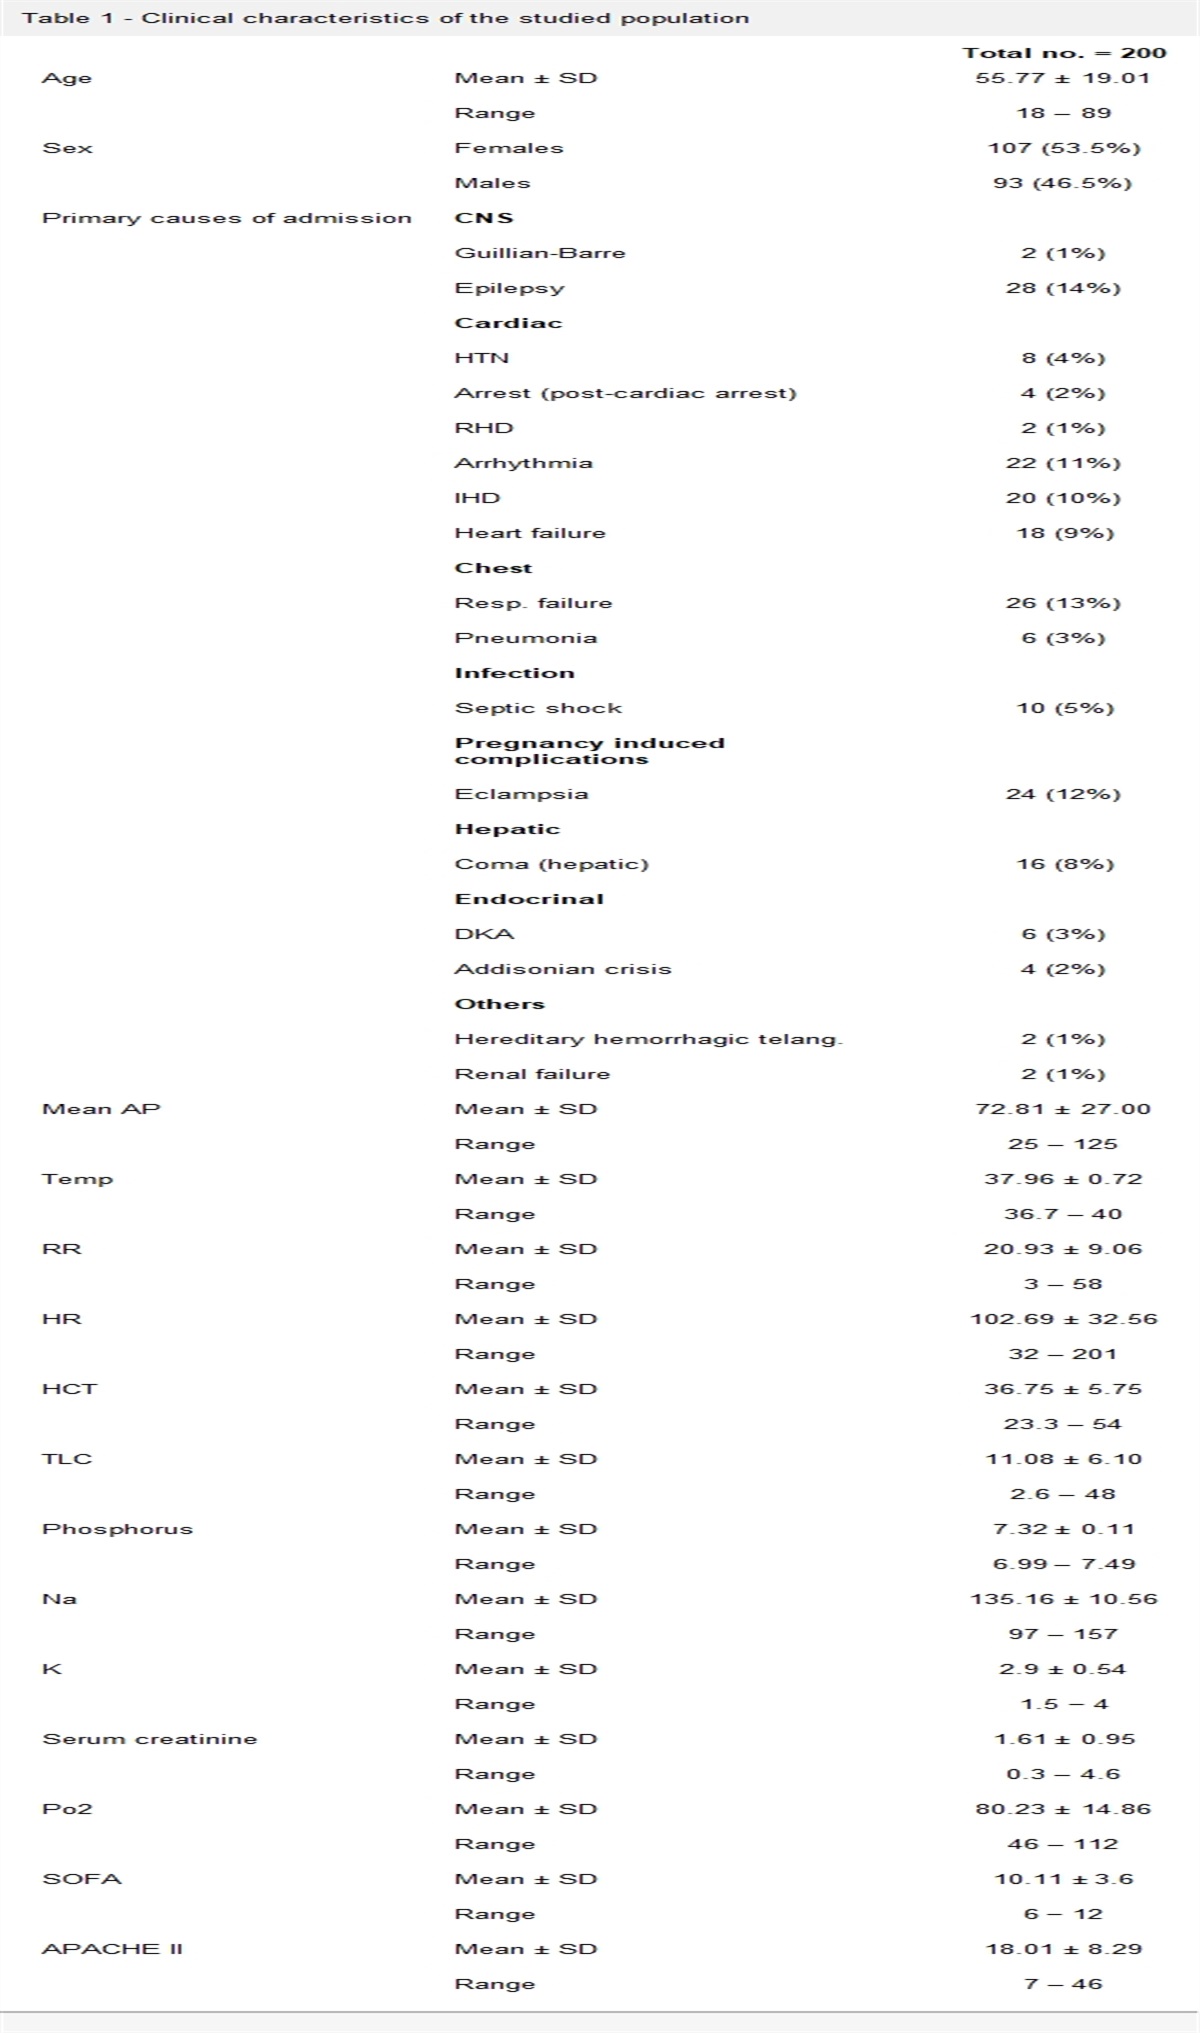
There were no significant differences between the studied groups regarding the patients’ demographics, APACHE II score, BMI, and the number of diabetic or hypertensive patients (Table 1).
Table 1 - Demographic data NE group VP/NE group Total Tests N % N % N % X 2 or t P Gender Male 24 53.3 27 60.0 51 56.7 0.407 .523 Female 21 46.7 18 40.0 39 43.3 Age (y) Range 32–80 36–92 32–92 0.276 .783 Mean±SD 59.73 ± 10.49 60.33 ± 10.14 60.03 ± 10.26 APACHE II Range 10–33 11–38 10–38 –0.142 .887 Mean±SD 19.76 ± 6.00 19.58 ± 5.99 19.67 ± 5.97 BMI Range 22–31 22–31 22–31 0.575 .566 Mean±SD 24.40 ± 2.3 24.20 ± 2.5 24.30 ± 2.4 Diabetic patients (no/%) 26 (57.8) 25 (55.6) 51 (56.7) 0.045 .832 Hypertensive patients (no/%) 19 (42.2) 20 (44.4) 39 (43.3) 0.044 .834APACHE II, Acute Physiology, Age, Chronic Health Evaluation II; BMI: body mass index; NE, norepinephrine; SD, standard deviation; VP/NE, norepinephrine/vasopressin.
Pathogen types were Gram-positive alone 29 (32.2%), Gram-negative alone 17 (19%), Mixed organisms 13 (14.4%), others 20 (22.2%), and no pathogen 11 (12.2%). The Source of infection was suspected or confirmed by culture (Fig. 2).
 Figure 2:
 Source of infection. CAP, community-acquired pneumonia; CLABSI, central line-associated bloodstream infection; VAP, ventilator-associated pneumonia.
Serum lactate was significantly higher in the NE group at 6, 12, 18, and 48 hours (P values: <.001, <.001, .007, and .005, respectively) compared to VP/NE group (Fig. 3). Central venous oxygen saturation was significantly lower in NE group only at 48 hours compared to VP/NE group (P value: .018) (Table 2).
 Figure 3:
 Serum lactate. NE: norepinephrine; VP/NE: norepinephrine/vasopressin.
Table 2 - Central venous oxygen saturation NE group VP/NE group t test Mean ± SD Mean ± SD t P Central venous oxygen saturation (%) Baseline 59.0 ± 4.451 57.6 ± 4.942 1.4121 .322 6 h 62.4 ± 3.639 61.27 ± 4.261 1.357 .178 12 h 65.42 ± 3.539 65.38 ± 3.749 0.058 .954 18 h 66.71 ± 3.597 67.09 ± 3.965 –0.473 .637 24 h 67.18 ± 5.28 68.31 ± 3.959 –1.152 .253 30 h 69.33 ± 3.885 68.93 ± 3.018 0.545 .587 36 h 69.33 ± 4.205 70.31 ± 2.636 –1.322 .19 42 h 70.09 ± 3.253 70.47 ± 3.307 –0.546 .586 48 h 69.83 ± 3.664 70.53 ± 3.402 –2.415 .018∗NE, norepinephrine; SD, standard deviation; VP/NE, norepinephrine/vasopressin.
∗Significant at P < .05.
The heart rate was significantly higher in the NE group at 12, 18, 24, 30, 36, 42, and 48 hours (P values: .01, .004, .004, <.001, <.001, .002, and .008, respectively). The MAP was significantly higher in VP/NE group at 12, 18, 24, and 36 hours (P values: <.001, .008, <.001, and .039, respectively) (Fig. 4). Regarding the NE dose, both groups received intravenous NE infusion starting with 0.1 mcg/kg/min. The mean NE dose (mcg/kg/minute) was significantly higher in NE group than VP/NE group at 6 hours (0.61 ± 0.21 and 0.25 ± 0.20, respectively, P < .001) and also at 48 hours (0.35 ± 0.32 and 0.19 ± 0.38, respectively, P = .038).
 Figure 4:
 Hemodynamic parameters. HR, heart rate; MAP, mean arterial blood pressure; NE, norepinephrine; SD, standard deviation.
There was no significant difference (P > .05) between both groups regarding sepsis biomarkers (white cell count and CRP) (Table 3). Urea, creatinine, and NGAL levels were significantly higher in NE group compared to VP/NE group at 24 and 48 hours (0.007 and 0.012, 0.025 and 0.002, and 0.031 and 0.047, respectively) (Table 4).
NE group VP/NE group t test Mean ± SD Mean ± SD t P White blood cells (109/L) Baseline 22.24 ± 6.24 21.69 ± 6.01 0.430 .668 24 h 19.60 ± 5.65 20.38 ± 4.40 0.728 .468 48 h 16.33 ± 4.30 16.96 ± 3.77 0.730 .468 C-reactive protein (mg/L) Baseline 27.18 ± 6.72 25.24 ± 8.09 1.237 .219 24 h 21.42 ± 6.10 19.53 ± 7.58 1.302 .196 48 h 13.31 ± 4.58 13.22 ± 5.76 0.081 .936NE, norepinephrine; SD, standard deviation; VP/NE, norepinephrine/vasopressin.
NE, norepinephrine; NGAL, neutrophil gelatinase associated lipocalin; SD, standard deviation; VP/NE, norepinephrine/vasopressin.
∗Significant at P < .05.
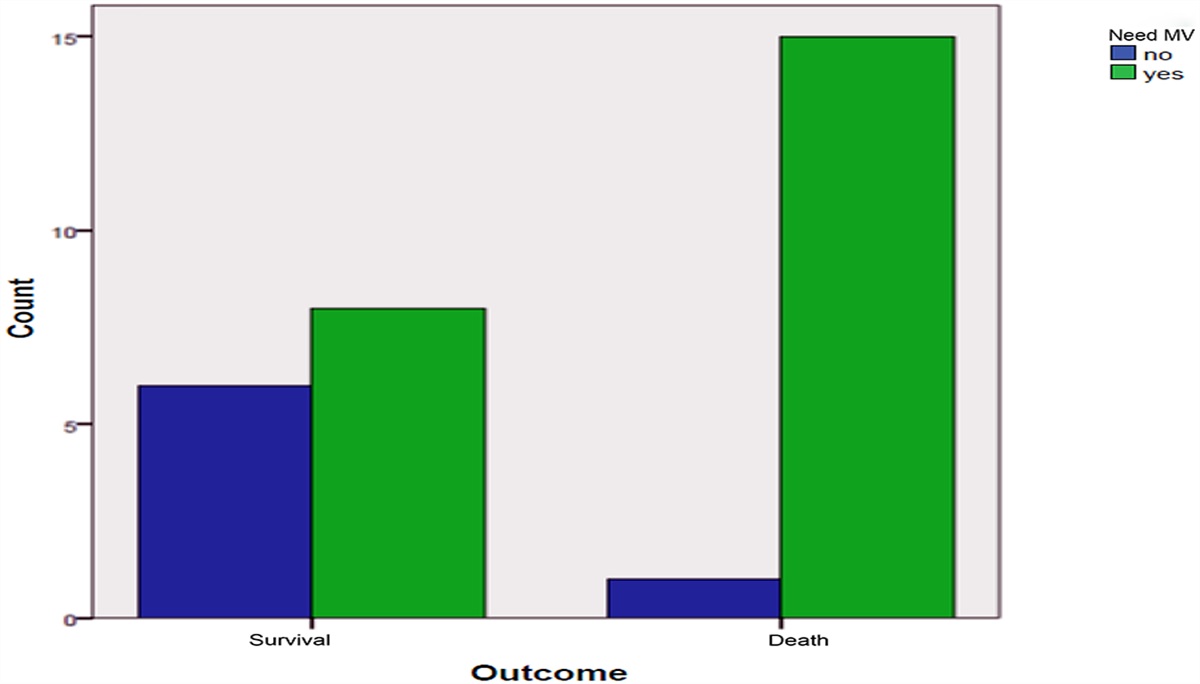
The need for MV was slightly higher in NE group compared to the VP/NE group, though the difference did not reach statistical significance (31.1% versus 17.8%, P = .141). A significantly higher percentage of patients in the NE group required RRT than those in the VP/NE group (20% versus 4.4%, P = .024).
The mean duration of ICU stay was significantly lower in VP/NE group than the NE group (P < .001), whereas there were no significant differences between both groups as regards 28 days of mortality (P = .581) (Table 5). Thirty-nine (86.7%) patients in the NE group continued with the studied drugs combination after 48 hours versus 22 (48.9%) in NE/VP group (P < .001).
Table 5 - Comparison of need for MV, RRT, mortality, and ICU stay in both groups Groups Tests NE group VP/NE group Total X 2 or t test P Need for MV No N 31 37 68 2.166 .141 % 68.9 82.2 75.6 Yes N 14 8 22 % 31.1 17.8 24.4 Need for RRT No N 36 43 79 5.075 .024∗ % 80.0 95.6 87.8 Yes N 9 2 11 % 20.0 4.4 12.2 Mortality No N 36 38 74 0.304 .581 % 80.0 84.4 82.2 Yes N 9 7 16 % 36 38 74 ICU stay (days) Range 4.0–18.0 3.0–17.0 3.0–18.0 4.077 <.001∗ Mean ± SD 11.1 ± 3.5 8.2 ± 3.2 9.7 ± 3.6ICU, intensive care unit; MV, mechanical ventilation; NE, norepinephrine; RRT, renal replacement therapy; SD, standard deviation; VP/NE, norepinephrine/vasopressin.
∗Significant at P < .05.
Multivariate logistic regression analyses showed that both HR-36 hours and NGAL.48 hours are the most sensitive independent variables that affected or decreased by VP (F-ratio = 102.3, P < .001) (Table 6).
Table 6 - Multivariate logistic regression analyses to identify parameters significantly affected by vasopressin Regression coefficient t P F-ratio P Constant 6.258 12.337 <.001 HR 36h –0.024 –4.205 <.001 NGAL 48h –0.015 –11.705 <.001 102.335 <.001HR, heart rate; NGAL, neutrophil gelatinase associated lipocalin.∗Significant at P < .05.
The current trial compared the effect of NE versus a combination of NE and VP on tissue perfusion and renal function in the management of septic shock.
Concerning tissue perfusion parameters, serum lactate level was significantly higher in the NE group compared to VP/NE group. These results are comparable with an earlier trial16 on septic shock patients treated with VP, NE, and combined VP and NE, where serum lactate levels decreased significantly in the patients who received the combined treatment. This was attributed to the increased MAP and improved tissue perfusion caused by VP. In contrast, other researchers17,18 found no significant differences between NE and VP groups regarding serum lactate levels, which could be attributed to the small sample size of these studies. Wu et al.19 reported that patients who received NE and VP had significantly higher lactate levels compared with patients who only received NE. They attributed this to mesenteric, myocardial, and digital ischemia caused by VP.
Central venous oxygen saturation in the current study was significantly higher in VP/NE group only at 48 hours. In contrast, Sharma et al.20 and Xiao et al.21 detected a significant increase in SvO2 at different time points (by the end of the 24 hours study period and after 6 hours treatment, respectively). They attributed this to increased tissue perfusion after stabilization of the patients’ hemodynamics. Although Sacha et al.22 and Gordon et al.17 did not find any difference in venous oxygen saturation between NE group and VP Group at any time point of their studies.
The study showed that the heart rate was significantly reduced in the VP/NE group compared to the NE group. This coincides with earlier studies16,17 that showed a rapid and significant drop-in heart rate after starting VP infusion. Moreover, Russell et al. in a study on 778 septic shock patients found that heart rate was significantly lower in the VP group than in the NE group during the first 4 days of treatment, and they attributed this to NE, as it has both α and β adrenoreceptor effects that may increase heart rate and cause arrhythmias.23 VP infusion is cardioprotective in models of myocardial ischemia and patients with post-cardiotomy shock.24
In this study, the MAP was significantly higher in VP/NE group compared to the NE group at 12, 18, 24, and 36 hours from starting the study. This is in line with Sharma and colleagues,20 who showed a significant increase in systolic blood pressure and MAP after 4 hours of initiation of VP infusion. Moreover, Barzegar et al.18 found that patients in the VP group had significantly higher systolic blood pressure and MAP compared to the NE group during the first 24 hours. The effect of VP could explain this inactivation of V1a receptors on vascular smooth muscles, which induces vasoconstriction.8
In the current study, 23 (51.1%) patients in the NE/VP group versus only 6 (13.3%) patients in the NE group recovered from sepsis before 48 hours (P < .001).
The current study found no significant differences in CRP levels between both groups. These results agreed with Barzegar et al.18 who found that CRP was not significantly different between patients who received NE and those who received a combination of NE and VP.
In this study, renal biomarkers were significantly lower in the VP/NE group compared to the NE group. Comparable results were reported by Gordon and colleagues.
留言 (0)