Patient samples
Hospital sampling was performed from 28 ovarian cancer patients from mid-2020 until mid-2021. Samples were collected according to the declaration of Helsinki. All patients signed informed consent prior to samples’ collection. The study was approved by the Research Ethics Committee of the Northern Savo Hospital District (approval number 350/2020).
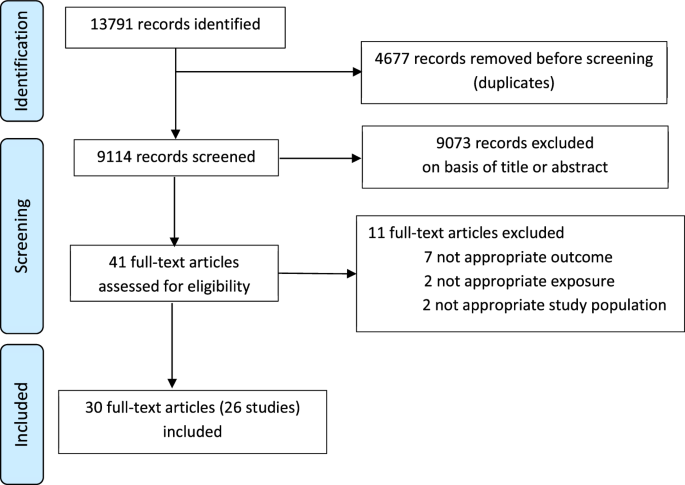
Ovarian tumor samples were dissected from primary ovary tumors (pelvic location) and metastatic nodes which were spread through the abdomen (omental and splenic locations). Fatty, necrotic, and bloody areas were removed and the remaining, cleaned tissues snap-frozen in liquid nitrogen prior to HLA-bound peptide enrichment. A second, pathologically similar portion of the same tumor specimen was stored in RNAprotect Tissue Reagent (Qiagen, # 76106) prior to RNA extraction. Although 28 subjects were enrolled in the clinical study, only eleven were given HGSC diagnoses, had sufficient metastatic omental tissues collected and could be included in further analysis (Supplementary Table 1).
Purification of HLA class-I complexes
HLA-I –peptide complexes were immunoaffinity purified from ovarian tumor samples using HLA-I antibody (anti-human HLA-A, HLA-B, HLA-C, clone W6/32, InVivoMab) via the method described by Bassani-Sternberg47 with minor modifications. Frozen tumor tissue was cut into 1 × 1–3 × 3 mm3 fragments and further mechanically dissociated using a gentleMACS™ Dissociator (without any enzymatic treatment). Dissociated tissue was lysed with 0.25% sodium deoxycholate, 0.2 mM iodoacetamide, 1 mM EDTA, 1 mM PMSF (phenylmethylsulfonyl fluoride), and 1% octyl-β-D glucopyranoside in the presence of protease inhibitors in PBS at 4 °C for 2 h. The lysate was precleared (2000 × g, 5 min at 4 °C) and cleared by centrifugation at 20,000 × g, 30 min at 4 °C prior to loading to the immunoaffinity column (AminoLink, Pierce) with covalently linked antibody. Following binding (o/n at 4 °C) the affinity column was washed using 10 column volumes of each buffer (150 mM NaCl, 20 mM Tris-HCl; 400 mM NaCl, 20 mM Tris-HCl; 150 mM NaCl, 20 mM Tris-HCl and 20 mM TrisHCl, pH 8.0) and bound complexes were eluted in 10% acetic acid.
Eluted peptide-HLA-I complexes were desalted using SepPak-C18 cartridges (Waters). The cartridge was prewashed with 80% acetonitrile in 0.1% trifluoro acetic acid (TFA) and with 0.1% TFA prior to loading of the samples. Samples were washed with 0.1% TFA and peptides were eluted and in 30% acetonitrile in 0.1% TFA prior to drying using vacuum centrifugation (Eppendorf).
LC-MS/MS analysis of HLA-I peptides and proteomics database search
LC-MS/MS and peptide identification were performed on a fee-for-service basis by the CIC bioGune in Bilbao, Spain.
Samples (200 ng) were loaded in a timsTOF Pro with PASEF (Bruker Daltonics) coupled online to either an Evosep ONE (Evosep) or a NanoElute (Bruker) liquid chromatograph. The 30 samples-per-day protocol (44-min gradients) was used with the Evosep ONE, whereas a custom 30-min gradient was used for the NanoElute runs. The runs were performed for each of the samples: (1) a preliminary load of 1/20 of the sample in order to check sample load, (2) an adjusted sample load where only z = 1 ions are analyzed, and (3) an adjusted sample load where z > 1 ions are analyzed. Protein identification and quantification was carried out using the PEAKS X software (Bioinformatics solutions). All three loads for each sample were summed and considered as a single sample. Searches were carried out against a database consisting of Homo sapiens (Uniprot/Swissprot) or a multi-sample, merged Stringtie-generated Expressed Sequence Tag (EST) ad hoc database (described more in depth later), with precursor and fragment tolerances of 20 parts per million (ppm) and 0.05 Da respectively. HLA class I-presented peptides with a mass range between 400 and 650 m/z, and with charge states <4+ were considered for further analysis in line with what has been done elsewere48,49,50.
Total RNA extraction, RNA sequencing and comparative analysis with GTEX and TCGA database
As previously mentioned, the tumor specimen’s portion to be dedicated to RNA-seq was stored in tumor specimen was stored in RNAprotect Tissue Reagent (Qiagen, # 76106) prior RNA extraction. Total RNA was extracted from ~30 mg of patient tumor tissues by RNAeasy Protect Cell Mini Kit (Qiagen, # 74624) according to the manufacturer’s instruction. RNA sequencing was performed by Eurofins Genomics to a minimum depth of 30 M reads on Illumina NovaSeq 6000 instrument with 2x150bp paired-end, strand-specific sequencing procedure. Raw data from healthy omentum, and metastatic omentum were analyzed for using UCSC Toil RSEM gene expression pipeline (hg38, gencode v23)17, and merged with the GTEx (Genotype-Tissue Expression), TARGET, and TCGA (The Cancer Genome Atlas) Toil Recompute archive [github, link]. This particular pipeline and reference pairing was selected in order to maintain bioinformatic methods comparability between the new clinical samples and the well-known healthy-tissue efforts available in public databases.
RNA-sequencing of ovarian tumor tissues and AS identification
Each patient’s transcriptome was processed separately, and subsequently merged into a “pan-transcriptome” using Stringtie in “—merge” mode. The pan-transcriptome’s splice junctions were annotated by merging with their overlapping canonical isoforms (Gencode v23) using the “gffread” utility, and repeats were masked using “gffcompare”. For compatibility with the MS spectral identification program (PEAKS X), as reported in the software's user manual (Section 6.1), splice junctions were converted into mature transcripts in EST format, using the gffread, ‘-w’ flag from the hg38 reference genome coordinates.
To maintain congruent comparisons, Stringtie was not run using a HISAT2 re-alignment (per best practices), but rather run using the same aligned reads matrix from above (“Total RNA extraction, RNA sequencing and comparative analysis with GTEX and TCGA database”).
HLA-typing
HLA typing was inferred from RNA-Seq data using the ArcasHLA pipeline51. The ArcasHLA suite contains an explicit nucleotide sequence database which was constructed from the implicit HLA allele differences as described by The International ImMunoGeneTics database (IMGT) consortium. ArcasHLA performs typing inference by extracting aligned reads from chromosome 6 and then uses the Kallisto pseudoaligner to rapidly bin reads against each reference sequence. The sequence, or pair of sequences which matches the most reads is inferred to be the correct set.
A handful of subjects had multiple sequenced biological specimens. Specimens were typed independently and the few conflicts that were observed were resolved in favor of the type for which binding affinity data was available in MHCFlurry.
Because our peptide immunoaffinity methods only targeted class-I HLA molecules, only class I matches were retained.
European ancestry was selected as a prior expectation for the purposes of identifying rare alleles.
To further maintain congruent comparisons, ArcasHLA was run on the same aligned reads matrix from above (“Total RNA extraction, RNA sequencing and comparative analysis with GTEX and TCGA database”). The table of patients’ HLA-typing is showed in Supplementary Table 2.
RNA-seq differential expression
RSEM values were imported from either the Xena precalculated RSEM isoform values, or from the Toil pipeline “rsem_isoforms.results” files. Transcript-specific counts were imported by the “tximport” function in “scaledTPM” mode. Counts were normalized by DESeq2 for differences in sequencing effort. PCA biplots were created from the variance-stabilized values. Differential expression was calculated using DESeq2 between the 11 new tumor samples and the GTEX healthy ovarian tissue.
Shrunken Log2-fold changes were calculated using the “apeglm” model using an expected “lfcThreshold” value of 1. Genes were considered differentially expressed if their shrunken log-fold change was greater than 1, their base-mean values were greater than 40.
Peptide overlap calculation
Pairwise overall overlap was recursively calculated as the number of peptides common to both sets (i.e., the intersection) divided by the total number of unique peptides identified in either set (i.e., the union).
On the other hand, left overlap was recursively calculated as the number of peptides common to both sets divided by the total number of peptides in one of the two sets being compared.
Class I MHC binding affinity prediction
Peptides derived from MS were filtered for those which were 8–15 amino acid residues in length. Each peptide MHC specificity was annotated using a predicted class I MHC binding affinity (nM), presentation probability score, and processing probability score as calculated by MHCflurry16.
HEX ranking
Putative neo-antigens between 8 and 12 amino acid residues in length were ranked using the HEX pipeline. HEX is a proprietary solution owned by Helsinki University which depends on a neural network to rank binding affinity (NetMHCpan 4.1b52), and uses a proprietary custom position-specific weight-matrix (PWM) to assess a peptide’s similarity to pathogens which humans have immuno-historically encountered.
The binding domain of the HLA molecule is approximately 9 residues in width, and therefore we chose to assess viral similarity with strong preference towards the central portion. This algorithmic weighting is achieved using HEX’s custom PWM.
HEX also includes a preformatted pathogen database which provides the “hit” sequences against which putative neoantigens are compared. HEX uses the NCBI BLASTp to perform this search. Although the HEX database can be easily substituted to support other pathogens, this work uses only the 17705-record Uniprot “Viruses [10239]” database by default. Candidate peptides are matched with potential viral orthologs by BLASTp (BLOSUM62)53, and then further refined by pairwise positional-weighted alignment using PMBEC54. Peptides with any viral ortholog then have their binding affinity predicted by NetMHCpan for each supplied HLA allele. Peptide specificity was considered as the highest binding affinity for a given MHC. Finally, an aggregate score is calculated to rank the predicted probability of a peptide for eliciting an immune response in the originating subject. When comparing tumor- and virus-derived pair of peptides the average of the binding affinity was computed for display, and pair of peptides were considered good candidates only when IC50 for both tumor and viral peptides was below 500 nM. The specific mathematics of the HEX viral similarity assessment are detailed briefly as follows. Similarity to viral sequences was further refined by pairwise positional-weighted alignment using PMBEC (link below) substitution matrix favoring the similarity in the central portion of the peptides as follows.
$$final\,similarity\,score=\mathrm+\mathrm$$
(1)
Where :
$$}=\mathop\limits_^\left(_\times 2\right)$$
(2)
Final similarity score was normalized according to the following formula:
$$normalized\,similarity\,score=\frac}$$
(4)
Where “a” is the similarity score calculated between each tumor and its cognate viral peptide, “b” and “c” are the similarity scores calculated by self-aligning the tumor peptide and the viral peptide respectively.
Epitope selection for immunological analysis
Identified peptides eluted from ovarian cancer specimens were searched into the HLA Ligand Atlas database19 which is the gold standard repository for ligand peptides commonly expressed in healthy tissues. Peptides identified in the HLA Ligand Atlas were considered to have lower chances to be immunogenic as they were presented in healthy tissues and probably covered by central tolerance.
Additionally, peptides were searched within the IEDB T Cell database55. Presence of a given peptide in this database was only used to gather information about its prior investigations. The database can be obtained at the following link.
Identified peptides MHC allele-specificity information were further annotated with the seroprevalence data available for the US and European population using information provided by the Allele Frequency Net Database (AFND) available at allelefrequencies.net18. Annotations were made using the “USA NMDP European Caucasian” (n = 1,242,890) dataset as retrieved in December 2020. Before adding the information to the peptide results, HLA types were filtered to only those with a population frequency greater than 1 in 100. Peptides with higher allele seroprevalence were favored over others specific to more rare alleles. When peptides presented multiple specificities, cumulative sum of the specific alleles’ frequencies were used.
PBMCs purification
Ten to thirty mL of blood was collected from patients immediately prior to the surgical tumor resection in heparin salts coated tubes. PBMC were purified using Leucosep™ tubes according to manufacturer’s instruction. PBMCs were then counted and cryopreserved in Human AB serum (Sigma) 10% DMSO (Sigma).
Healthy donors PBMCs
Healthy donors PBMCs were purchased from CTL (Bonn, Germany). The subjects were selected based on their HLA types to optimize the peptide immunogenicity testing.
Peptide synthesis
Selected peptides to be tested for immunogenicity (listed in Table 1) were synthetized by Genscript (Netherlands) at 4 mg, 90% purity.
IFN-γ ELISpot assay
T cell epitope-specific activation was detected using commercially available IFN-γ ELISpot reagents (ImmunoSpot, Bonn, Germany), accordingly to the manufacturer’s instructions. According to their HLA haplotype, each subject was tested only for the peptides that had corresponding HLA specificity. Each subject’s PBMCs were seeded at the maximum density possible (depending on the number of stimuli) but always below 600 K cells/well. Seeded PBMCs were stimulated in vitro with 2 ug/well of each peptide at 37 °C for 72 h. After 3 days of stimulation, the number of cytokine-producing, antigen-specific T cells was evaluated using an ELISpot reader system (ImmunoSpot) and all the spots’ counts were normalized for 1 × 10⁶ seeded PBMCs. A response was deemed positive if the IFNγ ELISpot count exceeded a minimum threshold of 23.3 spots per 1*106 PBMCs as shown elsewhere12.


Comments (0)