2.1 Database analysis
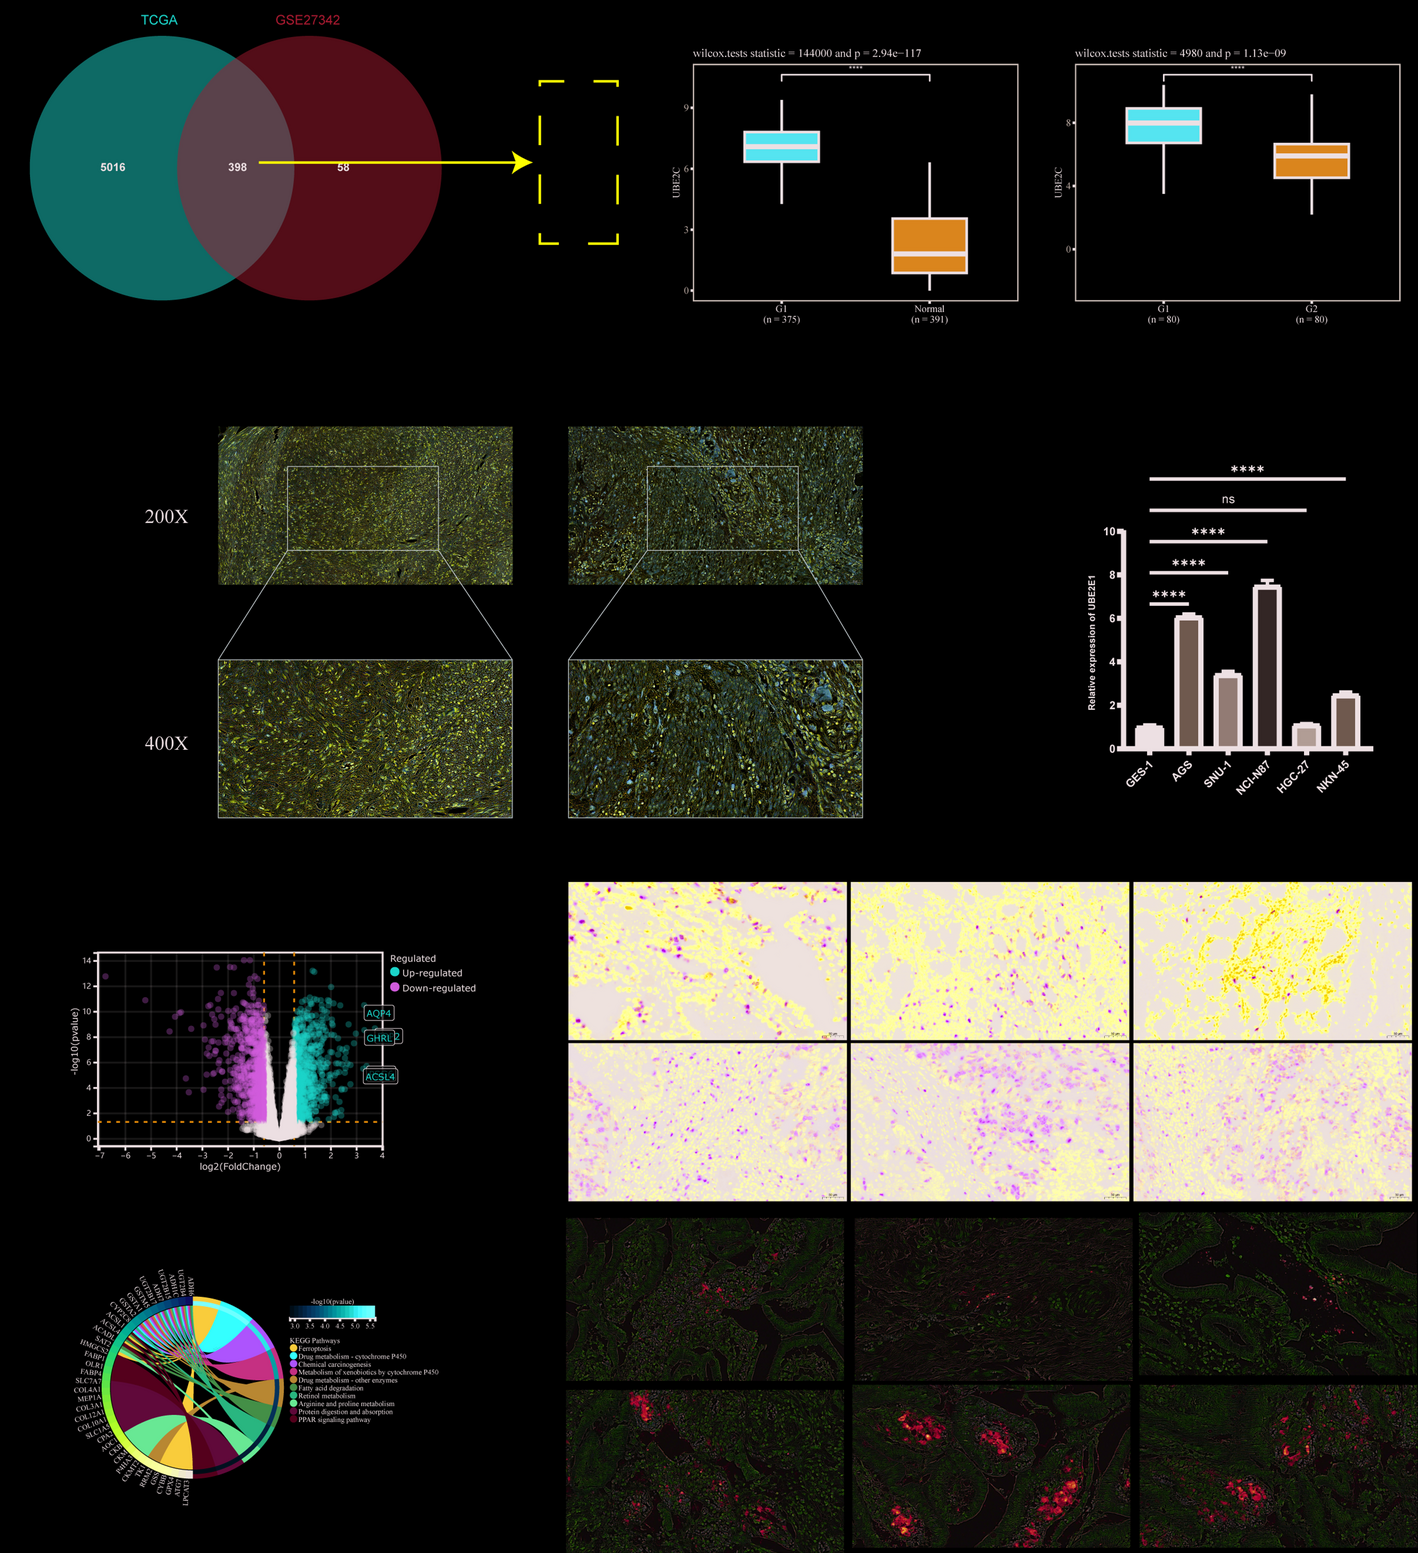
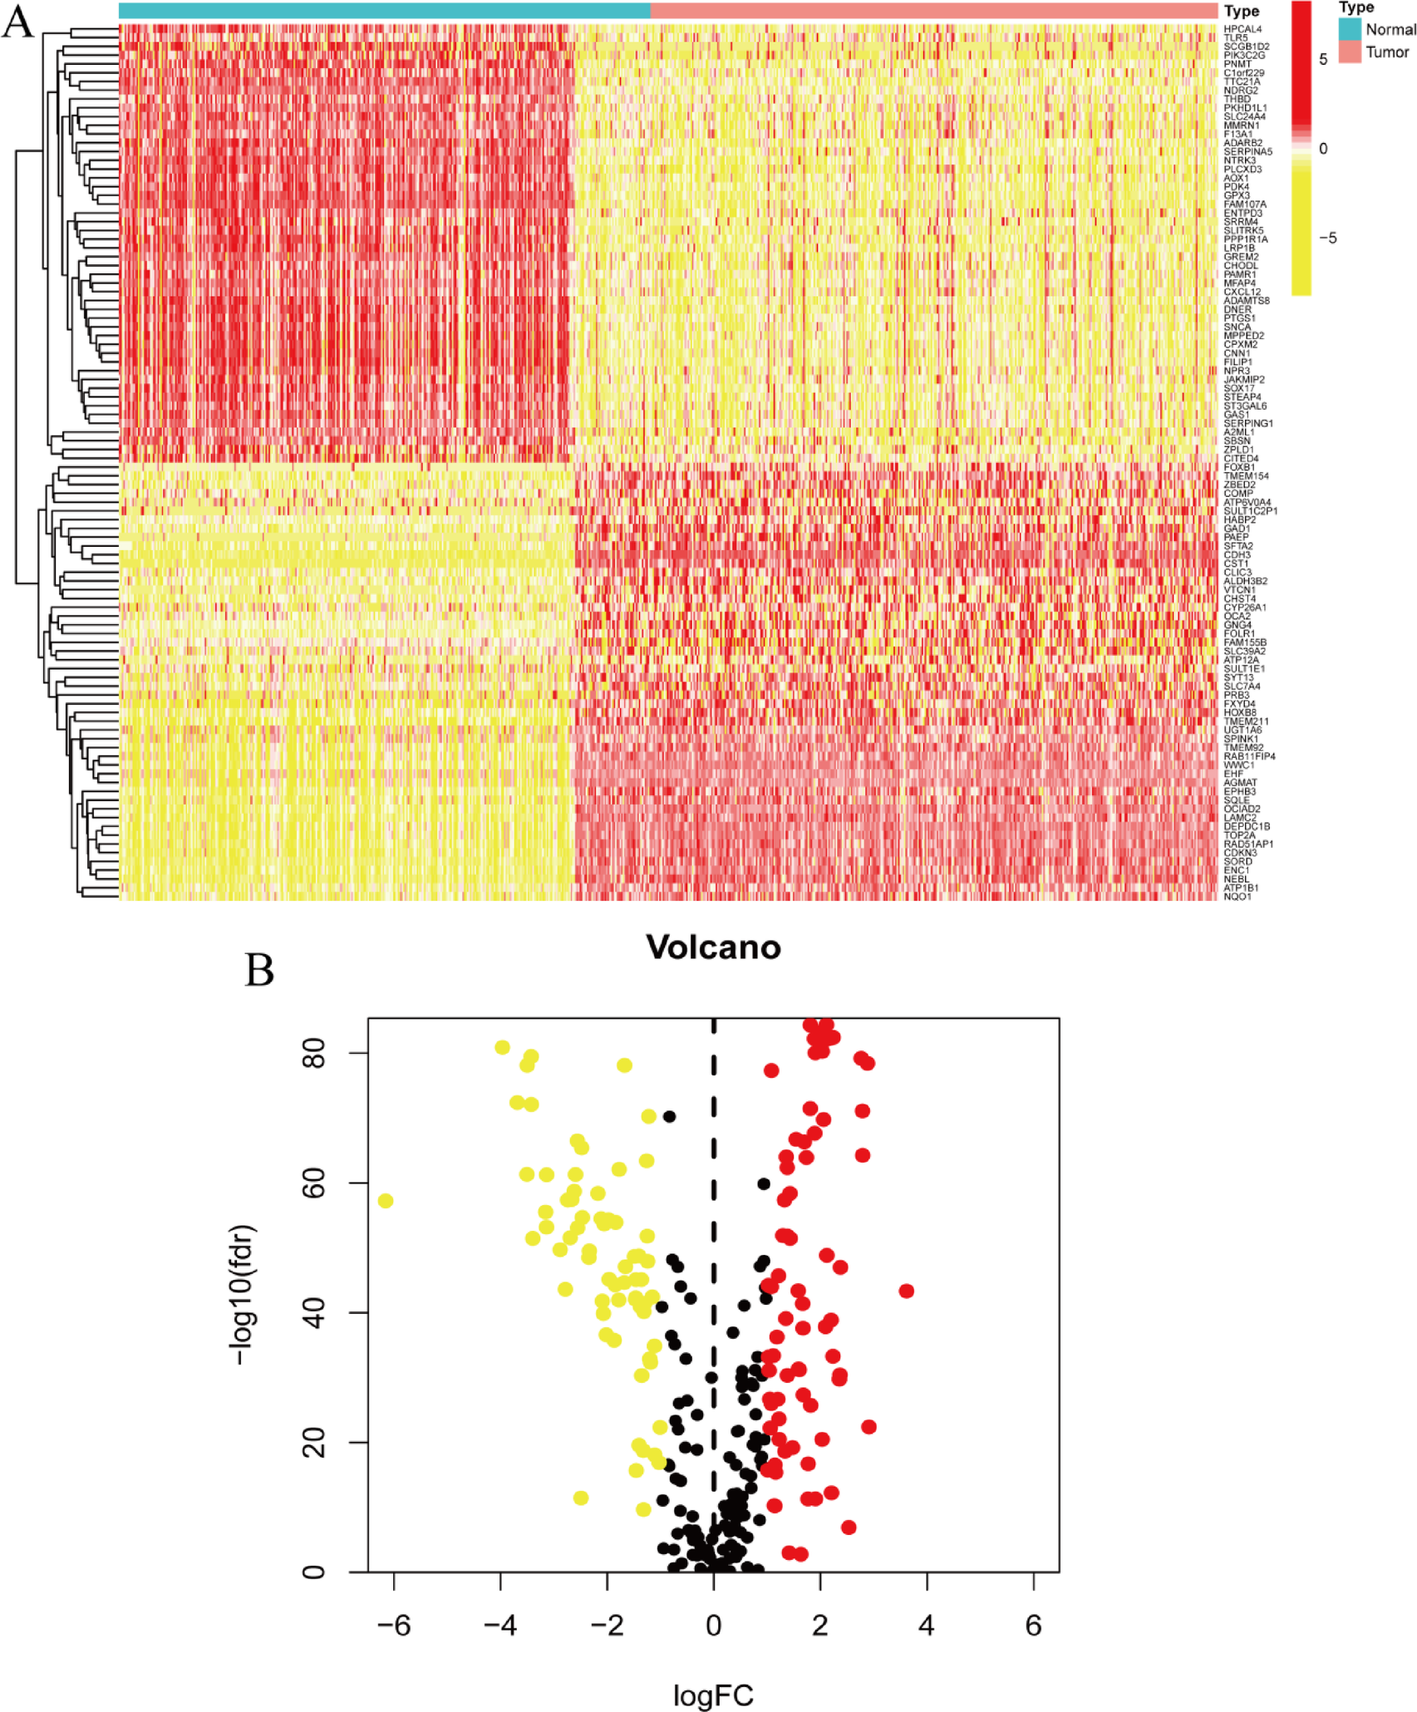
The TCGA dataset included 375 gastric cancer and 391 normal tissue samples, while the GSE27342 dataset contained 80 gastric cancer and 80 matched non-tumor samples. Differential mRNA expression was analyzed using the Limma package (version 3.40.2), and the Benjamini-Hochberg method was applied to adjust p-values for multiple comparisons [10]., with adjusted p-values used to minimize false positives. A threshold of adjusted p-value < 0.05 and log2 fold change > 1 or < −1 was applied to define significant mRNA differential expression. Gene Ontology (GO) and KEGG pathway enrichment analyses were conducted using the ClusterProfiler package in R [11]. The ggplot2 package was used to visualize the differential expression of genes, with statistical significance considered when p-values were < 0.05 [12].
2.2 Immunohistochemistry (IHC)
Tumor sections were subjected to standard deparaffinization, rehydration, and antigen retrieval procedures. Immunostaining was performed using Histostain™-Plus Kits (Bioss, SP-0022). Following blocking, sections were incubated overnight at 4 °C with a primary antibody targeting UBE2C (Abcam, ab252940) at a dilution of 1:500. Subsequently, sections were incubated with HRP-conjugated secondary antibodies for 1 h at room temperature and developed using DAB. Hematoxylin was used for nuclear counterstaining.
2.3 Prussian blue staining
Iron deposition was detected using the Prussian Blue Iron Stain Kit (YEASEN, 60533ES20), following the manufacturer’s instructions. Briefly, paraffin-embedded tissue sections underwent standard deparaffinization and rehydration procedures as described in the IHC method. Sections were then incubated with an equal-volume mixture of 2% potassium ferrocyanide and 2% hydrochloric acid for 30 min, followed by thorough washing with distilled water.
2.4 ROS detection
ROS generation was assessed using a standard ROS detection kit (Biyuntian, S0033M). Gastric cancer cells were treated with DCFH-DA at a concentration of 10 µM for 20 min at 37 °C, followed by PBS washing to remove unabsorbed DCFH-DA. ROS levels were quantified by fluorescence microscopy or flow cytometry (488 nm excitation and 525 nm emission).
2.5 Cell culture and transfection
Human gastric cancer cell lines AGS, SNU-1, NCI-N87, HGC-27, and MKN-45, as well as the gastric epithelial cell line GES-1, were purchased from Procell (China) and cultured in DMEM supplemented with 10% FBS, 100 units/mL penicillin, and 100 µg/mL streptomycin. Cells were maintained at 37 °C in a humidified atmosphere with 5% CO2. For overexpression experiments, plasmids for Myc-tagged ACSL4 and Flag-UBE2C were transfected into cells using Lipofectamine 2000 (Invitrogen), following the manufacturer’s instructions. After 24 h, cells were treated with 50 µg/ml cycloheximide (CHX, Sigma-Aldrich) for the indicated time points, followed by lysis for Western blot analysis. Transfection efficiency was verified by Western blotting at 48 h post-transfection.
2.6 ShRNA and SiRNA construction and transfection
Lentiviral shRNAs targeting UBE2C and a negative control (shNC) were obtained from GenePharma (Shanghai, China). Lentiviral particles were prepared using a standard protocol. siRNAs targeting UBE2C and a negative control siRNA (siNC) were synthesized by GenePharma and transiently transfected into HEK293T or gastric cancer cells using Lipofectamine 2000 (Invitrogen), according to the manufacturer’s instructions. siUBE2C: CCUGCAAGAAACCUACUCA.
2.7 Quantitative real-time PCR (qRT-PCR)
RNA was extracted using TRIzol reagent (Invitrogen), and cDNA synthesis was performed with the High-Capacity cDNA Reverse Transcription Kit (Applied Biosystems). qRT-PCR was performed using SYBR Green Master Mix on a StepOnePlus Real-Time PCR System (Applied Biosystems). Gene expression was normalized to β-actin. Primer sequences are available upon request. Primer are as follows: UBE2C: F: GATGACCCTCATGGCAGTGG, R: GGGCTCAACCGAGGCTTAAT. ACSL4: F: GGCACGCGGTTCCTTTTT, R: AGCCGACAATAAAGTACGCAA. GAPDH: F: AATGGGCAGCCGTTAGGAAA, R: GCGCCCAATACGACCAAATC。.
2.8 Western blot and immunoprecipitation
Cell lysates were prepared in RIPA buffer with protease and phosphatase inhibitors. Protein concentrations were determined using the BCA Protein Assay Kit. 30ug protein amounts were separated by SDS-PAGE and transferred to PVDF membranes. Membranes were blocked and incubated with primary antibodies against UBE2C (Abcam, ab252940), ACSL4 (CST, #38493), FTH (Abcam, ab75973), and GAPDH (Abcam, ab8245), followed by HRP-conjugated secondary antibodies. Bands were visualized using the ECL detection system. For immunoprecipitation, cell lysates were incubated with anti-UBE2C or anti-ACSL4 antibodies overnight at 4 °C, followed by protein A/G beads. Immunocomplexes were washed, eluted, and analyzed by Western blot.
2.9 Immunoprecipitation-coupled mass spectrometry (IP-MS)
Cell lysates were prepared 24 h post-transfection for immunoprecipitation using anti-UBE2C antibodies. Proteins were resolved by SDS-PAGE, stained with Coomassie Brilliant Blue, and specific bands were excised for LC-MS/MS analysis. The spectra were analyzed with MaxQuant software, and only proteins identified by at least two unique peptides were considered for analysis.
2.10 Ubiquitination assay
To assess the ubiquitination status of ACSL4, HEK293T or gastric cancer cells were transfected with HA-tagged ubiquitin (HA-Ub), along with either Flag-tagged UBE2C overexpression plasmid or UBE2C-targeting siRNA. For K48-specific linkage experiments, plasmids expressing HA-Ub-K48-only constructs (Addgene) were co-transfected. Cells were treated with 10 µM MG132 for 8 h before harvesting. Lysates were precleared and subjected to immunoprecipitation with anti-ACSL4 antibody (CST, #38493) overnight at 4 °C, followed by incubation with protein A/G agarose beads (Thermo Fisher) for 2 h. After washing, the bound proteins were resolved by SDS-PAGE and analyzed by Western blotting using anti-HA and anti-ACSL4 antibodies. Input samples were analyzed in parallel to verify protein expression.
2.11 Cell viability assay
Cell proliferation was assessed using the CCK-8 assay (Dojindo). Cells were seeded in 96-well plates, treated as indicated, and CCK-8 solution was added at the specified time points. Absorbance was measured at 450 nm using a microplate reader.
2.12 Transwell assay
In the Transwell assay, cells were seeded in the upper chamber with matrigel. After 24 h, non-invasive cells were removed with a cotton swab. The cells at the chamber’s base were fixed with methanol and stained with crystal violet. Five random fields were captured using a Leica microscope.
2.13 Wound healing assay
Cells were plated in 24-well plates and cultured until confluence. Wounds were created using a 200 µl micropipette, followed by washing with PBS. Serum-free medium was added, and images were taken at 6-hour intervals over 24 h. The results were analyzed using ImageJ software.
2.14 Immunofluorescence (IF)
Cells were fixed, permeabilized, and blocked before incubation with primary antibodies against UBE2C and ACSL4. After washing, cells were incubated with Alexa Fluor-conjugated secondary antibodies. Nuclei were stained with DAPI, and images were captured using a confocal microscope.
2.15 ELISA detection
MDA levels were measured using the MDA assay kit according to the manufacturer’s instructions. Fe²⁺ content was determined using the iron ion detection assay kit (Solarbio, BC5410), and GSH and NADPH levels were quantified using commercial ELISA kits (COIBO BIO). Absorbance was measured at 450 nm for all assays.
2.16 Xenograft tumor growth
Nude mice were subcutaneously injected with AGS wild-type or sh-UBE2C cells. GSH (MCE, HY-D0187) was administered by intragastric gavage at a dose of 100 mg/kg per day for 14 consecutive days [13]. Tumor growth was monitored by measuring tumor dimensions with calipers, and tumor volume was calculated. Animals were euthanized using carbon dioxide inhalation, in accordance with institutional guidelines. Tumors were harvested for further analysis, following institutional animal ethics guidelines.
2.17 Statistical analysis
All Western blot experiments were performed with three independent biological replicates and representative results are shown. Other in vitro assays were also conducted in triplicate unless otherwise stated. Data were expressed as mean ± SD. Statistical significance was determined using Student’s t-test or one-way ANOVA followed by post-hoc tests for multiple comparisons. A p-value < 0.05 was considered statistically significant (*p < 0.05, **p < 0.01, and ***p < 0.001). Analyses were conducted using GraphPad Prism software (version 9.0).


Comments (0)