
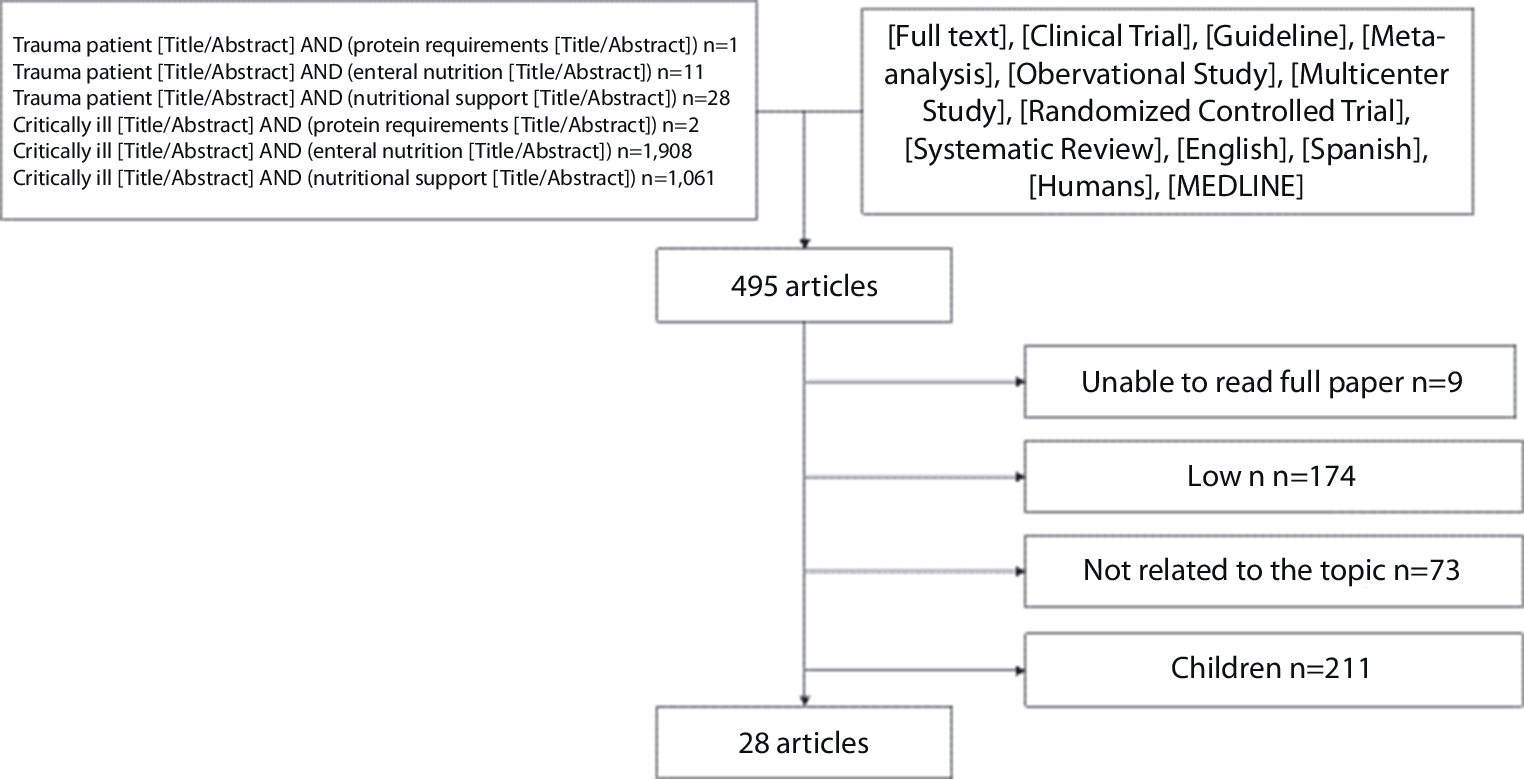
Remember me


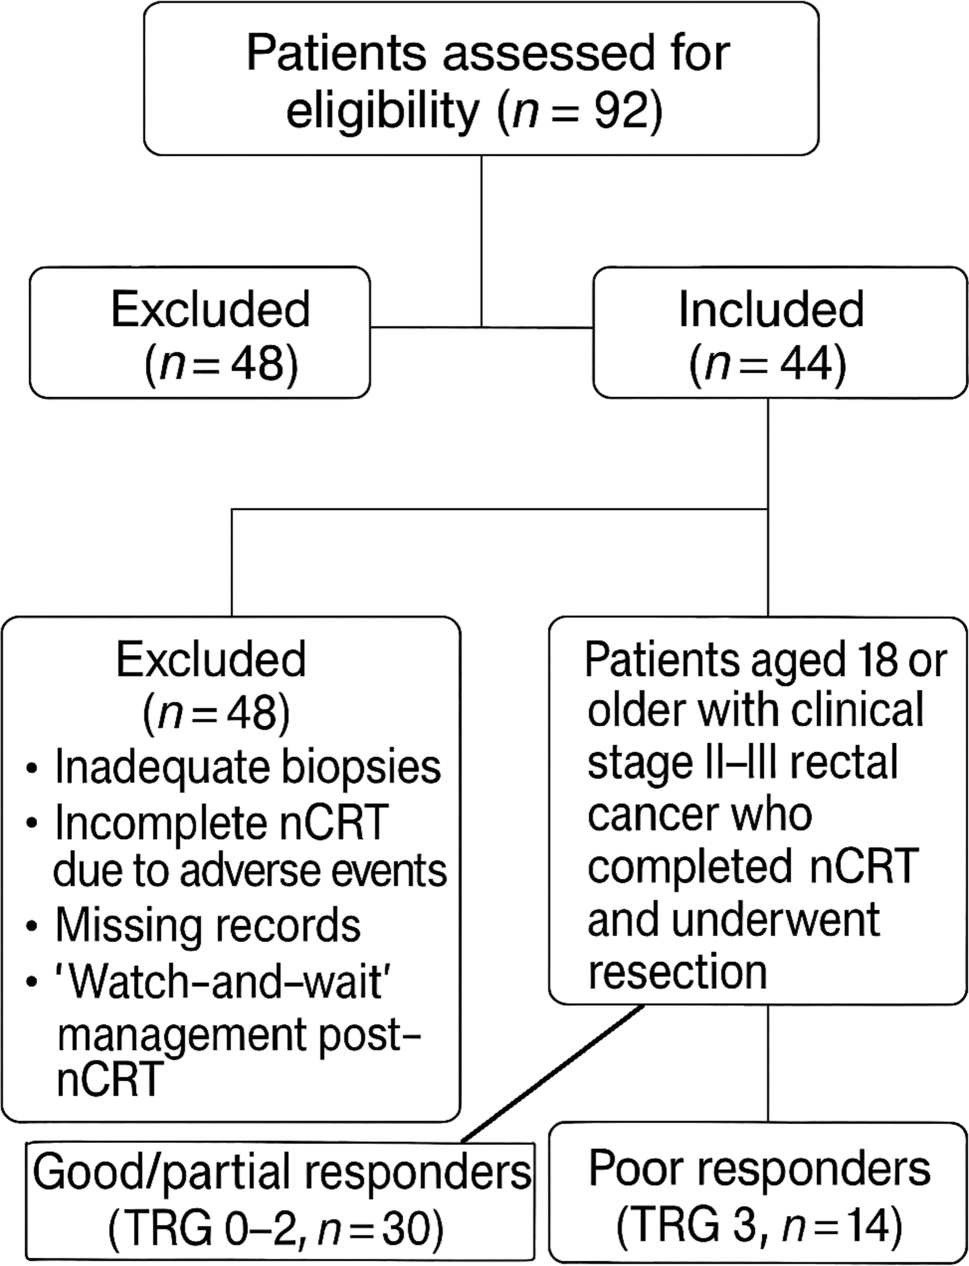

Our comprehensive search across five electronic databases—PubMed, Scopus, Embase, WOS, and Cochrane Central Library—identified 2108 records. After removing duplicates, 450 records remained for title and abstract screening. This process revealed 30 articles that appeared eligible for full-text screening. Nine single-arm studies met the eligibility criteria and were included in our systematic review and meta-analysis. The PRISMA flow diagram is shown in Fig. 1.
Fig. 1
PRISMA flow diagram of the study selection process
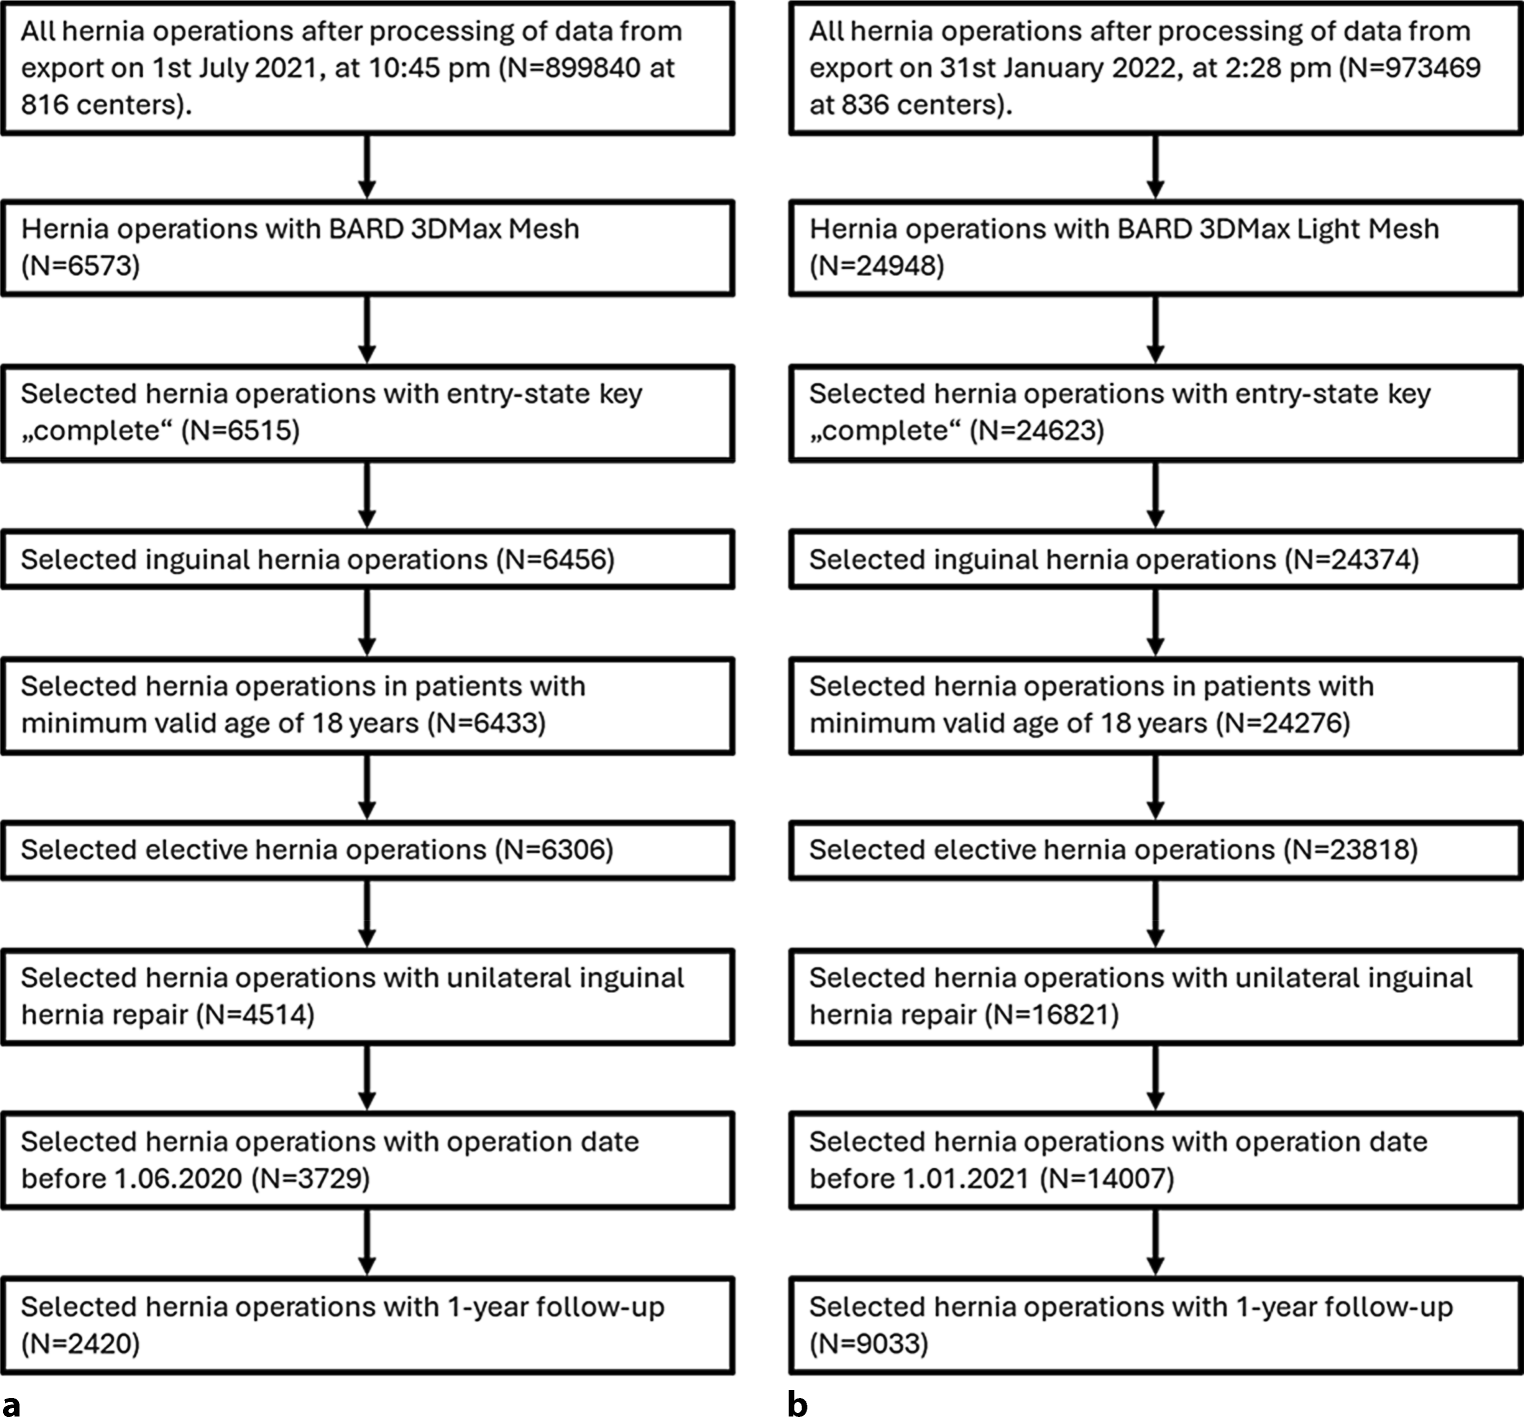
Study characteristicsOur meta-analysis included nine studies [10, 14,15,16, 19,20,21,22,23], comprising 245 patients who underwent EHS to close a mucosal defect after ESD. The summary and baseline characteristics of the included patients are presented in Tables 1 and 2. All studies were evaluated using the NIH tool, as shown in Table S1.
Table 1 Summary of the included studiesTable 2 Baseline characteristics of included studiesEfficacy outcomesSuturing timeOur pooled analysis revealed a mean suturing time of 42.16 min [95% CI: 25.99–58.33]. The included studies exhibited high heterogeneity (I2 = 98%, P < 0.01). We conducted a sensitivity analysis by systematically excluding one study at a time. Although the heterogeneity was not fully resolved, it decreased to 89% by omitting “Kantsevoy 2013” (Fig. 2). Additionally, we carried out a subgroup analysis based on the site of the lesion (χ2 = 0.18, P = 0.67), as detailed in Fig. S1.
Fig. 2
(a) Forest plot of suturing time (minutes); (b) sensitivity analysis of suturing time (minutes).
Complete closure rateOur pooled analysis yielded a complete closure rate of 95% [95% CI: 0.90–0.97], which was sustained postoperatively in 80% [95% CI: 0.74–0.85], partially sustained in 13% [95% CI: 0.08–0.20], and unstained in 1% [95% CI: 0–0.07] of cases.
All pooled studies were homogeneous, with heterogeneity values as follows: I2 = 9%, P = 0.36; I2 = 0%, P = 0.68; I2 = 0%, P = 0.46; and I2 = 0%, P = 1.00, respectively, as shown in Fig. 3.
Fig. 3
Forest plots illustrating (a) the complete closure rate, (b) the sustained closure rate, (c) the partially sustained closure rate, and (d) the unsustained closure rate.
Additionally, we performed a subgroup analysis for both complete and sustained closure rates based on the location of the lesion. The gastric lesions showed higher complete and sustained closure rates: 99% [95% CI: 0.93–0.1] and 86% [95% CI: 0.77–0.92], in comparison with colorectal lesions: 94% [95% CI: 0.86–0.97] and 75% [95% CI: 0.64–0.83]. The subgroup differences were χ2 = 2.69, P = 0.10, and χ2 = 3.31, P = 0.07, as shown in Fig. S2.
Number of stitchesOur pooled analysis yielded a mean number of stitches of 6.87 [95% CI: 4.51–9.23]. The included studies showed significant heterogeneity (I2 = 98%, P < 0.01). We conducted a sensitivity analysis by systematically excluding one study at a time; however, the heterogeneity was not resolved, as illustrated in Fig. 4. Furthermore, heterogeneity was addressed through a subgroup analysis based on the lesion’s location, which yielded χ2 = 0.1, P = 0.75, as shown in Fig. S3.
Fig. 4
(a) Forest plot of the number of stitches; (b) sensitivity analysis of the number of stitches.
Time per stitchOur pooled analysis indicated a mean stitch time of 5.92 min [95% CI: −0.01–11.86]. The analysis showed significant heterogeneity (I2 = 96%, P < 0.01). We conducted a sensitivity analysis by systematically excluding one study at a time. The heterogeneity was resolved by omitting “Scheppach 2024” (I2 = 10% and σ = 7.4), as shown in Fig. 5. Furthermore, heterogeneity was also effectively resolved by performing a subgroup analysis based on differences in the site of lesions (I2 = 10% and P = 0.29), as presented in Fig. S4.
Fig. 5
(a) Forest plot of the time per stitch (minutes); (b) sensitivity analysis of the time per stitch (minutes).
Procedure timeOur pooled analysis indicated a mean procedure time of 43 min [95% CI: 23.59–62.41]. The analysis showed significant heterogeneity among the included studies (I2 = 93%, P < 0.01). To address this heterogeneity, we performed a sensitivity analysis. Although the heterogeneity was not fully resolved, it decreased to 87% by omitting “Uozumi 2024.” Furthermore, we conducted a subgroup analysis based on the site of the lesion. The subgroup of colorectal lesions was homogeneous (I2 = 0%, P = 0.77), and the heterogeneity in the gastric subgroup decreased (I2 = 77%, P = 0.01), as shown in Fig. S5.
HospitalizationOur pooled analysis indicated a mean hospital stay of 4.25 days [95% CI: −5.28–13.78]. The pooled studies exhibited significant heterogeneity (I2 = 98%, P < 0.01). Due to the limited number of studies (only two), the heterogeneity could not be resolved, as shown in Fig. S6.
Adverse eventsIntraoperative bleedingOur pooled analysis revealed a 0% intraoperative bleeding rate [95% CI: 0–1.00]. The included studies were homogeneous (I2 = 0%, P = 1.00). Furthermore, a subgroup analysis based on the location of lesions demonstrated no significant difference (χ2 = 0, P = 1.00), as shown in Fig. S7.
Postoperative bleedingOur pooled analysis revealed a postoperative bleeding rate of 3% [95% CI: 0.02–0.07]. The included studies were homogeneous (I2 = 0%, P = 1.00), as illustrated in Fig. 6. Furthermore, a subgroup analysis based on the location of lesions yielded χ2 = 1.82, P = 0.18, as shown in Fig. S8.
Fig. 6
Forest plot of the postoperative bleeding rate.
Intraoperative perforationOur pooled analysis demonstrated a 0% intraoperative perforation [95% CI: 0–0.03]. All studies were homogeneous (I2 = 0%, P = 1.00), as presented in Fig. S8. A subgroup analysis based on lesion location indicated no significant difference (χ2 = 0, P = 1.00), as shown in Fig. S9.
Postoperative perforationOur pooled analysis revealed a postoperative perforation rate of 1% [95% CI: 0–0.04]. All included studies were homogeneous (I2 = 0%, P = 1.00), as displayed in Fig. S10. Additionally, a subgroup analysis based on the location of lesions indicated no significant difference (χ2 = 0, P = 1.00), as shown in Fig. S11.
Comments (0)