
Remember me

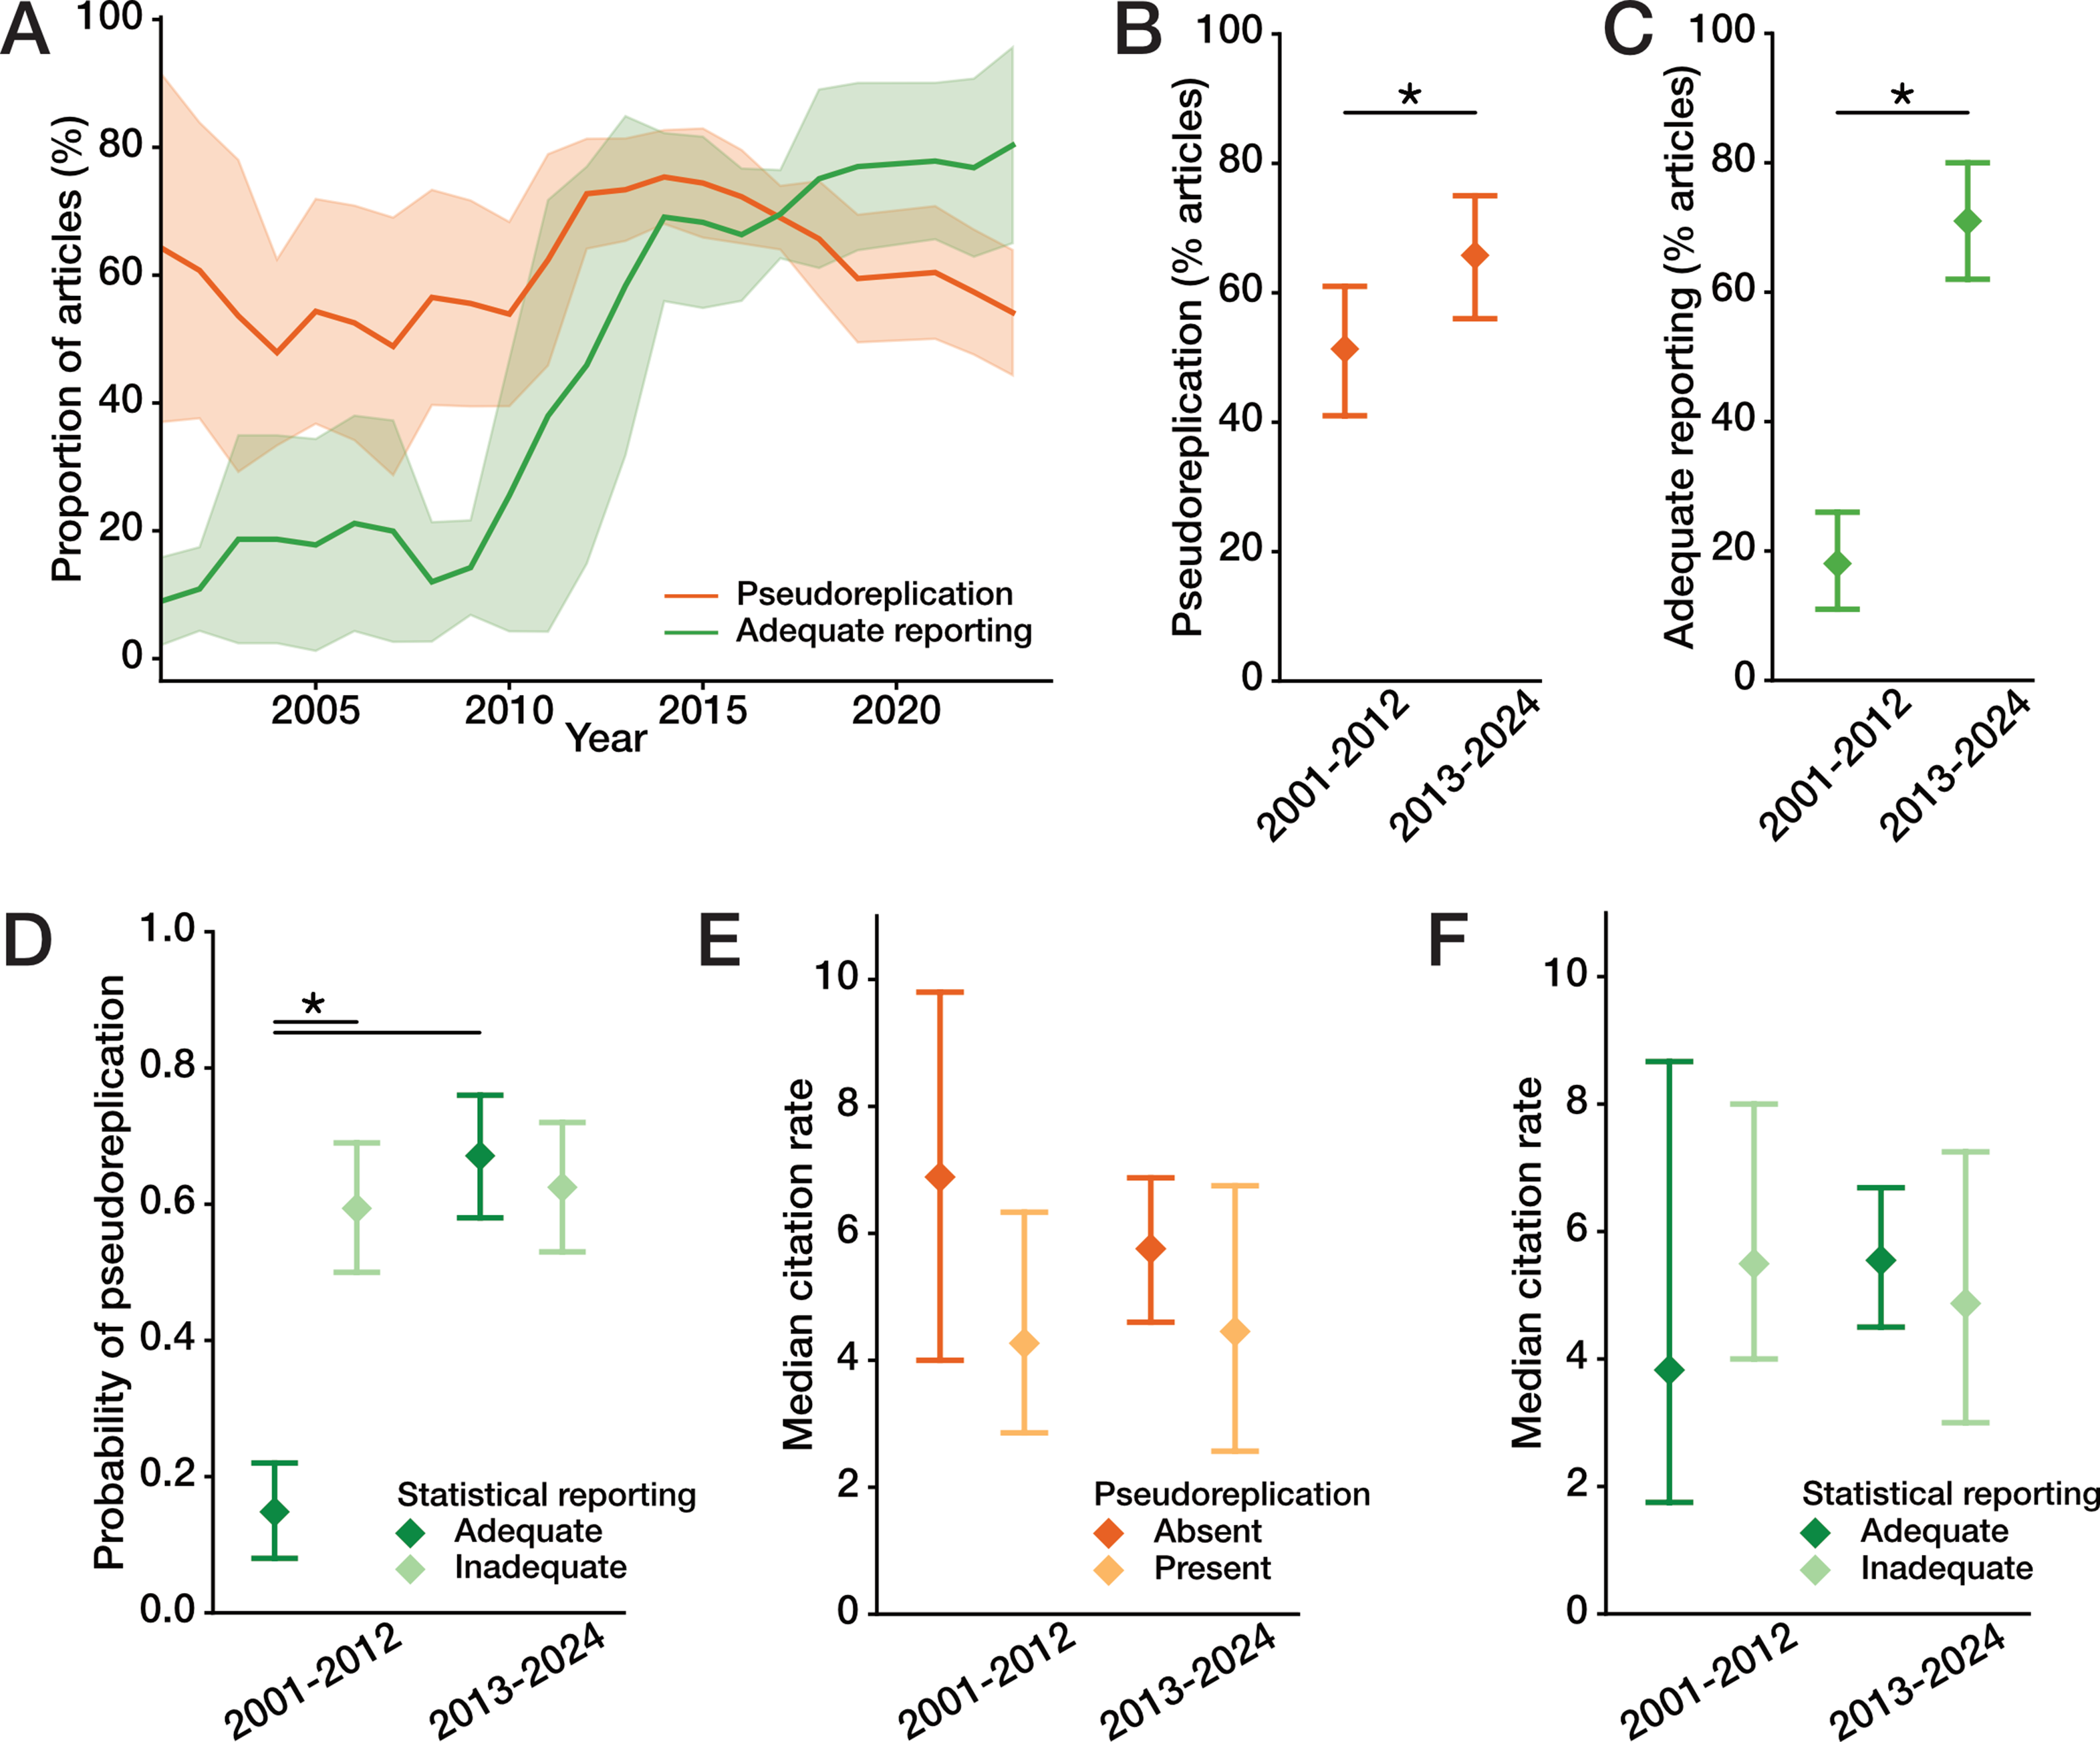


Our results demonstrate that pseudoreplication is a widespread phenomenon in the FXS and wider ND literature, featuring in the majority of articles published in the past two decades despite improvements in statistical reporting ushered by the advent of statistical reporting guidelines enforced by journals. Far from a fringe phenomenon, pseudoreplication is abundant in articles published in highly respected neuroscience journals and spans the entire spectrum of impact and influence in mouse-model studies of neurological disorder. Better statistical reporting alone has done little to curb its prevalence. Rather, the increase in the percentage of articles suspected of pseudoreplication we observed is likely due to the fact that it is easier to detect when more statistical details are provided.
But how much of a problem is pseudoreplication? After all, if an error in statistical analysis has little effect on the conclusions of a study, or does not affect the overall emergence of spurious findings, then perhaps it may not harm reproducibility within the field and its prevalence may be viewed as rather inconsequential [26, 27].
Let’s consider the following example, which is fairly representative of the studies we reviewed here. An experiment is designed to determine the effect of deleting a gene on a physiological phenotype measured at cellular resolution, with multiple cells recorded per animal (Fig. 3A). In this instance, individual animals would constitute the appropriate sample size (“N”) rather than individual cells, as the properties of cells within a given animal will inevitably show some correlation with each other irrespective of genetic manipulation [28, 29]. Treating within-group samples (cells in this case) as independent would therefore underestimate variability and constitute pseudoreplication, as sample size would be artificially inflated. The disparity in between-animal and within-animal variance can be quantified using the intra-class correlation coefficient [30, 31], or ρIC (Fig. 3A). The higher the ρIC, the higher the discrepancy in between-animal and within-animal variability, meaning multiple samples from a small animals will be less representative of the wider population (Fig. 3B). As the faithful representation of observed variance is a critical consideration for the bulk of statistical tests, including ANOVA or the Student’s t-test, misrepresentation of variance can be a critical error for statistical inference [3, 29, 32].
Fig. 3
A typical example of pseudoreplication and its consequences for Student’s t-test. (A) Many experimental designs use within-animal samples to draw conclusions about the effect of a gene or environmental condition. The total variability in an effect can be split into a within-animal component (between cells, in this case) and a between-animal component. The intra-class correlation coefficient, ρIC, is a measure of how these sources of variation are related. (B) Schematic of variability relationships between and within animals for low (left population) and high (right population) intra-class correlation. Note that animals in the population on the left have high variance between cells (within animal), whereas animals in the population on the right have low cell variance in any given animal. (C) Pseudoreplicating by considering within-animal replicates as experimental replicates inflates the true Type-I error rate (false positive rate). X indicates the example case given in the text. The curves show how the true Type-I error rate varies with the number of within animal replicates for commonly stipulated significance levels (5%, 1%, 0.1%) and for the possible range of between-animal replicates (solid curves = 2 animals, dotted curves = infinite animals). For all curves, ρIC is set to 0.5. (D) The combined effect of within-animal replicates and intra-class correlation (ρIC) on the Type-I error rate for a significance threshold of 5% in the presence of pseudoreplication. Between animal standard deviation is shown normalised to within-animal standard deviation for comparison with corresponding values of ρIC
Classical statistical inference, used in the overwhelming majority of published articles, assumes a threshold p-value for determining whether an observation is “statistically significant”, with values below the threshold considered grounds for rejecting the null hypothesis. This threshold (ɑ) represents the accepted false positive rate and is typically set to 5% or less for a given test. Pseudoreplication results in artificially low p-values, an effect which becomes more prominent the more the replicate number is inflated raising the false discovery rate beyond the stipulated threshold value [3]. For example, if we were to apply the Student’s t-test on a typical dataset comprising of 2 groups, with 3 animals per group and 6 cells from each animal, assuming that the within-animal and between-animal variance is equal (i.e. ρIC = 0.5) the true false discovery would be 33% rather than the stipulated 5% (Fig. 3C). Ostensibly increasing the stringency of our test by lowering the p-value threshold would only modestly diminish the effect of pseudoreplication on false discovery rate (blue and green traces in Fig. 3C), particularly for higher numbers of pseudoreplicates. Increasing the number of true replicates (i.e. number of animals) would also do little to curb the effect of pseudoreplication; assuming infinite true replicates, false discovery rates would still rise to unacceptable levels as the number of pseudoreplicates increases (dotted traces in Fig. 3C). This discrepancy between stipulated false discovery rate and true false discovery rate dramatically increases as the number of pseudoreplicates per true replicate rises beyond 10. This can be particularly problematic for studies which consider individual synaptic terminals, dendritic spines or cell bodies in counting fields as pseudoreplicates can readily inflate sample size by several orders of magnitude, rendering inferential statistics meaningless [10].
The degree to which pseudoreplication inflates the false discovery rate depends on the degree of correlation within and between replicates, captured by ρIC [29, 30]. The higher the ρIC, the worse the consequences of pseudoreplication, as false discovery rates rise beyond the stipulated threshold (Fig. 3D).
While all research approaches can suffer from pseudoreplication, approaches where replicates from a single animal are most possible showed a higher prevalence of pseudoreplication (and where pseudoreplication is likely to have the greatest effect on the statistical outcome). Because measurements form multiple cells is most common in anatomical studies, these most commonly resulted in pseudoreplication; however, cellular physiological measurements were also commonly pseudoreplicated. In vivo 2-photon imaging and high-density probe electrophysiological recordings were very commonly pseudoreplicated (although, to date, the latter are rarely encountered in NDD research). Indeed, these types of approaches are particularly vulnerable to this type of statistical error because they make measurements from 10s to hundreds of cells. As we note below, measuring from multiple cells from individual animals can increase the power of the experiment if the within and between animal variation is accounted for in a single statical approach. Biochemical and transcriptomic data tended to fare better by virtue of relying on more complex statistical tools (such as mixed-effects models).
How can pseudoreplication be avoided? For classical null hypothesis significance tests (NHSTs), such as t-tests or ANOVAs, the best course of action would most often be pooling within-animal replicates to obtain an average measurement for each animal; for example, averaging all cells recorded from an animal and treating animal means as independent replicates [33]. This relatively blunt approach, however, is not without its shortcomings. Statistical inference on animal averages fails to capture within-animal variability and can obscure effects where they may be present [34], leading to inflated false negative rates [35]. A more desirable - albeit more complex - approach is to model between and within group factors using linear mixed effects models [30], which can model variability between and within animals. While such models are themselves not immune to pseudoreplication [36], they allow for the interrogation of complex relationships in data which would otherwise violate the assumptions of classical NHSTs [37]. Bayesian inference offers another alternative approach to NHSTs, which can be used to make valid predictions about biological entities even if they are pseudoreplicates [38]. Irrespective of the choice of statistic, we encourage authors to interrogate complex hierarchical datasets using interactive computational tools such as “LabAID” [39] as a standard step in their statistical analyses, as such exploration is often sufficient to avoid many common statistical errors including pseudoreplication [40]. Overall, the most reliable way to avoid pseudoreplication is to design experiments that yield adequate sample sizes for quantities of interest, as no statistical approach can ameliorate an underpowered study [5, 9].
Pseudoreplication was identified as an issue nearly four decades ago [2], with many articles since highlighting the dangers it engenders for neuroscience as a field [3, 7, 9, 41, 42]; why does it remain so pervasive to this day? We speculate that part of the issue is an inappropriate emphasis on p-values by authors, reviewers and editors. The widely held belief that a low p-value indicates a “real” result creates a pressure to analyse data in a way that generates low p-values and suppress data that do not fall under an arbitrary significance threshold [43]. Furthermore, this emphasis on p-values often forces authors to adopt NHST approaches where their use is not warranted, for example in observational or preliminary studies which would otherwise be better served by reporting summary statistics. The current culture surrounding scientific publishing offers little scope for such studies to be published, as editors and reviewers will often reject manuscripts that are not deemed to be “hypothesis-driven”. This may lead to authors developing post-hoc hypotheses (a process known as HARKing) in order to carry out NHSTs, a practice which is widely considered inappropriate [44]. This is not an issue unique to the use of p-values for determining significance; the use of small confidence intervals to determine significance would be equally problematic. Rather, the emphasis that our community places on producing statistically significant results therefore leads to a use of statistics that is reducing the reproducibility of our science and - by extension - the integrity of our field [10, 45,46,47,48,49].
It would be rather rash to suggest that large portions of the literature in the last twenty years ought to be discarded solely due to the presence of pseudoreplication. Studies that have been reproduced multiple times by different groups, for example, are likely to be genuine; on the other hand, caution is warranted for “one-off” observations based on pseudoreplicated data. Conclusions in studies reporting large effect sizes are also likely to survive correcting for pseudoreplication, while small effect sizes on pseudoreplicated data warrant caution. Studies attempting to address phenotypes mechanistically should certainly not be discounted on the basis of pseudoreplication alone. It is important to note that during the course of our survey, we observed many instances of statistical errors, such as inappropriate use of statistical tests, and basic errors of interpretation which were entirely separate from pseudoreplication. Critical judgement of a paper’s merits is therefore required irrespective of the presence or absence of pseudoreplication.
LimitationsThe scope of this study was limited to a specific neuroscience-related area of research; while the implications of pseudoreplication apply to all fields of empirical research, we did not attempt to quantify the prevalence of pseudoreplication in articles which did not use animal models of neurological disorders. However, our results are consistent with previous work which reported similarly high prevalence of pseudoreplication in neuroscience studies at large [3].
Manual scoring of articles for pseudoreplication could be a potential source of bias, as the subjective assessment of an individual reviewer on the presence of pseudoreplication could be coloured by their prior belief on its prevalence. This could particularly be the case for articles which did not report adequate statistical details to definitively determine whether pseudoreplication was present. In this study, we took a number of steps to eliminate bias. Firstly, all articles were scored independently by two reviewers who were blind to each other’s result, which highlighted instances where the presence of pseudoreplication was disputed. We also employed a policy of giving articles where the presence of pseudoreplication was disputed on account of inadequate statistical reporting the “benefit of the doubt”, which effectively lead to scoring under the assumption that an article was not pseudoreplicated unless there was evidence to suggest otherwise.
Finally, we assessed whether individual reviewers were biased in their scoring for pseudoreplication using the proportion of articles they deemed to be pseudoreplicated; if the percentage of articles an individual reviewer deemed to be pseudoreplicated was above two standard deviations of the overall mean across all reviewers, a reviewer could be considered biased. We did not detect bias in our reviewing using this method.
It is important to note that our estimates on the prevalence of pseudoreplication apply only to articles which had the potential for being pseudoreplicated, i.e. articles which used inferential statistics in experiments whose design permitted repeat sampling from animal units. As articles which did not fit these criteria, such as those reporting only behavioural results or non-experimental articles such as reviews, were not considered, our findings reflect that pseudoreplication is prevalent in the majority of articles which could be pseudoreplicated, rather than the majority of articles across the entire literature.
Comments (0)