In this paper, we used two different clustering algorithms to identify subgroups, both within and across autism and ADHD diagnoses, based on centile scores derived from population modelling. We compared our results across two different clustering implementations, as well as the effect of using global or regional features, and examining conditions individually or transdiagnostically. Most notably, we found that the optimal number of subgroups differs greatly depending on the algorithm chosen and features used, raising significant implications for the interpretation of studies focused on data-driven subgrouping methods, as well as the comparison of results between studies using different methods and algorithms.
Clustering based on global features
When clustering using global neuroanatomical features, results were similar across all datasets and methods. In all cases, two subgroups with opposite effects were identified: one with increased GMV and SA, and one with decreased GMV and SA relative to controls. Most datasets also had a significant difference in cortical thickness between the control group and the subgroups, but with a less consistent pattern. For the UMAP and k-medoids results, the UMAP embedding plot showed a clear separation across the second embedding for all datasets, which captured surface area and grey matter volume. For HYDRA, using the global features resulted in the highest ARI scores, as well as the greatest difference between the optimal solution and the others. This is likely caused by the lower dimensionality of the data when using global features compared to regional values which results in lower noise.
In some of our clustering solutions, we found certain individuals that, despite having a very large centile opposite to the subgroup, still get classified in that specific subgroup. This would be the case, for example, of an individual with a GMV centile of + 0.75 getting classified into the ‘small’ brain subgroup. It is important to take into consideration that even in the global datasets, the data is clustered based on 6 global measurements: grey matter volume, surface area, cortical thickness, subcortical grey matter volume, ventricular volume, white matter volume. Therefore, the allocation to a specific subgroup is driven by the interaction of all of these variables, not just one in particular. It is also possible that an individual with a very high centile for GMV also has a low centile for CT (Figure S5). Although GMV, SA, sGMV and WMV are largely consistent in the directions across subgroups, CT and ventricular volume are more variable, and thus can have an impact on the subgrouping. Overall, most individuals do follow the general patterns of the subgroups.
The objective behind using all of the global measurements together during clustering was to capture patterns across them that could not be seen if the clustering had been carried out manually. In order to ensure that these purely data-driven methods can yield interpretable results, it is key to carry out appropriate post-clustering analysis, such as looking at the silhouette or ARI scores and comparing results across algorithms.
Clustering based on regional featuresRegional uncorrected features
In order to further disentangle the differences between subgroups, we next clustered the data based on regional centile scores, with the aim of identifying more localised differences relative to controls. HYDRA still identified two subgroups as the optimum number for the autism dataset, with similar neuroanatomical profiles to the global results. For ADHD and for the combined dataset, however, the optimal number of clusters was three, suggesting that the ADHD individuals were potentially driving the results observed in the combined dataset. In addition, the patterns across subgroups in the combined dataset looked more similar to the ADHD subgroups than the autism ones. For k-medoids, the optimal number of clusters identified with regional features was the same as for the global dataset for all groups, and the projections onto the two UMAP embeddings also showed the same partitioning as for the global result.
Regional features with global correction
Finally, to clarify whether these results were driven by global or regional effects, we clustered the data on regional features that were corrected for global effects by subtracting the corresponding global centile score from each regional value. Using the corrected dataset, HYDRA identified three optimal clusters across all datasets. Similar to the uncorrected case, the ARI scores were lower and closer to each other than for the global dataset. K-medoids, on the other hand, consistently identified four subgroups across all datasets.
Autism results
For both the global and regional uncorrected datasets, across both techniques, the optimal number of clusters identified for autism was two. These clusters showed distinct and opposite effects relative to the control group: one with increased surface area and grey matter volume, and the other with decreases in these features. In the regional uncorrected results, although the effect sizes and the number of significant regions were stronger for both SA and GMV, the subgroups also showed differences in cortical thickness: subgroup 1 presented with overall decreased CT, whereas subgroup 2 had an overall increase. This difference was further amplified when correcting for global effects in the k-medoids solution: the two clusters split into four, where two clusters had increased CT and two had decreased CT. In contrast, when correcting for global effects and implementing HYDRA, the effect sizes decreased greatly, and no significant regions remained. This indicates that HYDRA was not able to capture neuroanatomically different subgroups when the data was corrected for global effects. Our findings suggest that, rather than being restricted to specific brain regions, differences between autistic and non-autistic individuals manifest at a more global level (Fig. 2a). While the majority of autistic individuals have global brain measures within the typical range, our analyses indicate that the observed differences are not confined to discrete regions but instead reflect broader patterns of variation.
Given that when using HYDRA we are clustering autistic individuals against controls, we initially might expect 3 clusters to be found: one capturing microcephaly, one capturing macrocephaly, and one representing ‘typically’-sized brains. However, the optimal number of clusters was two when clustering the global dataset using HYDRA. It is possible that HYDRA is sensitive to small deviations and clusters together individuals with the same trend, independent of the magnitude, as it is trying to find heterogeneity within the condition cohort.
In the case of k-medoids, where no controls were included in the clustering, we also found a 2-class solution for the global and regionally uncorrected autism datasets. As there were no controls in this dataset, and thus no label for ‘typical’, we might expect two clusters to arise capturing microcephaly and macrocephaly. The distribution of individuals across the UMAP embeddings does not show any clear clusters (Fig. 1), and the silhouette scores were close to each other. Therefore, although the solution was statistically optimal, the data was not highly separable. The overlap between HYDRA and k-medoids solutions was high for the global dataset, showing that similar patterns had been identified across methods for this particular dataset.
The two clusters identified here are also consistent with some previous work [23, 29, 36]. Finally, it is also possible that age related differences are impacting our findings, given the wide age range of our dataset, and that there is as of yet no consensus on findings of micro/macrocephaly later in life.
In the global dataset solution generated with k-medoids, the subgroups showed significant differences in age, RBS-R Total and SWAN ADHD Inattention. However, the effect sizes were small. IQ and age also differed significantly for the regional uncorrected HYDRA subgroups, again with small effect sizes. Overall, the significant differences in clinical features between subgroups were not consistent across datasets using different features or different clustering techniques.
Previous studies using neuroimaging phenotypes to cluster within autism have similarly found subgroups with increased and decreased cortical thickness and surface area, although the number of clusters varies between studies. In a recent study, Zabihi et al. observed 5 distinct subgroups of autism with different clinical profiles using population modelling [28]. On the other hand, Itahashi et al. reported two clusters implementing HYDRA within a male-only autistic and ADHD cohort using measures of CT and SA separately [29]. There was no relationship between the diagnosis and the subgroups identified in the study. These findings further reinforce that the number of subgroups identified is highly dependent on the data used and the algorithms chosen. A previous study that clustered autistic individuals based on their ADOS-G scores found two distinct subgroups. Using normative modelling, they were able to compare neuroanatomical differences between the subgroups and found that the direction of the CT deviations varied within each subgroup, similar to our findings [23]. Additionally, the study highlights significant heterogeneity within subgroups as the accuracy of a support vector machine did not improve when clustering the controls against the subgroups instead of against all of the autistic individuals.
Our results are in line with research suggesting that previously inconsistent findings with regards to brain overgrowth in autism may in fact be capturing distinct subgroups within the autistic population, including one with macrocephaly [10, 11], highlighting the importance of examining heterogeneity and differences within clinical cohorts instead of focusing only on case-control analysis. Previous research suggests young autistic boys are much more likely than girls to fall into the macrocephaly subgroup [10, 11, 46]. Here, we did not find a significant sex difference, however, unfortunately, our female sample may have been underpowered, and this is an important future topic of investigation. Critically, these subgroups have been demonstrated to also have distinct behavioural and clinical profiles, as well as functional outcomes [10, 46]. Unfortunately, we were also limited in our ability to explore clinical differences between subgroups due to the consistent availability of clinical data across sites in our dataset; however, future research on better characterised samples will be critical to achieving clinical translation or utility from subgrouping research.
ADHD results
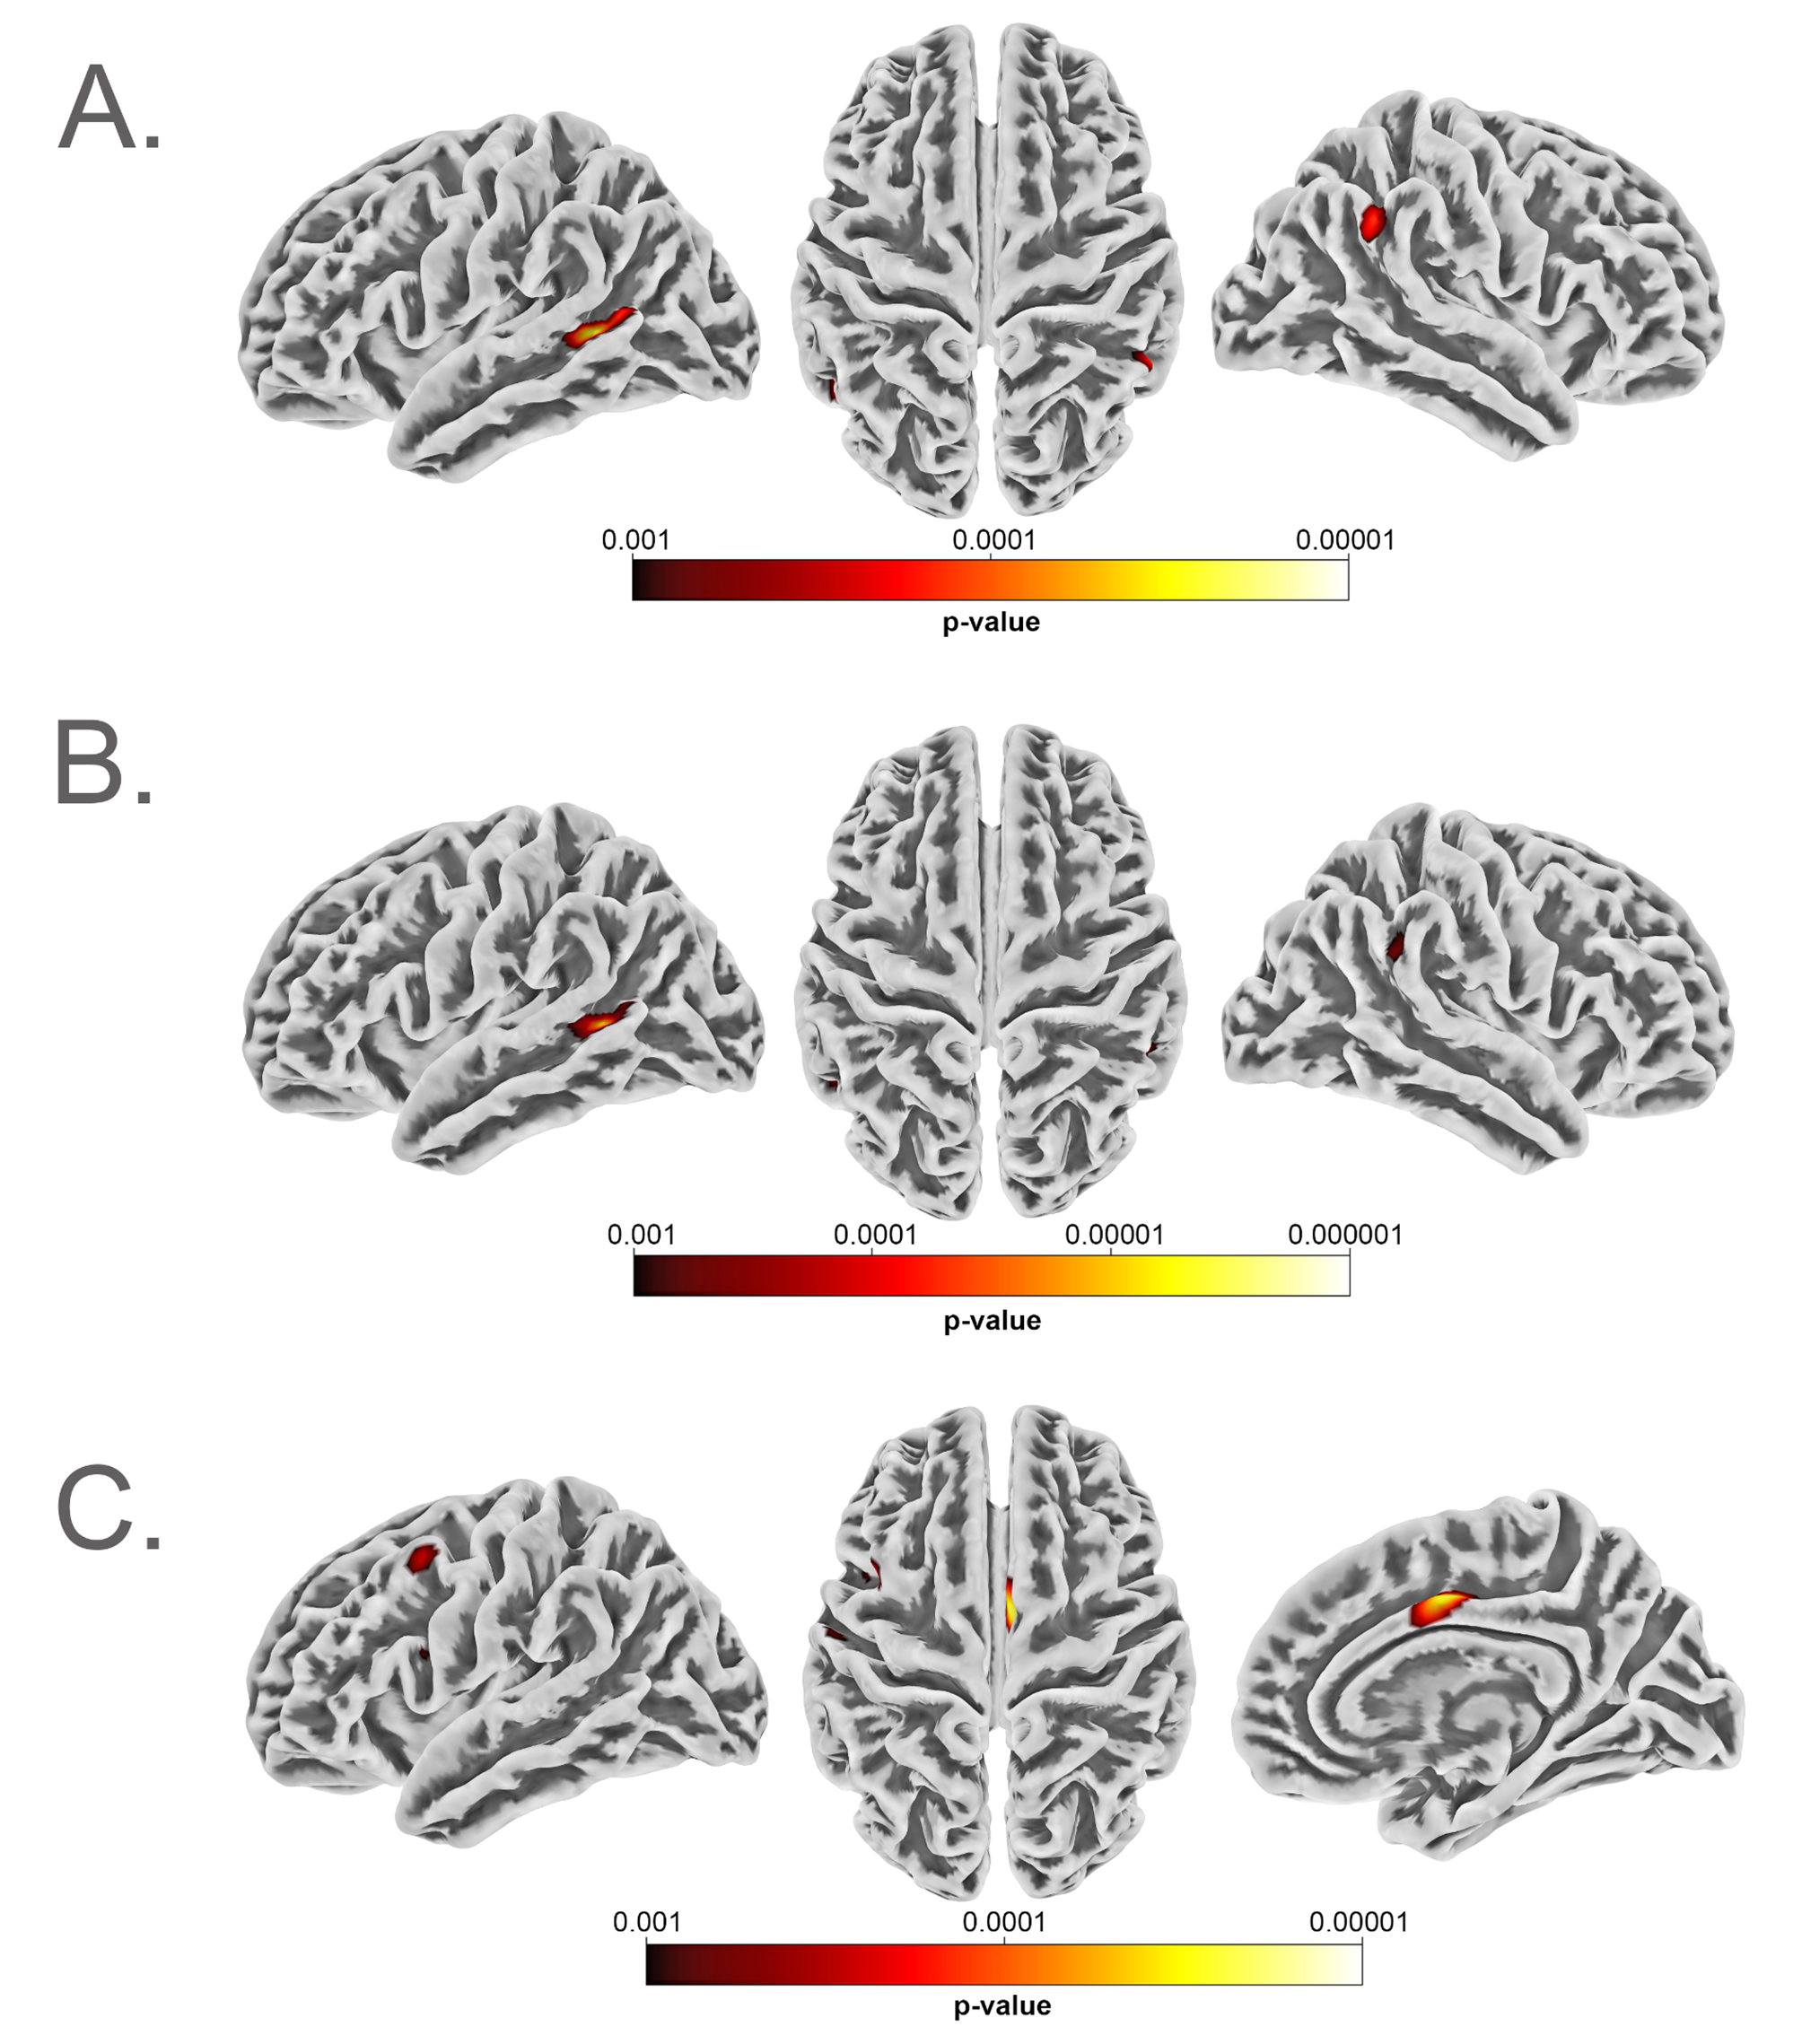
In the ADHD global dataset, both algorithms identified two distinct subgroups as the optimal solution, each one presenting with increased or decreased SA and GMV. However, the solutions for the regional datasets differed greatly across methods. For the regional uncorrected dataset, HYDRA identified 3 clusters, all with slight decreases in SA and GMV relative to the controls; however, these differences were only significant in some regions for subgroups 1 and 2, with very small effect sizes, and with no significant differences in subgroup 3. The direction of CT variations were less consistent within subgroups, and only one region was significant across all three groups. After correcting for global effects, the patterns across subgroups looked very different: all subgroups showed an overall relative increase in surface area and grey matter volume with respect to the controls, but with very few regions reaching significance. The regions which did show significant increases relative to controls were localised to the prefrontal cortex and insula, rather than the widespread effect across the cortex observed in other analyses. The prefrontal cortex is a highly relevant area for ADHD and has been consistently implicated in neuroimaging studies, and linked to difficulties in regulatory and reward behaviours, social and emotional processing, planning, and cognitive control in diagnosed individuals [17, 47,48,49,50]. The solution for k-medoids, however, captured two distinct subgroups for the uncorrected dataset that separated into four clusters in the corrected case, as was observed in the autism dataset. Although there were no clinical differences across subgroups, there was a significant difference in IQ in the global dataset for HYDRA and k-medoids, where in both cases subgroup 1 had a slightly higher IQ than subgroup 2. The effect sizes in both cases were small.
Combined dataset results
In the autism and ADHD combined dataset, the HYDRA solutions strongly resembled those obtained in the ADHD dataset. In addition, the k-medoids solution reflected the same pattern as for the single-diagnosis datasets, with two subgroups that split into four after correcting for global effects. Both methods identified a significant difference in IQ between subgroups in the global dataset, again with small effect sizes. In addition, the k-medoids derived subgroups showed significant differences in age and IQ in the regional uncorrected dataset, and differences in IQ and diagnostic in the regional corrected dataset. In this last case, although all subgroups contained participants from both diagnoses, subgroup 4 had a reduced ratio of ADHD to autistic participants and also a significantly increased IQ with respect to two other subgroups. The differences in diagnostic group, IQ and site across the combined dataset all appear to be linked as the ADHD participants had overall lower IQ and came from different sites than the autism participants. Thus, it is difficult to disentangle these results and understand which one was driving the clustering.
Itahashi et al. [29] used HYDRA to cluster a cohort of male ADHD and autistic individuals using regional measures of cortical thickness and surface area. They found a 2-class solution across both cortical thickness and surface area and two different atlases. Each class represents an inverse pattern with respect to controls, one shows an increase and the other a decrease. This is the case for both solutions clustered using CT and SA separately. For the equivalent dataset in our study (the combined regional datasets clustered using HYDRA) we instead find 3 clusters as the optimal solution. In our case, the three clusters show overall the same pattern, with decreased SA and GMV, but no significant differences in CT.
Differences in these results could be due to multiple factors. Firstly, there are differences in dataset characteristics: we are working with a larger number of individuals, across multiple sites, including both men and women, whereas they focused on a smaller cohort of only males. Secondly, they clustered using raw measurements of surface area and cortical thickness, obtained for both Schaefer and Destrieux’ atlases. We instead used centile scores obtained for the Desikan-Killiany atlas. Their findings do however support the hypothesis that HYDRA is sensitive to differences between subgroups and a ‘typical’ cluster might be unlikely.
Clinical and demographic differences between subgroups
IQ was the clinical feature with data available for most participants, which likely contributed to its higher statistical power relative to the other features and made the detection of significant differences more feasible. These results suggest that IQ may be a useful clinical feature but show that having sufficient data is key in obtaining adequate statistical power. In other studies with more extensive clinical data — either focusing on autism subgroups [23, 34] or using transdiagnostic datasets [51] — significant differences in clinical features were identified between subgroups, suggesting that these features could serve as potential markers for subgrouping.
Apart from the clinical features, all adjusted regional k-medoids solutions had significant differences across subgroups for both FSQC and site. Strict quality control was carried out to select participants for this study, therefore all the participants chosen had high quality scans. In addition, when plotting the individuals along the UMAP embeddings and visualising the distribution of sites, there were no clear differences or clusters observed (Figure S8). The site difference could again be linked to the fact that participants with different diagnoses were overrepresented in certain sites.
Comparison between algorithms
The stark differences across methods may stem from their distinct approaches to clustering. In addition to differences in the underlying algorithms, HYDRA clusters individuals directly against the controls, while the k-medoids method only clusters within the diagnostic group. As a result, k-medoids is able to capture differences in the subgroups that are inherent to the entire population. This could explain why effect sizes were overall higher in the k-medoids solutions than for HYDRA, specifically in the regional cases, as it could be capturing wider variations in the population. As HYDRA is actively looking for differences against the controls, it may also handle site or FSQC more effectively, which had significant effects for some of the k-medoids derived subgroups, but not for HYDRA.
It is also a challenge to compare across clustering methods that use different evaluation metrics, such as the ARI and the silhouette score. The ARI measures how reproducible a clustering solution is across trials. On the other hand, the silhouette score is a measure of how well separated clusters are. Thus, a direct comparison between both is not easily interpretable. We observed low silhouette scores, which may indicate some underlying structure in the data, but also suggest that the clusters are not well-defined or distinct. In this case, the ARI score could be high if cluster assignments were consistent across trials even though the clusters are not well separated.
Validation of clusters and algorithm selection
As noted above, while there was some agreement, in some cases the two algorithms resulted in drastically different clustering solutions. This raises important implications about the generalisability and validity of findings of data-driven subtypes in clinical conditions in the current literature, in particular in the absence of a ground truth. Critically, we also lacked consistent clinical measures across datasets to properly examine whether these brain-based subgroups map onto distinct clinical profiles or have tangible clinical utility. We observed only very minimal clinical differences between subgroups, though it is difficult to know to what extent this is attributable to insufficient data and statistical power. Given that this exploration of clusters was purely data-driven and there is no ground truth regarding the existence of specific subgroups, it is difficult to conclude which clustering approach is best. HYDRA has the advantage of clustering the data directly against the controls and therefore should account for inter-individual variability. HYDRA may be especially well-suited to study a condition with a distinct boundary with neurotypical individuals. The ARI scores we obtained, however, were not as high as those obtained in previous studies with fewer participants, all of which were from a single site [29]. In that study, individuals were clustered twice, one based on CT, and one based on SA measurements. As we clustered based on all CT, SA, GMV features simultaneously, the dataset may have contained more noise. Therefore, handling great amounts of data coming from different sites may still be a limitation of these clustering algorithms. Behaviour-based subgroups may be more clinically relevant and more reproducible [52,53,54]. Therefore, exploring neuroanatomical differences within a diagnosis should be guided by clinical differences to enhance clinical translation. This study highlights the fact that this kind of algorithms are highly sensitive to the input data and the parameters used, and thus researchers should ensure they are implementing validation methods to ensure robustness when identifying subgroups. An example of this could be implementing multiple clustering algorithms like in this study and then measuring the agreement in the solution across methods.
Future directions
Our study exemplifies the many considerations that need to be taken into account when carrying out clustering. Firstly, the datasets and features used to carry out the clustering, and how they are preprocessed, matter. We found different numbers of clusters depending on whether we used the global or the regional features. Although using regional features might capture more information about a given participant, it can also introduce more noise given the higher number of dimensions. This could explain why the ARI scores for HYDRA were much higher in the global dataset. When using k-medoids, we projected the data onto two dimensions using UMAP for both global and regional datasets, and we did not observe the same drop in silhouette score. Therefore, it is clear that the dimensionality of the data can impact the result. However, with the increasing availability of large-scale data both in terms of sample sizes as well in the number of phenotypes measured, it will become more important to find ways to reduce the data dimensionality while retaining interpretability and signal. While we have outlined several permutations of this here, these are by no means exhaustive, and we encourage future work to explore multiple approaches for identifying meaningful subgroups given the variable impact the chosen method can have on the outcome.
In addition, another consideration would be the features and modalities used during clustering. We incorporated measures of regional and global grey matter volume, cortical thickness, surface area, as well as global white matter volume, subcortical grey matter volume and ventricular volume, together in the clustering, although previous studies have used these measures separately [29]. Although this implementation was part of our purely data-driven approach, future studies could identify which features are the most informative and potentially use only those for clustering to decrease noise in the dataset and improve the robustness of the findings. This would be more challenging in transdiagnostic studies but could be particularly useful in studies on a single condition, in which feature selection could be guided by previously reported case–control differences to identify participants which do and do not fit these neuroanatomical profiles of difference. Previous studies have also successfully identified subgroups of autism based on clinical or behavioural data [20, 21, 51] or employed methods to combine these and other multimodal features for clustering [55, 56]. In our study, given the reduced availability of clinical data, we clustered solely based on the neuroanatomical centiles and then investigated differences in clinical data between subgroups post hoc. For future studies, where clinical data is available, it would be interesting to explore combining it with the neuroimaging data to develop multimodal approaches to clustering. Such methods may better capture individual differences and help unravel heterogeneity across domains.
The choice of algorithm can also lead to different results. Using k-medoids requires using an additional dimensionality reduction technique, which introduces further preprocessing steps that can affect final results. On the other hand, HYDRA is deployed end-to-end, eliminating the need for separate dimensionality reduction before clustering the data. The second main difference between these implementations is the fact that HYDRA clusters the data against the controls. This can also be a trade-off to consider in future studies as it also requires collecting comparison/control participants data and involves more complex methods and longer processing time.
One ultimate goal of subgrouping is, of course, to inform clinical practice and support of autistic individuals and those with ADHD. For this to be possible, better characterised samples with more consistent clinical data will be necessary, either to validate and identify the clinical significance of subgroups, or as inputs to cluster on, as mentioned above. For example, being able to identify support needs and/or functional outcomes could be hugely valuable given the high phenotypic heterogeneity and variability in clinical support needed observed in neurodevelopmental conditions. Future work should explore the most informative and clinically significant features to this end.


Comments (0)