
Remember me

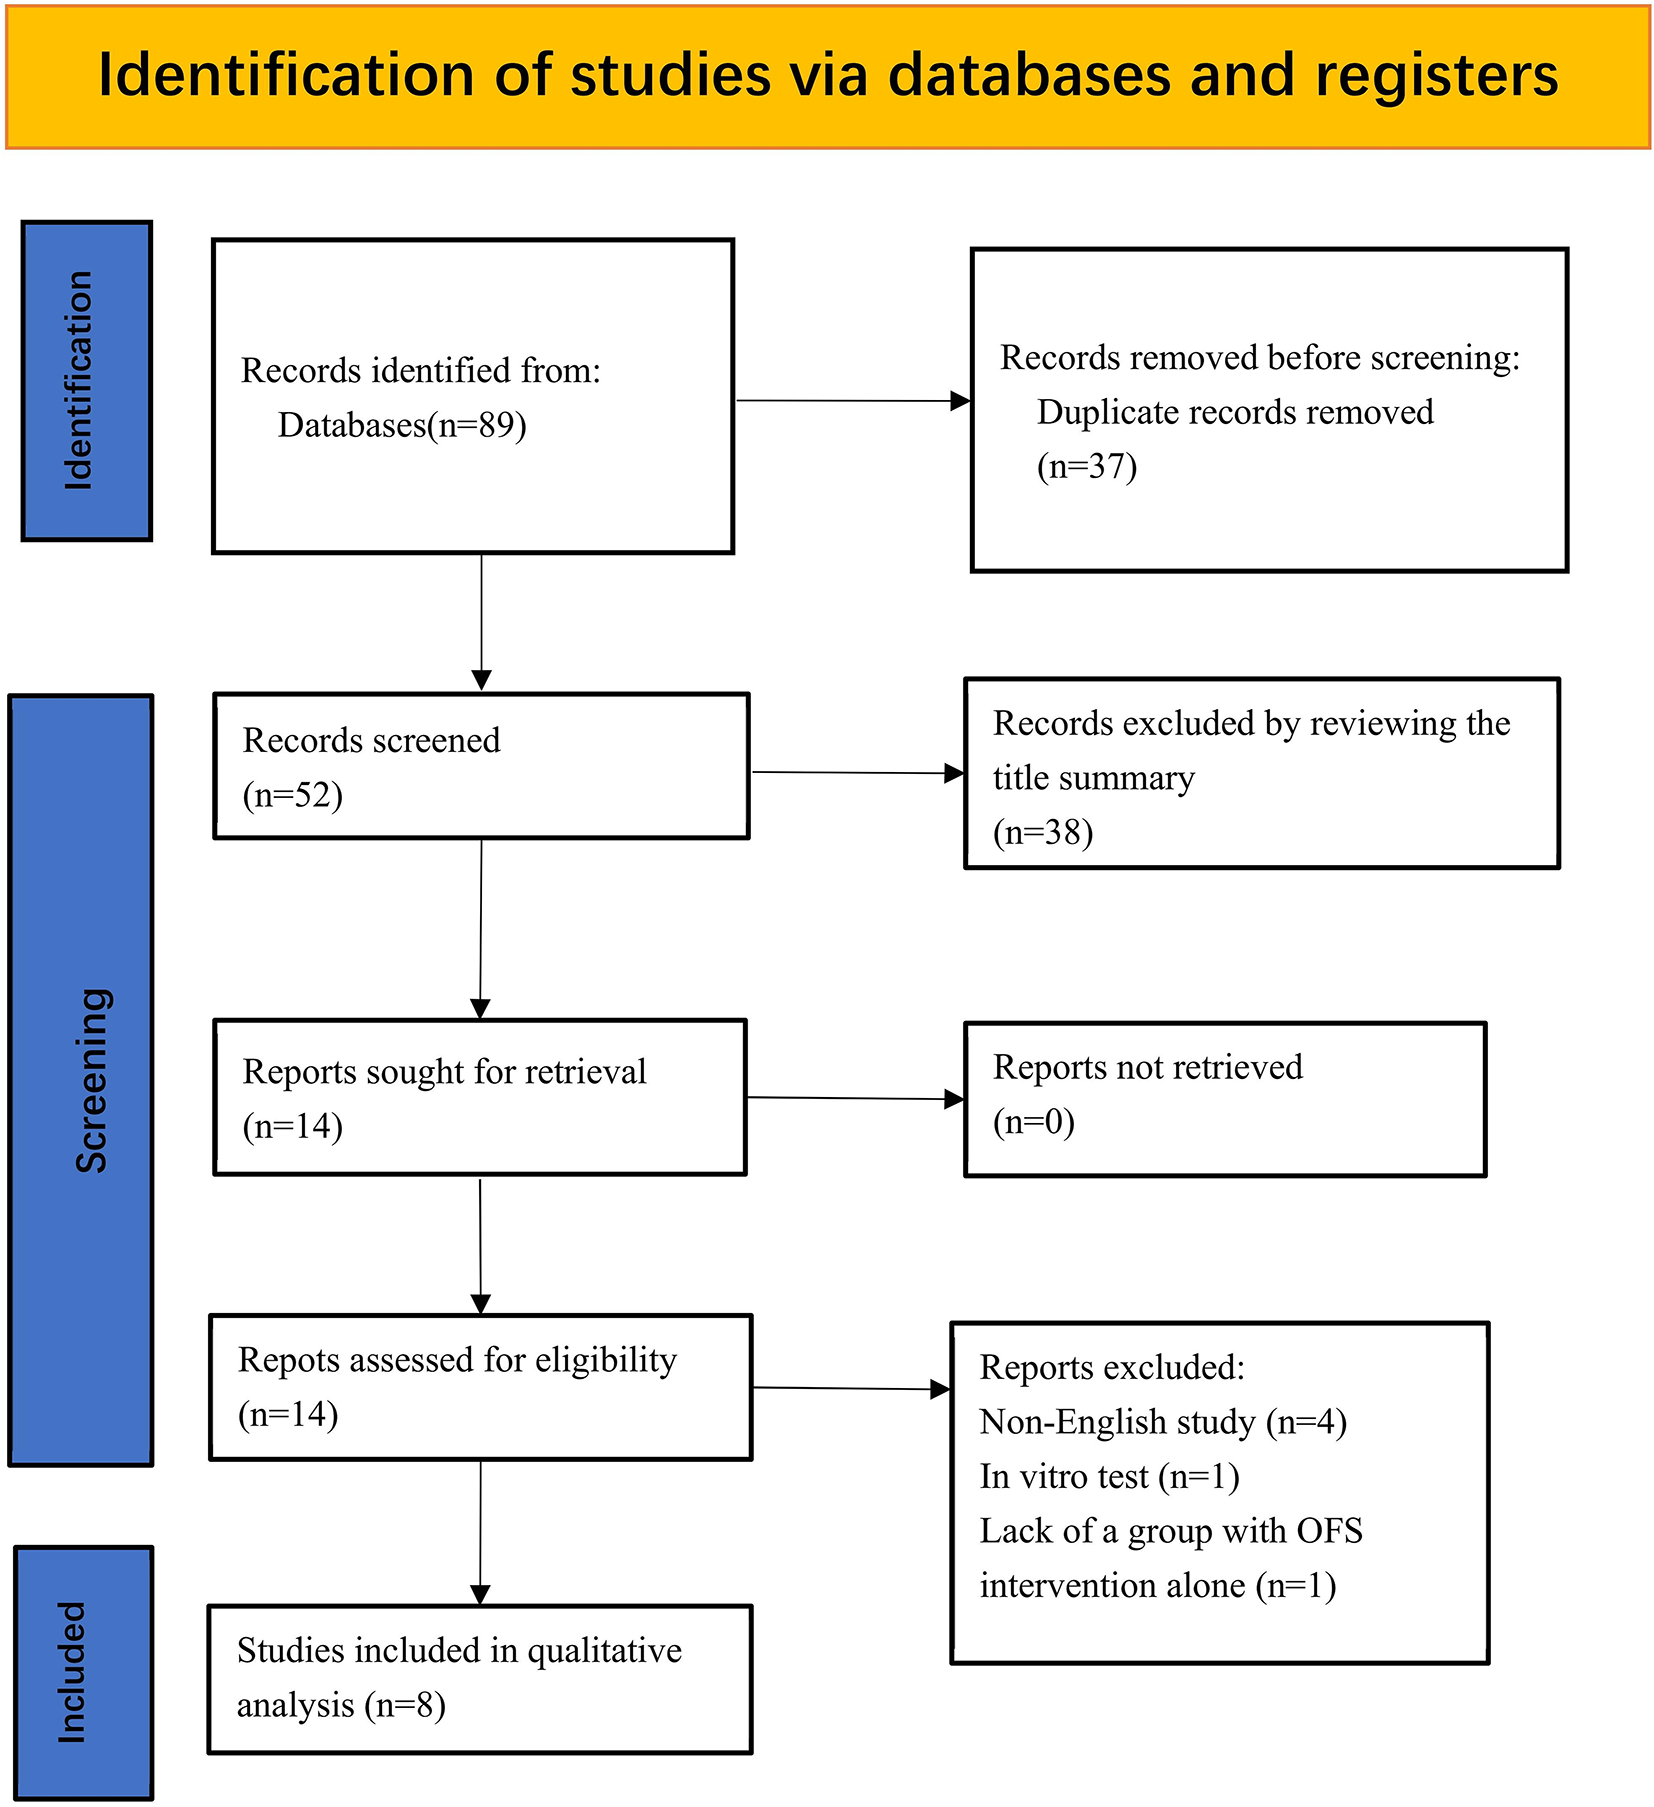


A total of 89 records were retrieved from the database. After deduplication, 52 records remained. Based on the objectives of this systematic review, the titles and abstracts of the identified articles were screened, leading to the inclusion of 14 articles. Following a full-text review in accordance with the inclusion and exclusion criteria, 8 articles were ultimately deemed eligible for qualitative synthesis and meta-analysis [24,25,26,27,28,29,30,31]. Six articles were excluded for the following reasons: one was an in vitro study, one lacked a separate intervention group for OFS, and four were published in non-English languages. The PRISMA flow diagram illustrating the included studies is presented in Fig. 1.
Fig. 1
PRISMA flow diagram for identifying eligible studies
Study quality assessmentWe employed the SYRCLE Risk of Bias (RoB) tool to evaluate the risk of bias for each study. The results of this assessment are summarized in Table 1; Fig. 2. While all studies demonstrated low-risk bias items, several did not adequately report on certain aspects. Utilizing SYRCLE’s RoB tool, we identified 80 entries across 10 relevant criteria. Of these, 34 items indicated low RoB, 46 items were classified as unclear RoB, and none were rated as high RoB. Notably, none of the 8 studies provided clear evidence of randomization; although they mentioned random sequence generation, the specific method used was not reported.
Table 1 Risk of bias summary: review authors’ judgments about each risk of bias item for each included study according to SYRCLE’s risk of bias toolFig. 2
The results of the risk of bias assessment
All studies indicated that baseline characteristics, including age, sex, and weight, were matched. For item 3, all studies were marked as having unclear RoB due to the lack of reported allocation concealment. In item 4, two studies did not specify whether random housing was utilized, resulting in unclear RoB, while the others were rated as low. Items 5 and 6 regarding the intervention received by each animal, researcher blinding, and random outcome assessment were also rated as unclear. For item 7, no study described the method of blinding outcome assessors, leading to unclear RoB for outcome assessment blinding. Three studies did not clarify whether there was data loss, resulting in uncertain RoB for item 8; however, the remaining studies were rated as low RoB for this criterion. The risks of selective reporting and other biases were assessed as low for all studies.
Characteristics of included studiesThe main characteristics of all included studies are summarized in Table 2. Seven studies utilized Sprague-Dawley (SD) rats, while one study employed Wistar rats. The modeling methods used comprised contusion (in seven studies) and compression (in one study). The SCI segments were located at T10 in four studies and T9 in the remaining four studies. Sample sizes across the included studies ranged from 14 to 180 animals. Follow-up durations varied, with three studies having an 8-week follow-up, two studies at 12 weeks, two studies at 4 weeks, and one study at 5 weeks. The oscillating electric field was generated using devices positioned at both the rostral and caudal ends of the injury site, with polarity switched every 15 min, although the strength of the electric field varied among studies.
Table 2 Summary of articles included in the systematic reviewLocomotor function recoveryA meta-analysis was performed on studies that utilized the BBB score to assess motor function at various time points (2 weeks, 4 weeks, 6 weeks, and 8 weeks post-SCI). At the 2-week post-SCI point, six studies were included in the analysis, employing a random effects model. The mean difference (MD) was 0.03 (95% CI [-0.42, 0.48], P = 0.89), indicating no statistically significant difference. However, the heterogeneity was high (I2 = 60%), which may limit the reliability of the results. To address this, we conducted a sensitivity analysis by sequentially excluding each study to assess their individual impact on the overall results. This analysis revealed that the heterogeneity was primarily driven by Study Wang 2022 [24], which employed a different intervention protocol. After excluding Study Wang 2022, the heterogeneity decreased to I2 = 46%, and the MD remained non-significant (MD = 0.17, 95% CI [-0.25, 0.60], P = 0.11), suggesting that the overall conclusion was robust despite the initial heterogeneity (Fig. 3).
Fig. 3
2-week post-SCI BBB score meta-analysis
At the 4-week post-SCI time point, five studies were analyzed using the same random effects model. The MD was 2.87 (95% CI [1.30, 4.44], P < 0.05), demonstrating a statistically significant difference. However, the heterogeneity was very high (I2 = 92%). To explore this further, we performed a sensitivity analysis by excluding Study Fang 2015 [29], which had divergent results. After exclusion, the heterogeneity decreased to I2 = 41%, and the MD remained significant (MD = 2.22, 95% CI [1.50, 2.94], P < 0.05), indicating that the overall effect was consistent despite the methodological variations among studies (Figs. 1 and 4).
Fig. 4
4-week post-SCI BBB score meta-analysis
For the 6-week post-SCI time point, four studies were included, again using a random effects model. The MD was 2.54 (95% CI [1.17, 3.92], P < 0.05), indicating a statistically significant difference. However, the heterogeneity among studies was high (I2 = 88%), which may limit the reliability of the pooled results. To explore the potential sources of heterogeneity and assess the robustness of the findings, we conducted a sensitivity analysis by sequentially excluding each study. This analysis revealed that the exclusion of Study Tian 2016 [26] significantly altered the results, with the MD decreasing to 1.85 (95% CI [0.93, 2.78], P = 0.08) and the heterogeneity reducing to I2 = 60% (Fig. 5). In contrast, the exclusion of other studies did not result in significant changes to the MD or heterogeneity. These findings indicate that Study Tian 2016 [26] has a substantial impact on the overall results. While the inclusion of Study Tian 2016 [26] supports a statistically significant improvement in motor function, its exclusion renders the results non-significant. This highlights the fragility of the findings at the 6-week time point, which is likely attributable to the small number of studies and high heterogeneity.
Fig. 5
6-week post-SCI BBB score meta-analysis
At 8 weeks post-SCI, four studies were analyzed using a random effects model. The MD was 3.00 (95% CI [2.36, 3.65], P < 0.05), showing a statistically significant difference (Fig. 6). These findings suggest that the application of OFS technology can significantly enhance motor function in rats, with notable improvements observed as early as the 4-week mark.
Fig. 6
8-week post-SCI BBB score meta-analysis
Motor evoked potential latency recoveryMEP latency serves as a crucial objective indicator for evaluating the recovery of motor function following SCI, effectively reflecting the loss or alteration of spinal motor capabilities. A meta-analysis was performed on the results from all included studies that utilized MEP latency as an evaluation metric. Four studies were incorporated into the meta-analysis, employing a random effects model. The mean difference (MD) was − 2.09 (95% CI [-2.70, -1.47], P < 0.05, Fig. 7), indicating a statistically significant difference. However, it is important to note that the time points for MEP measurements varied across studies. Three studies reported data at a common time point of 8 weeks post-injury, while one study only [24] provided data at 12 weeks. This variability in measurement timing may have contributed to the observed heterogeneity (I2 = 94%), potentially influencing the comparability and interpretation of the results. To explore the potential sources of heterogeneity, we conducted a sensitivity analysis by sequentially excluding each study. This analysis revealed that the exclusion of any single study did not significantly alter the heterogeneity (I2 remained consistently high, ranging from 88 to 96%). These findings suggest that the high heterogeneity in the MEP latency analysis is not driven by any single study but rather reflects broader methodological or clinical differences among the included studies. Future studies should aim to standardize assessment time points to enhance the consistency and reliability of MEP latency as an outcome measure.
Fig. 7
MEP latency meta-analysis. Note: In contrast to previous figures where higher values indicate improvement, the ‘Favors’ direction is reversed in this figure as reduced MEP latency corresponds to better functional recovery. And MEP latency assessment time points were synchronized at 8 weeks post-SCI across studies, with the exception of Study [24] (12-week measurement)
Narrative synthesis of neural regenerationIn addition to the quantitative assessments, we conducted a descriptive synthesis of the histological indicators of neural regeneration reported in the included studies. Various methods were employed to evaluate neural regeneration, including histological staining, transmission electron microscopy (TEM), immunohistochemistry (IHC), immunofluorescence (IF) staining, and enzyme-linked immunosorbent assay (ELISA). Detailed characteristics of the outcomes from the included studies are summarized in Table 3.Immunofluorescence and immunohistochemistry results demonstrate that OFS effectively promotes neural regeneration. In the included studies, SCI rats that received the OFS intervention showed a significantly higher number of nerve fibers labeled with specific markers such as NF200, NF-L, and NF-H [24, 27, 29], indicating successful regeneration of nerves and axons at the injury site. Additionally, the study by Fang et al. revealed that during the postoperative period, the number of Nestin and β-tubulin III positive cells in the OFS group significantly increased, suggesting that OFS facilitates the differentiation of neural stem cells into neurons [29]. Through electron microscopy observations, Fang et al. reported that both the quantity and thickness of myelin in the OFS group were greater than those in the control group at 14 days post-surgery [29]. Jing et al. employed immunofluorescence to label myelin basic protein (MBP) for detecting mature oligodendrocytes and used Galactocerebrosidase (Galc) to label immature oligodendrocytes. Their results indicated a significant increase in the number of MBP-positive and Galc-positive cells in the OFS group between 4 and 14 days post-SCI [30]. This suggests that OFS promotes the formation of oligodendrocytes and facilitates myelin regeneration. In studies assessing glial scar formation, staining with glial fibrillary acidic protein (GFAP) demonstrated that the number of GFAP-positive cells in the OFS group was consistently significantly lower than in the control group, with the GFAP-positive cells exhibiting a more linear arrangement [24, 25, 30]. This indicates that OFS can inhibit astrocyte proliferation and reduce scar formation.
Table 3 Summary of main outcomes and conclusions of the included studiesThe results consistently indicate that the application of OFS technology can promote neural regeneration and myelin formation, reduce glial scar formation, and enhance the overall histological appearance of the injured spinal cord. This suggests that OFS has a beneficial effect on neuroprotection and regeneration following SCI. However, due to the heterogeneity in study designs and methodologies, a quantitative synthesis of these histological results is not feasible. Consequently, we adopted a descriptive approach to summarize the findings from the studies.
Publication biasTo assess potential publication bias, funnel plots and Egger’s tests were performed for the effect sizes of BBB scores at both 2 weeks and 8 weeks post-SCI.
For the 2-week time point, the funnel plot included five studies (Study Wang 2022 [24] was excluded due to its high heterogeneity). The scatter points were symmetrically distributed within the inverted funnel shape, suggesting a low risk of publication bias (Fig. 8). This finding was further supported by Egger’s test, which showed no significant evidence of publication bias (P > 0.05).
Fig. 8
2-week post-SCI BBB score funnel plot
Similarly, for the 8-week time point, the funnel plot included four studies. The scatter points exhibited a symmetrical distribution within the inverted funnel shape, indicating a low risk of publication bias (Fig. 9). Egger’s test also confirmed this result, demonstrating no significant evidence of publication bias (P > 0.05).
Fig. 9
8-week post-SCI BBB score funnel plot
These findings suggest that the meta-analysis results are robust and unlikely to be influenced by publication bias at both time points. However, it is important to note that the limited number of studies included in the analysis may reduce the statistical power of these tests. Future research with larger sample sizes is needed to further validate these findings.
Comments (0)