Cell culture and LPS treatment
Mouse primary liver parenchymal cells (CTCC-D017-MIC, Meisen Cell, Jinhua, Zhejiang, China) were cultured using the liver parenchymal cell culture system (CTCC-008-PriMed, Meisen Cell) at 37 °C with 5% CO2.
Short hairpin RNA (shRNA) sequences of FKBP1A and AK2 (sh-FKBP1A #1 ~ #3; sh-AK2 #1 ~ #3), the overexpression plasmids of NOTCH1 (Vector-NOTCH1), and the respective controls (sh-Scramble, Vector-NC) used for cell transfection were purchased from VectorBuilder (Guangzhou, Guangdong, China). The above plasmids (shRNAs) were transfected into liver parenchymal cells using Lipofectamin2000 (11,668,500, Thermo Fisher), and the following assays were performed 48 h later.
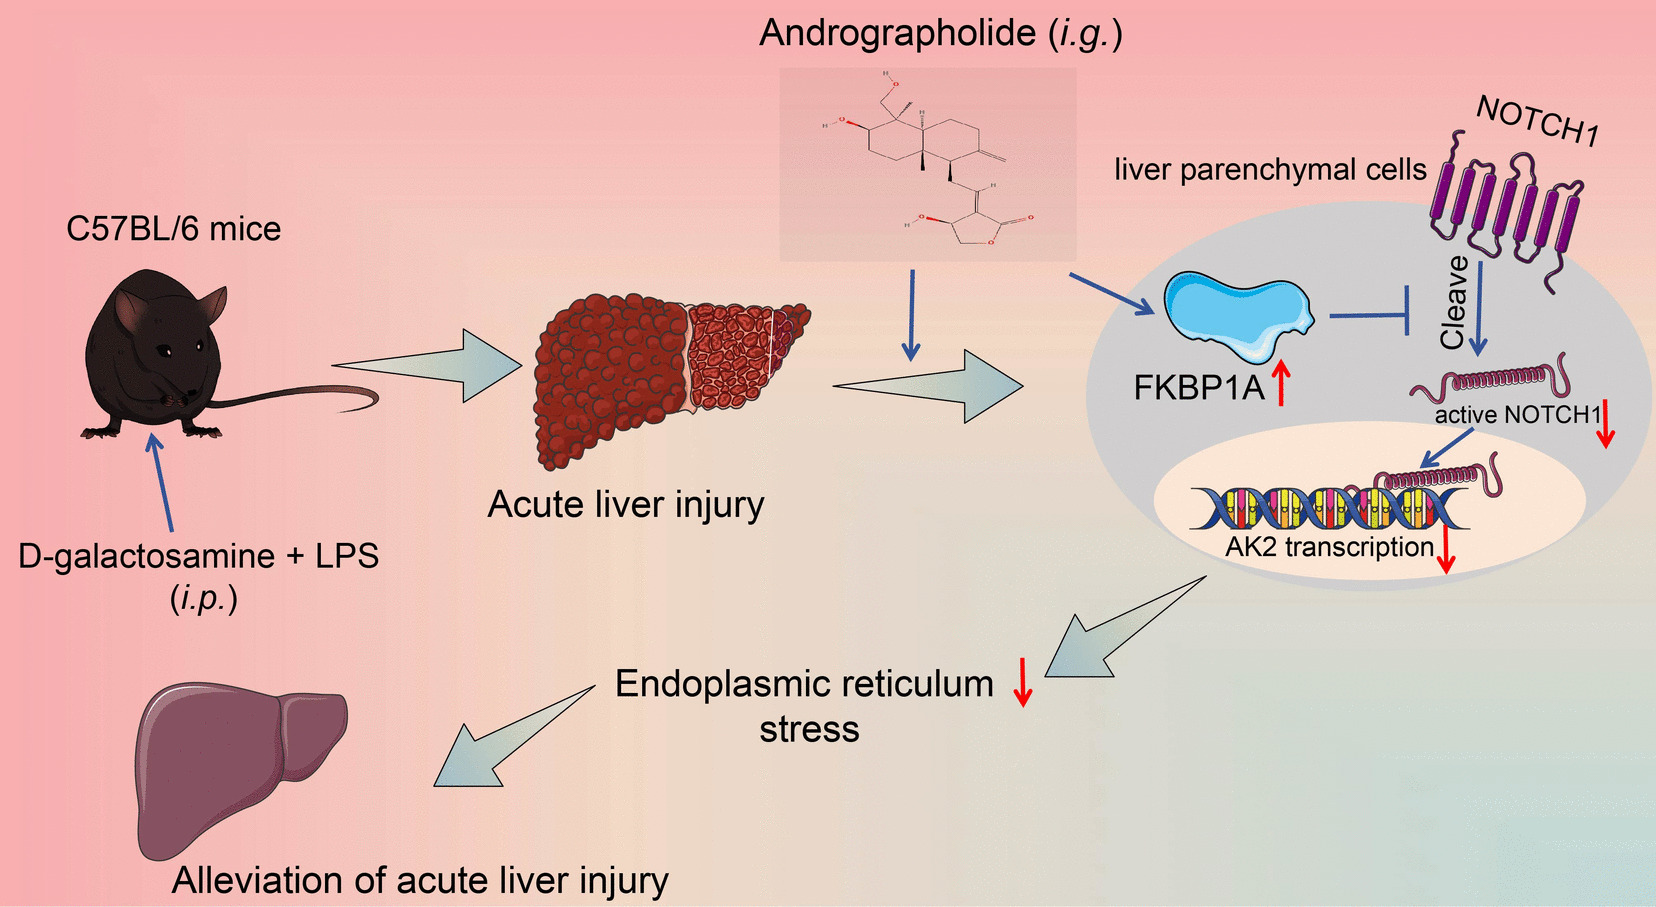
To analyze the dose-dependent toxicity of AP on liver parenchymal cells, they were treated with graded concentrations of AP (0, 10, 20, 40, 60, 80 μM; catalog number: V0768; InvivoChem, Guangzhou, Guangdong, China) for 6 h. Primary liver parenchymal cells were incubated with LPS (500 ng/mL) for 6 h in the presence or absence of AP to mimic ALI, and normal saline (NS)-treated primary liver parenchymal cells were used as a control (Liu et al. 2020).
Animals and treatments
The study protocols were approved by the Institutional Animal Care and Use Committee of the Huadong Hospital Affiliated to Fudan University (approval number: 2021K010, experimental animal's use license: SYXK (Shanghai) 2020–0032). Male C57BL/6 mice (8-weeks, 22–25 g, catalog number: VSM10001) were purchased from Viewsolid (Beijing, China). Referring to a previous report (Zhang et al. 2020), sepsis-induced ALI was developed in mice by injection of 200 mg/kg D-galactosamine (G0500, Sigma-Aldrich Chemical Company, St Louis, MO, USA) and 3 mg/kg LPS (L2630, Sigma-Aldrich), i.p. NS-treated mice were used as controls. The animals were observed for survival (n = 8 for each group), and the surviving mice were euthanized by sodium pentobarbital at 150 mg/kg (i.p.) 36 h after ALI modeling. Serum and liver tissues were collected. Five mice were randomly selected from each group.
Mice requiring AP treatment were gavaged with graded concentrations of AP (20, 50, 100 mg/kg) once daily for 8 consecutive days (Ye et al. 2011). Immediately after the last gavage, the mice were injected with D-galactosamine and LPS to develop the ALI mouse model. The ER stress inhibitor tauroursodeoxycholate (TUDCA, HY-19696, MedChemExpress, Monmouth Junction, NJ, USA) was added to drinking water at a dose of 0.5 g/kg/day (same time as AP treatment) (Qin et al. 2017). For the positive control of AP treatment, 1 mg/kg dexamethasone (DEX, HY-14648, MedChemExpress) was injected subcutaneously into mice (Santos et al. 2001) 1 h before ALI modeling.
Gene expression manipulation was achieved by a single injection of 100 μL of the corresponding lentivirus into the tail vein of mice. The lentiviruses harboring sh-FKBP1A #1 (named LV-FKBP1AKD), the overexpression lentivirus of NOTCH1 (named LV-NOTCH1OE), and the respective control viruses (LV-NCKD, LV-NCOE) were obtained from VectorBuilder. Lentiviral titer was 109 TU/mL, and ALI modeling was performed 2 weeks after lentiviral injection.
Histology and immunohistochemistry (IHC)
Mouse livers were fixed with 4% paraformaldehyde (PFA, P0099, Beyotime, Shanghai, China), paraffin-embedded, and sectioned at 4 μm. After being deparaffinized and hydrated, staining was performed by hematoxylin–eosin (HE) staining solution in the HE Staining Kit (C0105S, Beyotime) for 5 min and by eosin staining solution for 1 min. Histopathological results were assessed microscopically on a scale of 0 to 4 (Zhang et al. 2020a). The specific histopathological score criteria are described in Table 1.
Table 1 Histopathological Scoring system of liver tissuesLiver sections were sealed with 10% goat serum (SBJ-SE-GO012, SenBeiJia, Nanjing, Jiangsu, China) for 1 h and treated with 3% H2O2 (H792073, Macklin, Shanghai, China). The sections were incubated with primary antibodies (Table 2) and with the secondary antibody at room temperature (RM) for 1 h. Positive staining was visualized using the DAB HRP color development Kit (P0203, Beyotime), followed by hematoxylin counter-staining. The sections were viewed under a light microscope (Olympus Optical Co., Ltd., Tokyo, Japan), and positive staining was quantified by ImageJ software.
Table 2 List of antibodies used in this studyFor dual-labeling immunohistochemistry, rabbit anti-FKBP1A or NOTCH1 was used, followed by re-probing with a secondary antibody for 1 h at RM in darkness. Live parenchymal cells were labeled by Alexa Fluor 488-coupled mouse anti-Cytokeratin 18 (CK-18) at RM for 1 h in darkness, and the nuclei of the cells were counter-stained by DAPI (C1006, Beyotime). After sealing, the sections were viewed under a fluorescence microscope.
Biochemical analysis
Cytokine concentrations in mouse serum samples or cell culture supernatant from liver parenchymal cells were examined using Mouse ALT ELISA Kit (CSB-E16539m), AST ELISA Kit (CSB-E12649m), TNF-α ELISA Kit (CSB-E04741m), and IFN-γ ELISA Kit (CSB-E04578m). All operations are carried out according to the manufacturer's (Cusabio Biotech, Newark, DE, USA) protocols.
Western blot analyses
Protein extracts of liver parenchymal cells were prepared in RIPA lysis buffer (89,901, Thermo Fisher Scientific). After quantification, equal amounts of proteins (20 μg) were separated by 10%−12% SDS-PAGE and transferred to a PVDF membrane. After being sealed with 5% BSA, the membranes were probed with primary antibodies (Table 2) overnight at 4 °C and with the secondary antibody at RM for 1 h. Finally, target protein blots were visualized by enhanced chemiluminescence using the BeyoECL Plus kit (P0018M, Beyotime) and quantified by ImageJ.
CCK-8 assay
Liver parenchymal cells were plated into 96-well plates at 5000 cells/well and subjected to the indicated treatment (LPS or/and AP). Subsequently, 10 μL of CCK-8 solution (C0037, Beyotime) was added to the cells, and incubation was continued for 2 h at RM. The relative viability of the cells was analyzed by reading the OD at 450 nm and normalizing to the control.
TUNEL assay
One-Step TUNEL Apoptosis Assay Kit (YT135, Biolab, Beijing, China) was used. For liver parenchymal cells, the cells were treated with 4% PFA for 30 min, with PBS (C0221A, Beyotime) containing 0.3% Triton X-100 (QN0247, Biolab, Beijing, China) for 5 min at RM, and with the TUNEL assay solution for 1 h in darkness. After counter-staining the nuclei with DAPI and blocking with an anti-fluorescence quenching blocking solution, the cells were viewed under a fluorescence microscope (Carl Zeiss, Oberkochen, Germany). For mouse liver sections, 20 μg/mL of DNase-free proteinase K (ST535, Beyotime) was supplemented dropwise for a 30-min incubation at 37 °C. The remaining staining steps were the same as for cell staining.
RT-qPCR
Total RNA was isolated from liver parenchymal cells using TRIzol (15596018CN, Thermo Fisher) and converted to cDNA using the HiScript II 1st Strand cDNA Synthesis Kit (R211-01, Vazyme, Nanjing, Jiangsu, China). The cDNA obtained from reverse transcription was subjected to a tenfold gradient dilution, followed by the qPCR reaction using AceQ qPCR SYBR Green Master Mix (Q121, Vazyme) on a Bio-Rad CFX96. At the end of the qPCR reaction, a calibration curve was made using the cDNA dilution log value as the X-axis and the corresponding Ct value as the Y-axis. According to the MIQE guidelines: minimum information for publication of quantitative real-time PCR experiments (Bustin et al. 2009), amplification efficiency determined from the slope of the log-linear portion of the calibration curve, with PCR efficiency = 10–1/slope−1. The PCR efficiency of all primers used was greater than 90%. The gene expression was calculated using the 2−ΔΔ Ct method, and the primer sequences (OriGene Technologies, Beijing, China) are provided in Table 3.
Table 3 List of primers used in this studyChIP assay
The Pierce Agarose ChIP Kit (26,156, Thermo Scientific) was used. Liver parenchymal cells were cross-linked with 1% formaldehyde, and chromatin was sheared by proteinase K and micrococcal nuclease. Immunoprecipitation was then performed with anti-NOTCH1 (1:200, MA5-35,256, Invitrogen Inc., Carlsbad, CA, USA) or normal rabbit IgG (1:200, Thermo Scientific), and immunoprecipitated DNA was collected and purified. The extent of AK2 promoter enrichment was analyzed by qPCR.
Luciferase assays
An AK2 promoter luciferase reporter was generated by inserting the promoter fragment of AK2 into the pGL3-Basic vector (E1751, Promega Corporation, Madison, WI, USA). Liver parenchymal cells were plated into 96-well plates and cultured to 70% confluence. Overexpression DNA vectors and control vectors of NOTCH1 and AK2 promoter reporter were transfected into cells using Lipofectamin2000 for 48 h. The Dual-Luciferases Reporter Assay System (E1910, Promega) was used for evaluation.
Quantification and statistical analyses
The sample size for the animal experiments (n = 8 or 5/group) was based on a published report (Wu et al. 2022). It was confirmed that the power of the test(1-β) was greater than 0.8 at α = 0.05 for all the selected sample sizes using post hoc analysis in Gpower software (v3.1.9.7). All data are presented as mean ± SEM. The difference between the two groups was tested by unpaired t-tests, and the difference between multiple groups was assessed by one-way ANOVA, followed by Tukey's or Dunnett's post hoc test using GraphPad Prism 8.0.2 (GraphPad, San Diego, CA, USA). Differences between multiple groups were statistically significant when p < 0.05.


Comments (0)